185 Repositories
Python Matplotlib-practice Libraries

Simple GUI python app to show a stocks graph performance. Made with Matplotlib and Tiingo.
stock-graph-python Simple GUI python app to show a stocks graph performance. Made with Matplotlib and Tiingo. Tiingo API Key You will need to add your
A bot to get Statistics like the Playercount from your Minecraft-Server on your Discord-Server
Hey Thanks for reading me. Warning: My English is not the best I have programmed this bot to show me statistics about the player numbers and ping of m

Python Processing Tool for Vasp Ipnut/Output
PivotPy A Python Processing Tool for Vasp Input/Output. A CLI is available in Powershell, see Vasp2Visual. stylea{text-decoration: none !important;c
Data visualization electromagnetic spectrum
Datenvisualisierung-Elektromagnetischen-Spektrum Anhand des Moduls matplotlib sollen die Daten des elektromagnetischen Spektrums dargestellt werden. D

Homework 2: Matplotlib and Data Visualization
Homework 2: Matplotlib and Data Visualization Overview These data visualizations were created for my introductory computer science course using Python

Data visualization using matplotlib
Data visualization using matplotlib project instructions Top 5 Most Common Coffee Origins In this visualization I used data from Ankur Chavda on Kaggl
Some useful extensions for Matplotlib.
mplx Some useful extensions for Matplotlib. Contour plots for functions with discontinuities plt.contour mplx.contour(max_jump=1.0) Matplotlib has pro

These data visualizations were created as homework for my CS40 class. I hope you enjoy!
Data Visualizations These data visualizations were created as homework for my CS40 class. I hope you enjoy! Nobel Laureates by their Country of Birth
Set of matplotlib operations that are not trivial
Matplotlib Snippets This repository contains a set of matplotlib operations that are not trivial. Histograms Histogram with bins adapted to log scale
Count the frequency of letters or words in a text file and show a graph.
Word Counter By EBUS Coding Club Count the frequency of letters or words in a text file and show a graph. Requirements Python 3.9 or higher matplotlib

📊 Python Flask game that consolidates data from Nasdaq, allowing the user to practice buying and selling stocks.
Web Trader Web Trader is a trading website that consolidates data from Nasdaq, allowing the user to search up the ticker symbol and price of any stock

Data Science Environment Setup in single line
datascienv is package that helps your to setup your environment in single line of code with all dependency and it is also include pyforest that provide single line of import all required ml libraries
This is a practice on Airflow, which is building virtual env, installing Airflow and constructing data pipeline (DAGs)
airflow-test This is a practice on Airflow, which is Builing virtualbox env and setting Airflow on that env Installing Airflow using python virtual en
HW 02 for CS40 - matplotlib practice
HW 02 for CS40 - matplotlib practice project instructions https://github.com/mikeizbicki/cmc-csci040/tree/2021fall/hw_02 Drake Lyric Analysis Bar Char

Simple CLI python app to show a stocks graph performance. Made with Matplotlib and Tiingo.
stock-graph-python Simple CLI python app to show a stocks graph performance. Made with Matplotlib and Tiingo. Tiingo API Key You will need to add your

Seaborn-image is a Python image visualization library based on matplotlib and provides a high-level API to draw attractive and informative images quickly and effectively.
seaborn-image: image data visualization Description Seaborn-image is a Python image visualization library based on matplotlib and provides a high-leve

A collection of neat and practical data science and machine learning projects
Data Science A collection of neat and practical data science and machine learning projects Explore the docs » Report Bug · Request Feature Table of Co

Wikipedia WordCloud App generate Wikipedia word cloud art created using python's streamlit, matplotlib, wikipedia and wordcloud packages
Wikipedia WordCloud App Wikipedia WordCloud App generate Wikipedia word cloud art created using python's streamlit, matplotlib, wikipedia and wordclou
Python example making use of best practice file structure and multithreading.
Python example making use of best practice file structure and multithreading.

Flexitext is a Python library that makes it easier to draw text with multiple styles in Matplotlib
Flexitext is a Python library that makes it easier to draw text with multiple styles in Matplotlib
A practice program to find the LCM i.e Lowest Common Multiplication of two numbers using python without library.
Finding-LCM-using-python-from-scratch Here, I write a practice program to find the LCM i.e Lowest Common Multiplication of two numbers using python wi
An adaptable Snakemake workflow which uses GATKs best practice recommendations to perform germline mutation calling starting with BAM files
Germline Mutation Calling This Snakemake workflow follows the GATK best-practice recommandations to call small germline variants. The pipeline require

A best practice for tensorflow project template architecture.
A best practice for tensorflow project template architecture.
Some examples with MatPlotLib library in Python
MatPlotLib Example Some examples with MatPlotLib library in Python Point: Run files only in project's directory About me Full name: Matin Ardestani Ag
Leetcode Practice
LeetCode Practice Description This is my LeetCode Practice. Visit LeetCode Website for detailed question description. The code in this repository has
An open-source Python project series where beginners can contribute and practice coding.
Python Mini Projects A collection of easy Python small projects to help you improve your programming skills. Table Of Contents Aim Of The Project Cont
649 Pokémon palettes as CSVs, with a Python lib to turn names/IDs into palettes, or MatPlotLib compatible ListedColormaps.
PokePalette 649 Pokémon, broken down into CSVs of their RGB colour palettes. Complete with a Python library to convert names or Pokédex IDs into eithe

Example of animated maps in matplotlib + geopandas using entire time series of congressional district maps from UCLA archive. rendered, interactive version below
Example of animated maps in matplotlib + geopandas using entire time series of congressional district maps from UCLA archive. rendered, interactive version below

prettymaps - A minimal Python library to draw customized maps from OpenStreetMap data.
A small set of Python functions to draw pretty maps from OpenStreetMap data. Based on osmnx, matplotlib and shapely libraries.
Causal Inference and Machine Learning in Practice with EconML and CausalML: Industrial Use Cases at Microsoft, TripAdvisor, Uber
Causal Inference and Machine Learning in Practice with EconML and CausalML: Industrial Use Cases at Microsoft, TripAdvisor, Uber

Attractors is a package for simulation and visualization of strange attractors.
attractors Attractors is a package for simulation and visualization of strange attractors. Installation The simplest way to install the module is via
This package creates clean and beautiful matplotlib plots that work on light and dark backgrounds
This package creates clean and beautiful matplotlib plots that work on light and dark backgrounds. Inspired by the work of Edward Tufte.

StarGAN2 for practice
StarGAN2 for practice This version of StarGAN2 (coined as 'Post-modern Style Transfer') is intended mostly for fellow artists, who rarely look at scie

Matplotlib colormaps from the yt project !
cmyt Matplotlib colormaps from the yt project ! Colormaps overview The following colormaps, as well as their respective reversed (*_r) versions are av
a baseline to practice
ccks2021_track3_baseline a baseline to practice 路径可能会有问题,自己改改 torch==1.7.1 pyhton==3.7.1 transformers==4.7.0 cuda==11.0 this is a baseline, you can fi
ML models implementation practice
Let's implement various ML algorithms with numpy/tf Vanilla Neural Network https://towardsdatascience.com/lets-code-a-neural-network-in-plain-numpy-ae

Handout for the tutorial "Creating publication-quality figures with matplotlib"
Handout for the tutorial "Creating publication-quality figures with matplotlib"

Matplotlib tutorial for beginner
matplotlib is probably the single most used Python package for 2D-graphics. It provides both a very quick way to visualize data from Python and publication-quality figures in many formats. We are going to explore matplotlib in interactive mode covering most common cases.

Visual Weather api. Returns beautiful pictures with the current weather.
VWapi Visual Weather api. Returns beautiful pictures with the current weather. Installation: sudo apt update -y && sudo apt upgrade -y sudo apt instal
Simple python implementation with matplotlib to manually fit MIST isochrones to Gaia DR2 color-magnitude diagrams
Simple python implementation with matplotlib to manually fit MIST isochrones to Gaia DR2 color-magnitude diagrams
Learn chords with your MIDI keyboard !
miditeach miditeach is a music learning tool that can be used to practice your chords skills with a midi keyboard 🎹 ! Features Midi keyboard input se

Automatic Attendance marker for LMS Practice School Division, BITS Pilani
LMS Attendance Marker Automatic script for lazy people to mark attendance on LMS for Practice School 1. Setup Add your LMS credentials and time slot t

A Curated Collection of Awesome Python Scripts
A Curated Collection of Awesome Python Scripts that will make you go wow. This repository will help you in getting those green squares. Hop in and enjoy the journey of open source. 🚀

Print matplotlib colors
mplcolors Tired of searching "matplotlib colors" every week/day/hour? This simple script displays them all conveniently right in your terminal emulato

A Python library for plotting hockey rinks with Matplotlib.
Hockey Rink A Python library for plotting hockey rinks with Matplotlib. Installation pip install hockey_rink Current Rinks The following shows the cus
Design your own matplotlib stylefile interactively
Tired of playing with font sizes and other matplotlib parameters every time you start a new project or write a new plotting function? Want all you plots have the same style? Use matplotlib configuration files!
A complete guide to start and improve in machine learning (ML)
A complete guide to start and improve in machine learning (ML), artificial intelligence (AI) in 2021 without ANY background in the field and stay up-to-date with the latest news and state-of-the-art techniques!

Algorithmic trading using machine learning.
Algorithmic Trading This machine learning algorithm was built using Python 3 and scikit-learn with a Decision Tree Classifier. The program gathers sto

Easily convert matplotlib plots from Python into interactive Leaflet web maps.
mplleaflet mplleaflet is a Python library that converts a matplotlib plot into a webpage containing a pannable, zoomable Leaflet map. It can also embe

High-level geospatial data visualization library for Python.
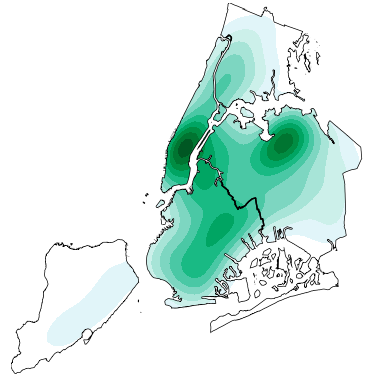
geoplot: geospatial data visualization geoplot is a high-level Python geospatial plotting library. It's an extension to cartopy and matplotlib which m
basemap - Plot on map projections (with coastlines and political boundaries) using matplotlib.
Basemap Plot on map projections (with coastlines and political boundaries) using matplotlib. ⚠️ Warning: this package is being deprecated in favour of

Detect and fix skew in images containing text
Alyn Skew detection and correction in images containing text Image with skew Image after deskew Install and use via pip! Recommended way(using virtual
All the essential resources and template code needed to understand and practice data structures and algorithms in python with few small projects to demonstrate their practical application.
Data Structures and Algorithms Python INDEX 1. Resources - Books Data Structures - Reema Thareja competitiveCoding Big-O Cheat Sheet DAA Syllabus Inte

PArallel Distributed Deep LEarning: Machine Learning Framework from Industrial Practice (『飞桨』核心框架,深度学习&机器学习高性能单机、分布式训练和跨平台部署)
English | 简体中文 Welcome to the PaddlePaddle GitHub. PaddlePaddle, as the only independent R&D deep learning platform in China, has been officially open

Visual analysis and diagnostic tools to facilitate machine learning model selection.
Yellowbrick Visual analysis and diagnostic tools to facilitate machine learning model selection. What is Yellowbrick? Yellowbrick is a suite of visual
Painlessly create beautiful matplotlib plots.
Announcement Thank you to everyone who has used prettyplotlib and made it what it is today! Unfortunately, I no longer have the bandwidth to maintain
sangha, pronounced "suhng-guh", is a social networking, booking platform where students and teachers can share their practice.
Flask React Project This is the backend for the Flask React project. Getting started Clone this repository (only this branch) git clone https://github

StyleGAN2-ada for practice
This version of the newest PyTorch-based StyleGAN2-ada is intended mostly for fellow artists, who rarely look at scientific metrics, but rather need a working creative tool. Tested on Python 3.7 + PyTorch 1.7.1, requires FFMPEG for sequence-to-video conversions. For more explicit details refer to the original implementations.
🧇 Make Waffle Charts in Python.
PyWaffle PyWaffle is an open source, MIT-licensed Python package for plotting waffle charts. It provides a Figure constructor class Waffle, which coul

A python package for animating plots build on matplotlib.
animatplot A python package for making interactive as well as animated plots with matplotlib. Requires Python = 3.5 Matplotlib = 2.2 (because slider

Joyplots in Python with matplotlib & pandas :chart_with_upwards_trend:
JoyPy JoyPy is a one-function Python package based on matplotlib + pandas with a single purpose: drawing joyplots (a.k.a. ridgeline plots). The code f

:small_red_triangle: Ternary plotting library for python with matplotlib
python-ternary This is a plotting library for use with matplotlib to make ternary plots plots in the two dimensional simplex projected onto a two dime
Statistical data visualization using matplotlib
seaborn: statistical data visualization Seaborn is a Python visualization library based on matplotlib. It provides a high-level interface for drawing
matplotlib: plotting with Python
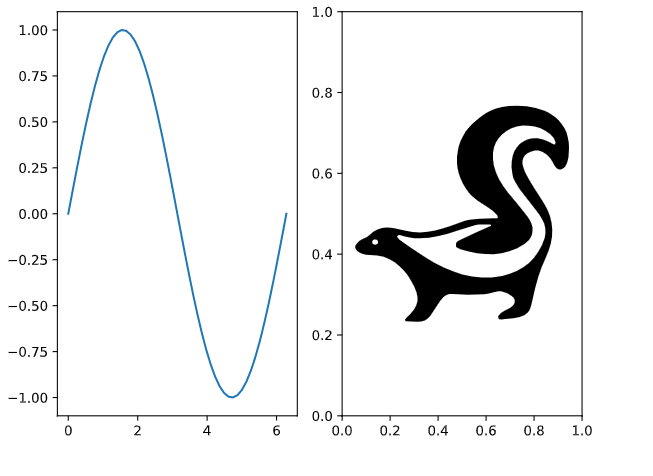
Matplotlib is a comprehensive library for creating static, animated, and interactive visualizations in Python. Check out our home page for more inform
🧇 Make Waffle Charts in Python.
PyWaffle PyWaffle is an open source, MIT-licensed Python package for plotting waffle charts. It provides a Figure constructor class Waffle, which coul

A python package for animating plots build on matplotlib.
animatplot A python package for making interactive as well as animated plots with matplotlib. Requires Python = 3.5 Matplotlib = 2.2 (because slider

Joyplots in Python with matplotlib & pandas :chart_with_upwards_trend:
JoyPy JoyPy is a one-function Python package based on matplotlib + pandas with a single purpose: drawing joyplots (a.k.a. ridgeline plots). The code f

:small_red_triangle: Ternary plotting library for python with matplotlib
python-ternary This is a plotting library for use with matplotlib to make ternary plots plots in the two dimensional simplex projected onto a two dime
Statistical data visualization using matplotlib
seaborn: statistical data visualization Seaborn is a Python visualization library based on matplotlib. It provides a high-level interface for drawing
matplotlib: plotting with Python
Matplotlib is a comprehensive library for creating static, animated, and interactive visualizations in Python. Check out our home page for more inform

PArallel Distributed Deep LEarning: Machine Learning Framework from Industrial Practice (『飞桨』核心框架,深度学习&机器学习高性能单机、分布式训练和跨平台部署)
English | 简体中文 Welcome to the PaddlePaddle GitHub. PaddlePaddle, as the only independent R&D deep learning platform in China, has been officially open
pprofile + matplotlib = Python program profiled as an awesome heatmap!
pyheat Profilers are extremely helpful tools. They help us dig deep into code, find and understand performance bottlenecks. But sometimes we just want
Mypy stubs, i.e., type information, for numpy, pandas and matplotlib
Mypy type stubs for NumPy, pandas, and Matplotlib This is a PEP-561-compliant stub-only package which provides type information for matplotlib, numpy

NorthPitch is a python soccer plotting library that sits on top of Matplotlib
NorthPitch is a python soccer plotting library that sits on top of Matplotlib.
A Google Charts API for Python, meant to be used as an alternative to matplotlib.
GooPyCharts A Google Charts API for Python 2 and 3, meant to be used as an alternative to matplotlib. Syntax is similar to MATLAB. The goal of this pr
The windML framework provides an easy-to-use access to wind data sources within the Python world, building upon numpy, scipy, sklearn, and matplotlib. Renewable Wind Energy, Forecasting, Prediction
windml Build status : The importance of wind in smart grids with a large number of renewable energy resources is increasing. With the growing infrastr
Crab is a flexible, fast recommender engine for Python that integrates classic information filtering recommendation algorithms in the world of scientific Python packages (numpy, scipy, matplotlib).
Crab - A Recommendation Engine library for Python Crab is a flexible, fast recommender engine for Python that integrates classic information filtering r

A series of convenience functions to make basic image processing operations such as translation, rotation, resizing, skeletonization, and displaying Matplotlib images easier with OpenCV and Python.
imutils A series of convenience functions to make basic image processing functions such as translation, rotation, resizing, skeletonization, and displ

Launched in 2018 Actively developed and supported. Supports tkinter, Qt, WxPython, Remi (in browser). Create custom layout GUI's simply. Python 2.7 & 3 Support. 200+ Demo programs & Cookbook for rapid start. Extensive documentation. Examples using Machine Learning(GUI, OpenCV Integration, Chatterbot), Floating Desktop Widgets, Matplotlib + Pyplot integration, add GUI to command line scripts, PDF & Image Viewer. For both beginning and advanced programmers .
Python GUIs for Humans Transforms the tkinter, Qt, WxPython, and Remi (browser-based) GUI frameworks into a simpler interface. The window definition i
Statistical data visualization using matplotlib
seaborn: statistical data visualization Seaborn is a Python visualization library based on matplotlib. It provides a high-level interface for drawing
Cartopy - a cartographic python library with matplotlib support
Cartopy is a Python package designed to make drawing maps for data analysis and visualisation easy. Table of contents Overview Get in touch License an
All Algorithms implemented in Python
The Algorithms - Python All algorithms implemented in Python (for education) These implementations are for learning purposes only. Therefore they may

