skunk 

Insert SVGs into matplotlib
pip install skunk
Jupyter Notebooks
To show generated SVGs in Jupyter Notebooks: Currently, axes are cutoff when viewed in jupyter - I think due to restrictive viewport. Save to file to get publication ready version
skunk.display(svg)
Overwrite Subplot
import skunk
import numpy as np
import os
import matplotlib.pyplot as plt

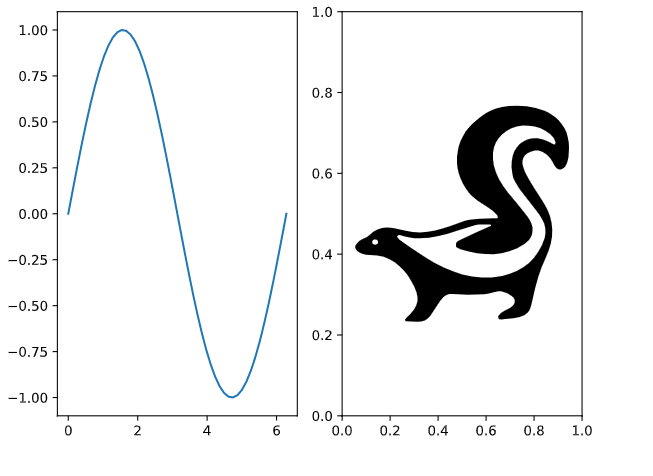
fig, axs = plt.subplots(ncols=2)

x = np.linspace(0, 2 * np.pi)
axs[0].plot(x, np.sin(x))

# important line where we set ID
skunk.connect(axs[1], 'sk')

plt.tight_layout()

# Overwrite using file path to my svg
# Can also use string
svg = skunk.insert(
    {
        'sk': 'skunk.svg'
    })

with open('replaced.svg', 'w') as f:
    f.write(svg)
Output
SVG in Annotation
Read about annotation boxes first
import numpy as np

fig, ax = plt.subplots()

x = np.linspace(0, 2 * np.pi)
ax.plot(x, np.sin(x))

# new code: using skunk box with id sk1
box = skunk.Box(50, 50, 'sk1')
ab = AnnotationBbox(box, (np.pi / 2, 1),
                    xybox=(-5, -100),
                    xycoords='data',
                    boxcoords='offset points',
                    arrowprops=dict(arrowstyle="->"))
ax.add_artist(ab)

# sknunk box with id sk2
box = skunk.Box(50, 50, 'sk2')
ab = AnnotationBbox(box, (3 * np.pi / 2, -1),
                    xybox=(-5, 100),
                    xycoords='data',
                    boxcoords='offset points',
                    arrowprops=dict(arrowstyle="->"))

ax.add_artist(ab)

# insert current figure into itself at sk1
# insert svg file in sk2
svg = skunk.insert(
    {
        'sk1': skunk.pltsvg(),
        'sk2': 'skunk.svg'
    })

with open('replaced2.svg', 'w') as f:
    f.write(svg)


