matplotlib: plotting with Python

Overview

PyPi Downloads NUMFocus

DiscourseBadge Gitter GitHubIssues GitTutorial

Travis AzurePipelines AppVeyor Codecov LGTM

Matplotlib is a comprehensive library for creating static, animated, and interactive visualizations in Python.

Check out our home page for more information.

https://matplotlib.org/_static/readme_preview.png

Matplotlib produces publication-quality figures in a variety of hardcopy formats and interactive environments across platforms. Matplotlib can be used in Python scripts, the Python and IPython shell, web application servers, and various graphical user interface toolkits.

Install

For installation instructions and requirements, see INSTALL.rst or the install documentation.

Test

After installation, launch the test suite:

python -m pytest

Read the testing guide for more information and alternatives.

Contribute

You've discovered a bug or something else you want to change - excellent!

You've worked out a way to fix it – even better!

You want to tell us about it – best of all!

Start at the contributing guide!

Contact

Discourse is the discussion forum for general questions and discussions and our recommended starting point.

Our active mailing lists (which are mirrored on Discourse) are:

Gitter is for coordinating development and asking questions directly related to contributing to matplotlib.

Citing Matplotlib

If Matplotlib contributes to a project that leads to publication, please acknowledge this by citing Matplotlib.

A ready-made citation entry is available.

Comments
  • MEP27 Decouple pyplot from backends (refactoring Gcf out of backend code)

    MEP27 Decouple pyplot from backends (refactoring Gcf out of backend code)

    This PR exists as an alternative to https://github.com/matplotlib/matplotlib/pull/2624

    See https://github.com/OceanWolf/matplotlib/blob/backend-refactor/doc/devel/MEP/MEP27.rst for details.

    Tl;dr: FigureManagerBase :arrow_right: FigureManager + WindowBase ShowBase :arrow_right: Gcf.show_all + MainLoopBase

    The main refactor (+gtk3 as an example) goes here, and will have no effect on the individual backends, work for other backends will occur in separate branches as indicated.

    • [ ] MacOSX
    • [ ] GTK
      • [ ] GTKCairo
      • [ ] GTKAgg
    • [ ] NbAgg
    • [x] WebAgg https://github.com/OceanWolf/matplotlib/compare/backend-refactor...OceanWolf:backend-refactor-webagg (still W-I-P, but will deal with last items in its PR)
    • [x] Wx https://github.com/OceanWolf/matplotlib/compare/backend-refactor...backend-refactor-wx
      • [x] WxAgg
    • [x] Qt https://github.com/OceanWolf/matplotlib/compare/backend-refactor...OceanWolf:backend-refactor-qt
      • [x] Qt4Agg
      • [x] Qt5Agg
    • [x] TkAgg https://github.com/OceanWolf/matplotlib/compare/backend-refactor...OceanWolf:backend-refactor-tkagg
      • [ ] Remove tools.SaveFigureBase
    • [x] GTK3 in this branch
      • [x] GTK3Cairo
      • [x] GTK3Agg

    To accomplish this, we shall do this in two passes:

    1. The first pass we refactor out all generic backend code out of the gtk3 backend, replacing these with common methods, i.e. we refactor out Gcf to backend_bases.py.
    2. The second pass we then refactor Gcf out from backend_bases.py.
    3. Other backends in separate branches, see list above for progress and make changes to this PR for global changes (none since the 2nd backend).
    MEP: MEP22 MEP: MEP27 
    opened by OceanWolf 193
  • Fix failing tests on maintenance branch

    Fix failing tests on maintenance branch

    Fix failing tests -- many of them were broken due to changes in the snapping algorithm that made the axes off by one pixel. Others were broken due to changes in text alignment. Also fixes a bug in the SVG backend's Gouraud shading.

    Release critical 
    opened by mdboom 131
  • MEP22: Navigation by events

    MEP22: Navigation by events

    This PR is the implementation of MEP22, https://github.com/matplotlib/matplotlib/wiki/Mep22#implementation

    This it supersedes the https://github.com/matplotlib/matplotlib/pull/2759

    Toolbar has been relegated as listener/emiter of events that get dispatched to the Tools by Navigation.

    The toolbar is easily reconfigurable at running time. new tools can be created/added/removed without modificaion of the backend code.

    Example examples/user_interfaces/navigation.py

    MEP: MEP22 
    opened by fariza 114
  • ENH: Added FuncNorm and PiecewiseNorm classes in colors

    ENH: Added FuncNorm and PiecewiseNorm classes in colors

    Summary [Last edit 16/12/2016]:

    This has now been split into different PRs: -Implementing _StringFuncParser (Merged) -Implementing FuncNorm

    Summary [Last edit 25/10/2016]:

    • There is a new class called FuncNorm that can take any function and use it for the normalization. LogNorm, or PowerNorm, could be reimplemented using this.
    • There is a new class PiecewiseNorm inheriting from FuncNorm that allows specifying a list of non-divergent functions (lambda functions or special strings) to map different ranges of the data dynamic range, into different ranges of the colorbar range. It creates internally a np.piecewise function hiding all the complexity of making a piecewise function that maps non-linearly but continuously in different intervals to [0-1].
      • The user has to provide a list of functions, and a list of reference points for the data and the colorbar. For example:
        • Take all data up to -1, and map it linearly to the colorbar range 0-0.3
        • Take all data between -1 and 1, and map it quadratically to the colorbar range 0.3-0.5
        • Take all data after 1, and map it cubically to the colorbar range 0.5-1
        • Specified as: colors.PiecewiseNorm(flist=['linear', 'quadratic', 'cubic'], refpoints_cm=[0.3, 0.5], refpoints_data=[-1., 1.])
      • There are some predefined functions, so the user can specify 'linear', 'quadratic','sqrt',..., and this will be automatically parsed into actual functions. The advantage is that in that case the user does not have to provide the inverse functions because we know them.
      • If the user provides lambda functions instead of a predefined string, then the inverse function is necessary.
      • The only condition for the provided function is that it must be monotonic and not diverge in the [0-1] interval. The class will automatically normalise the provided function so f(0)=0 and f(1)=1.
      • Also, the ticks method is improved to guarantee that there is always one tick in the colorbar at all the interval changes, and that the rest of the ticks available are spread evenly through the colorbar according to the size of each interval, landing at "relatively round" numbers.
      • ```SymLogNorm` could be reimplemented using this.
    • Due to the power of this class, then all subclasses can derive from this:
      • MirrorPiecewiseNorm: It is similar to PiecewiseNorm with two intervals, with the difference that both intervals are not treated equally from a translational point of view, but symetrically. In an scenario where the user would like to amplify features around 0, for both the positive and negative sides symmetrically, but strongly for the negative side, then he would have to do:
        • Set a positive range with f(x)=sqrt(x). Set a negative range with f(x)=-cubicroot(-x+1)+1, which is a bit awkward.
        • MirrorPiecewiseNorm automatically takes care the transformation of the function in the second range internally so the user only has to provide f(x)=sqrt(x) for the positive range, and f(x)=cubicroot(x) for the negative range
      • MirrorRootNorm inheriting from MirrorArbitraryNorm, it would let the user, achieve the same by just specifying colors.MirrorRootNorm(orderpos=2, orderneg=3) .
      • RootNorm inheriting from FuncNorm, to perform root normalization by simply specifying the order colors.RootNorm(order=3).

    TO DO list:

    • [x] Make everything inherit from FuncNorm
    • [x] Implement it to use np.piecewise internally
    • [x] Implement examples
    • [x] Implement tests
    • [x] Include fully documented docstrings with full description and examples

    Some examples of usage and outputs:

    This is an example of an array with a large dynamic range using a regular linear scale. It consist of several regions:

    • (1<y<2) Linear transition between -1 and 0 in the left half, and between 0 and 2 in the right half.
    • (0<y<1) Non linear wavy function: cos(x) * y**2
    • (-0.5<y<0) Series of bumps sitting at zero, growing linearly between 0 and 2.
    • (-1<y<0.5) Series of negative bumps (depressions) sitting at zero, growing deeper between 0 and -1.
    • (-1.5<y<1) Series of small bumps of 0.05 amplitude sitting at -1, -0.8, -0.6, -0.4, -0.2 and 0 and of 0.1 amplitude sitting at 0.4, 0.8, 1.2, 1.6, 2.
    • (-2<y<1.5) Series of negative small bumps of -0.05 amplitude sitting at -1, -0.8, -0.6, -0.4, -0.2 and 0 and of -0.1 amplitude sitting at 0.4, 0.8, 1.2, 1.6, 2. figure_1 figure_0 Example of log normalization using FuncNorm. I have set manually the minimum value to 0.01 to fix the dynamic range that will be plotted. Negative features are not shown.
    norm = colors.FuncNorm(f=lambda x: np.log10(x),
                           finv=lambda x: 10.**(x), vmin=0.01)
    

    figure_2 or alternatively with:

    norm = colors.FuncNorm(f='log',vmin=0.01)
    

    Example of root normalization using FuncNorm. Of course with direct sqrt normalization, negative features cannot be shown.

    norm = colors.FuncNorm(f='sqrt', vmin=0.0)
    

    figure_3

    Performing a symmetric amplification of the features around 0

    norm = colors.MirrorPiecewiseNorm(fpos='crt')
    

    figure_4

    Amplifying positive and negative features standing on 0.6

    norm = colors.MirrorPiecewiseNorm(fpos='crt', fneg='crt',
                                      center_cm=0.35,
                                      center_data=0.6)
    

    figure_5

    Amplifying positive and negative features standing on both -0.4 and 1.2. The bumps in the bottom area (-2<y<-1) sitting at the values -0.4 (light blue) and 1.2 (orange) are amplified, both the positive and the negative bumps. We can observe that the ticks are not exactly equispaced, to have a tick at the interval changes, and at round numbers.

    norm = colors.PiecewiseNorm(flist=['cubic', 'crt', 'cubic', 'crt'],
                                refpoints_cm=[0.25, 0.5, 0.75],
                                refpoints_data=[-0.4, 1, 1.2])
    

    figure_6

    Amplifying only positive features standing on all -1, -0.2 and 1.2. The bumps in the bottom area (-2<y<-1) sitting at the values -1 (black), -0.6 (turquoise) and 1.2 (yellow) are amplified, but in this case only the positive bumps.

    norm = colors.PiecewiseNorm(flist=['crt', 'crt', 'crt'],
                                refpoints_cm=[0.4, 0.7],
                                refpoints_data=[-0.2, 1.2])
    

    figure_7

    API: changes 
    opened by alvarosg 106
  • [WIP] Property Cycling

    [WIP] Property Cycling

    Second attempt at what I am now calling property cycling in order to avoid confusion with style sheets.

    It seems to work for line plots, but I know it isn't working for bar plots. I suspect the same is true for errorbar plots. I have some tests unpushed at this point. I want to figure out the failure with bar plots first.

    opened by WeatherGod 94
  • step-between as drawstyle [Alternative approach to #15019]

    step-between as drawstyle [Alternative approach to #15019]

    PR Summary

    Alternative approach to #15019 where a new where='between' kwarg option is implemented as a Line2D drawstyle, based on comments from @ImportanceOfBeingErnest. This in the end requires a bit of hackery as well, because it seems matplotlib was always expects len(x) == len(y) Notably I am not sure how to properly modify the recache() fcn.

    If this is preferable, we can pursue this instead.

    PR Checklist

    • [x] Has Pytest style unit tests
    • [x] Code is Flake 8 compliant
    • [x] New features are documented, with examples if plot related
    • [x] Documentation is sphinx and numpydoc compliant
    • [x] Added an entry to doc/users/next_whats_new/ if major new feature (follow instructions in README.rst there)
    • [x] Documented in doc/api/api_changes.rst if API changed in a backward-incompatible way
    status: needs rebase status: stale 
    opened by andrzejnovak 87
  • Add easy style sheet selection

    Add easy style sheet selection

    Add easy switching between rcParams based on the implementation in mpltools.style. Basically, just call

    from matplotlib import style
    style.use('ggplot')
    

    ... to switch to a style sheet that sort of mimics ggplot's style.

    Notes:

    • In the current implementation, shipped style files are stored in matplotlib/style/stylelib and user files are stored in ~/.matplotlib/stylelib.
    • ~~I chose *.mplrc as an extension for the style files, but I'm fine with changing that.~~ Style files in the style libraries have the extension ~~*.style~~ *.mplstyle.
    • Ideally there would an rc parameter (or some other mechanism) to easily add search paths for style files
    • ~~One thing I liked in the original implementation was the ability to chain style sheets, with each style sheet adding the parameters they set. The current implementation doesn't work like this because rc_params_from_file initializes the default rcParams and then updates the defaults from the file. Thus, updating using the result from rc_params_from_file will overwrite all values.~~
    opened by tonysyu 82
  • [Bug]: tight_layout (version 3.5+)

    [Bug]: tight_layout (version 3.5+)

    Bug summary

    fig.tight_layout is broken in current matplotlib.

    Code for reproduction

    %pylab
    plot([0,1])
    tight_layout()
    
    # happens same way in object mode
    from matplotlib import pylab as plt
    fig, ax = plt.subplots()
    ax.plot([0,1])
    fig.tight_layout()
    

    Actual outcome

    xxx

    below another example from real code that may be instructive

    xxx

    Expected outcome

    figure scaled to image size, background deleted.

    Additional information

    Happens always.

    I do not recall this issue in version before 3.5

    I have no clue why it is happening. The flaw seems to lay in mpl getting/setting wrong window size when using tight_layout. Maybe gtk unhappy with X11. When I use mpl.use('Qt5Cairo') then it just makes the window and fonts smaller. Obviously, tight_layout should not change physical window size on screen! Similar for Gtk4Cairo. Gtk4Agg has similar issues to Qt5Agg but does not retain noise in background, just shrinks figure. I could be related to DPI settings. It might get them from a different system call than when opening the window?

    The only fix I can find is use other plot package, e.g., plotly.

    Operating system

    Linux 5.16.14-200.fc35.x86_64 #1 SMP PREEMPT Fri Mar 11 20:31:18 UTC 2022 x86_64 x86_64 x86_64 GNU/Linux

    Matplotlib Version

    3.5.1

    Matplotlib Backend

    Qt5Agg

    Python version

    Python 3.10.2

    Jupyter version

    N/A

    Installation

    pip

    status: needs clarification 
    opened by 2sn 76
  • [MRG] Constrained_layout  (geometry manager)

    [MRG] Constrained_layout (geometry manager)

    PR Summary

    This is my implementation of the geometry manager (See #1109).

    This is heavily based on exploratory work by @Tillsten using the kiwi solver, and of course on tight_layout.

    Latest what's new: https://5396-1385122-gh.circle-artifacts.com/0/home/circleci/project/doc/build/html/users/next_whats_new/constrained_layout.html

    Latest tutorial: https://5398-1385122-gh.circle-artifacts.com/0/home/circleci/project/doc/build/html/tutorials/intermediate/constrainedlayout_guide.html#sphx-glr-tutorials-intermediate-constrainedlayout-guide-py

    Intro

    tight_layout() is great for what it does, but it doesn't handle some cases generally. i.e. if we have two GridSpecFromSubplotSpec instances, they need to be positioned manually using tight_layout(). Colorbars for individual axes work fine, but colorbars for more than one axis doesn't work. Etc.

    This PR implements "constrained_layout" via plt.figure(constrained_layout=True) for automatic re-drawing. Currently, it works for subplots and colorbars, legends, and suptitles. Nested gridspecs are respected. Spacing is provided both as a pad around axes and as a space between subplots.

    The following code gives this plot:

    exampleplot

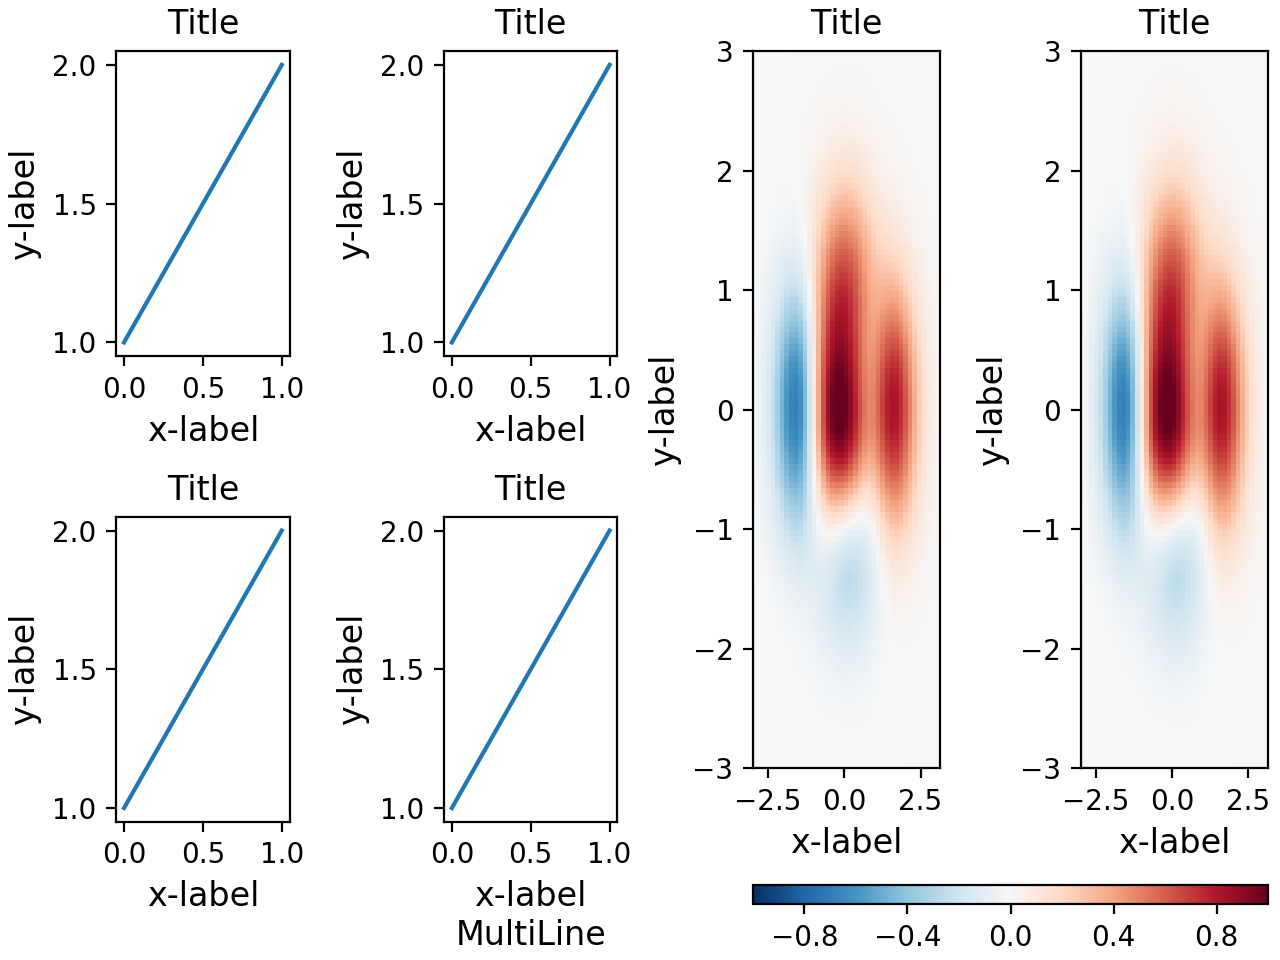
        fig = plt.figure(constrained_layout=True)
        gs = gridspec.GridSpec(1, 2, fig=fig)
        gsl = gridspec.GridSpecFromSubplotSpec(2, 2, gs[0])
        gsr = gridspec.GridSpecFromSubplotSpec(1, 2, gs[1])
        axsl = []
        for gs in gsl:
            ax = fig.add_subplot(gs)
            axsl += [ax]
            example_plot(ax, fontsize=12)
        ax.set_xlabel('x-label\nMultiLine')
        axsr = []
        for gs in gsr:
            ax = fig.add_subplot(gs)
            axsr += [ax]
            pcm = example_pcolor(ax, fontsize=12)
    
        fig.colorbar(pcm, ax = axsr, pad=0.01, 
                 location='bottom', ticks=ticker.MaxNLocator(nbins=5))
    

    A few things to note in the above:

    • all the subplots in the left side set of plots (gsl) have the same margins. They are a bit big because the bottom-right plot has a two-line x-label.
    • the x-ticklabels for the rhs plot overrun, because constrained_layout doesn't do any management at the axis level.

    Installation:

    In addition to the normal matplotlib installation, you will need to involve kiwisolver: pip install kiwisolver now works.

    API dfferences (so far)

    In order to get this to work, there are a couple of API changes:

    1. gridspec.GridSpec now has a fig keyword. If this isn't supplied then constrained_layout won't work.
    2. figure now has a constrained_layout keyword. Currently, I don't have it checking for tight_layout, so they could both run at the same time. These upper level user-facing decisions probaby require input.
    3. Internal calling issue: We don't want axes that have user-called ax.set_position() to participate in constrained_layout, presumably because the user was purposefully putting the axis where they put it. So, that means internally, we set the layoutbox properties of this axis to None. However, ax.set_position gets called internally (i.e. by colorbar and aspect) and for those we presumably want to keep constrained_layout as a possibility. So I made a ax._set_position() for internal calls, which the public ax.set_position() uses. Internal calls to set_position should use _set_position if the axis is to continue to participate in constrained_layout.

    I think most of these changes are backwards compatible, in that if you don't want to use constrained_layout you don't need to change any calls. Backwards compatibility introduces some awkwardness, but is probably worth it.

    Implementation:

    Implementation is via a new package layoutbox.py. Basically a nested array of layoutboxe objects are set up, attached to the figure, the gridspec(s), the subplotspecs. An axes has two layoutboxes: one that contains the tight bounding box of the axes, and the second that contains the "position" of the axes (i.e the rectangle that is passed to ax.set_position()).

    A linear constraint solver is used to decide dimensions. The trick here is that we define margins between an axes bounding box and its position. These margins, and the outer dimesnion of the plot (0,0,1,1) are what constrains the problem externally. Internally, the problem is constrained by relationships between the layoutboxes.

    Tests:

    These are in lib/matplotlib/tests/test_constrainedlayout.py.

    PR Checklist

    • [x] Sort out padding in a non-figure unit
    • [x] Add legend to constrained objects
    • [x] Add kiwi to requirements: need a new release to make OK w/ 2.7. Current requirement works 3.6
    • [x] Has Pytest style unit tests.
    • [x] Code is PEP 8 compliant
    • [x] New features are documented, with examples if plot related
    • [x] Documentation is sphinx and numpydoc compliant
    • [x] Added an entry to doc/users/next_whats_new/ if major new feature (follow instructions in README.rst there)
    • [x] Documented in doc/api/api_changes.rst if API changed in a backward-incompatible way
    • [x] Add suptitle to constrained objects
    • [x] sharex and sharey?
    • [x] Adjust spacing for colorbars; respect pad.
    • [x] Implement respect for wspace and hspace variables. Actually pretty easy.
    • [x] Check set_position axes
    • [x] Spacing between gridspecs
    • [x] gridspec width_ratios and height_ratios
    • [x] twinx, twiny? #5474
    • [x] Extend to putting labels outside tick labels and titles outside of all?
    Release critical topic: geometry manager 
    opened by jklymak 76
  • axes collage

    axes collage

    PR Summary

    This is an attempt at implementing a nicer API for laying out complex axes schemes like patchwork for ggplot. This is following on from a conversation @anntzer and @story645 had a few weeks ago https://hackmd.io/4zWKhuLXQ16Y_oUfi9hnKA#Gridspec-Easy-API and was done on a red-eye flight home

    The big win here is things like

    
    x = [["A", "A", "B"], ["C", "D", "B"]]
    fig = plt.figure()
    axes = fig.build_grid(x)
    axes['A'].plot(...)
    

    do what you expect.

    open questions:

    • [x] Name (Hannah suggested something riffing to "collage" which I think is good if we can make it a verb)
    • [x] does this go in Matplotib or does this go in a small library under the mpl org?
    • [x] better tests of things going wrong
    • [x] be sure that when re-assigning grid specs we clean up all the evidence of the old one (to be sure constrained layout works etc)
    • [x] do we want the expansion logic to work ([['A'], ['B', 'C']] <-> [['A', 'A'][ ['B', 'C']])
    • [x] keys in return dict when adjusting existing axes
    • [ ] ~provide a way to have mixed subplot_kw to each of the created figures~ to do later

    PR Checklist

    • [x] Has Pytest style unit tests
    • [x] Code is Flake 8 compliant
    • [x] New features are documented, with examples if plot related
    • [x] Documentation is sphinx and numpydoc compliant
    • [x] Added an entry to doc/users/next_whats_new/ if major new feature (follow instructions in README.rst there)
    • [x] Documented in doc/api/api_changes.rst if API changed in a backward-incompatible way
    New feature Release critical 
    opened by tacaswell 73
  • ENH: plotting methods can unpack labeled data

    ENH: plotting methods can unpack labeled data

    This is an alternative implementation of a labeled data decorator (see https://github.com/matplotlib/matplotlib/pull/4787)

    Todo

    • [x] add a whatsnew entry in doc/users/whats_new
    • [x] address comments from the code reviews
    • [x] plot() document the problems with 'color spec or next x' ambiguity when the third argument in *args is in data.
    • [x] regenerate pyplot so that the decorated methods gain a data kwarg (or better get all reduced to plt.func(*args, **args) as thats the signature of the decorator.
    • [x] Get someone to review the decorated functions and the code
    • [x] make unittests for all decorated functions
    • [x] get the unittests to run (mule isn't found?)
    • [x] Check all decorated functions if the implicit label_namer="y" is ok. In most cases it probably is not...
    • [x] Check all decorated functions with *args, **kwargs if it would be better to supply argument names
    • [x] check all decorated functions if a rename_names list is better (i.e. don't replace everything but only a few arguments)
    • [x] special case plot(...)
    • [x] update docs with some information about the changed behaviour if data=data is passed in?
    • [x] change label_namer="y" to label_namer=None? None is probably much more used than 'y'...
    • [x] how to handle variable length *args positional_parameter_names={(#args: ["names"]}?
    Release critical 
    opened by jankatins 72
  • Remove contour warning for

    Remove contour warning for "no-valid-levels".

    If the user explicitly passes a levels array (the default is auto-determined), let's assume that they know what they are doing. Closes #23778.

    (I could consider keeping the warning for now in the case where the user didn't pass levels but z is uniform throughout, as that's more likely to be a "data-exploration" case.)

    PR Summary

    PR Checklist

    Documentation and Tests

    • [ ] Has pytest style unit tests (and pytest passes)
    • [ ] Documentation is sphinx and numpydoc compliant (the docs should build without error).
    • [ ] New plotting related features are documented with examples.

    Release Notes

    • [ ] New features are marked with a .. versionadded:: directive in the docstring and documented in doc/users/next_whats_new/
    • [ ] API changes are marked with a .. versionchanged:: directive in the docstring and documented in doc/api/next_api_changes/
    • [ ] Release notes conform with instructions in next_whats_new/README.rst or next_api_changes/README.rst
    topic: contour 
    opened by anntzer 1
  • [Bug]: Suptitle not visible with subfigures

    [Bug]: Suptitle not visible with subfigures

    Bug summary

    In a fairly basic example using subfigures, a suptitle added to the parent figure is not visible:

    Code for reproduction

    f = plt.figure(figsize=(4, 3))
    sf1, sf2 = f.subfigures(1, 2)
    sf1.subplots()
    sf2.subplots()
    f.suptitle("It's a bird, it's a plane, it's a suptitle")
    

    Actual outcome

    test

    Expected outcome

    Visible suptitle.

    Additional information

    It looks like this is happening because the subfigures have a solid facecolor that obscure the suptitle:

    f = plt.figure(figsize=(4, 3))
    sf1, sf2 = f.subfigures(1, 2)
    sf1.subplots()
    sf2.subplots()
    sf1.set_facecolor((.8, 0, 0, .3))
    f.suptitle("It's a bird, it's a plane, it's a suptitle")
    

    test

    Setting the zorder of the suptitle to a large number has no apparent effect.

    Matplotlib Version

    3.6.2

    Matplotlib Backend

    module://matplotlib_inline.backend_inline

    opened by mwaskom 2
  • [ENH]: add one or more isoluminant colormap(s)

    [ENH]: add one or more isoluminant colormap(s)

    Problem

    Is it possible to add one or more isoluminant colormap(s) to the colormaps already present in Matplotlib?

    Of course, I could install colorcet and use its isoluminant colormaps, but Matplotlib has colormaps of many sorts, aimed at all the different types of usage, except isoluminant colormaps.

    Thank you for everything you've done ፨ gb

    Proposed solution

    No response

    New feature 
    opened by boffi 0
  • [Bug]: coredump when combingin xkcd, FigureCanvasTkAgg and FuncAnimation

    [Bug]: coredump when combingin xkcd, FigureCanvasTkAgg and FuncAnimation

    Bug summary

    When setting up a simple animation on a TkAgg canvas, everything works as expected, until the XKCD-style is applied.

    Code for reproduction

    import tkinter as tk                                                                
    from datetime import date, datetime                                                 
    from tkinter import ttk                                                             
                                                                                          
    import matplotlib.animation as pltanim                                              
    import matplotlib.pyplot as plt                                                     
    from matplotlib.axes import Axes                                                    
    from matplotlib.backends.backend_tkagg import FigureCanvasTkAgg                     
                                                                                          
                                                                                          
    class DayPlotFrame(ttk.Frame):                                                      
        """TK Frame with matplotlib animation for live display of day progress."""   
                                                                                          
        def __init__(self, master=None):                                                
            """Initialize a new DayPlot."""                                             
            super().__init__(master=master)                                             
                                                                                        
            plt.xkcd()  # <- comment out this line and everything starts working again                                                                
            fig = plt.Figure()                                                          
            self.axes: Axes = fig.add_subplot()                                         
                                                                                        
            canvas = FigureCanvasTkAgg(fig, master=self)                                
            canvas.get_tk_widget().pack(fill=tk.BOTH, expand=True)                      
            self.animation = pltanim.FuncAnimation(                                     
                fig,                                                                    
                func=self.__run_animation,                                              
                init_func=self.__init_animation,                                        
            )               
            self.pack()                                                    
                                                                                           
        def __init_animation(self):                                                     
            """Configure the plot."""                                                   
            today = date.today()                                                        
                                                                                        
            self.axes.clear()                                                           
            self.axes.set_xlim(                                                         
                datetime(today.year, today.month, today.day, 8, 45, 0),                 
                datetime(today.year, today.month, today.day, 15, 11, 00),               
            )                                                                           
                                                                                          
        def __run_animation(self, frame):                                               
            """Update the plot according to the time of day."""                         
            width = datetime.now().replace(hour=10, minute=frame % 60)                  
            self.axes.barh(y=[1], width=width, color="blue")
    
    ROOT = tk.Tk()
    APP = DayPlotFrame(master=ROOT)
    APP.mainloop()
    

    Actual outcome

    coredump

    Expected outcome

    the animation, but in XKCD style

    Additional information

    the init_func works just fine, the crash happens at the barh statement

    Operating system

    Arch

    Matplotlib Version

    3.6.2

    Matplotlib Backend

    TkAgg

    Python version

    Python 3.9.2

    Jupyter version

    No response

    Installation

    pip

    opened by bbbart 0
  • DOC/BUILD add ability for conf to skip whole sections

    DOC/BUILD add ability for conf to skip whole sections

    PR Summary

    The doc build is painfully slow. This gives devs an easy way to populate exclude_patterns in conf.py with subdirectories they do not want while they are doing development, and to not do the gallery builds if those subdirectories are excluded.

    Of course the resulting build is broken with dropped references etc, so the developer should put conf.py back to its pristine state, but this should be a handy tool.

    Note to build just the user subdirectory using this takes 5s on my machine (if I exclude the prev_whats_new).

    This could probably use documentation if this is what we want to do, but I can add that if folks think it's reasonable.

    Closes https://github.com/matplotlib/matplotlib/issues/24906

    However note that it's not quite as laser focused as what pandas does (which is build a single page). We could add that, however, this seems like a super simple start.

    PR Checklist

    Documentation and Tests

    • [ ] Has pytest style unit tests (and pytest passes)
    • [ ] Documentation is sphinx and numpydoc compliant (the docs should build without error).
    • [ ] New plotting related features are documented with examples.

    Release Notes

    • [ ] New features are marked with a .. versionadded:: directive in the docstring and documented in doc/users/next_whats_new/
    • [ ] API changes are marked with a .. versionchanged:: directive in the docstring and documented in doc/api/next_api_changes/
    • [ ] Release notes conform with instructions in next_whats_new/README.rst or next_api_changes/README.rst
    Documentation: build 
    opened by jklymak 12
  • [DOC/BUILD] add ability to selectively build docs

    [DOC/BUILD] add ability to selectively build docs

    Looks like pandas’ approach is to loop through the docs and exclude everything except the one you ask for. This is in the conf.py and the make.py sets the relevant environment variable. So probably could be done with our existing make files - though a python make script might remove the need for separate Windows and Linux make files?

    Originally posted by @rcomer in https://github.com/matplotlib/matplotlib/issues/24897#issuecomment-1374527515

    Thanks @rcomer - something like that seems like it would be really helpful for us. I may play with it, but if anyone else w/ more sphinx experience wants to give it a shot, I think it'd be a pretty worthwhile project.

    Documentation: build 
    opened by jklymak 2
Releases(v3.6.2)
  • v3.6.2(Nov 3, 2022)

    This is the second bugfix release of the 3.6.x series.

    This release contains several bug-fixes and adjustments:

    • Avoid mutating dictionaries passed to subplots
    • Fix bbox_inches='tight' on a figure with constrained layout enabled
    • Fix auto-scaling of ax.hist density with histtype='step'
    • Fix compatibility with PySide6 6.4
    • Fix evaluating colormaps on non-NumPy arrays
    • Fix key reporting in pick events
    • Fix thread check on PyPy 3.8
    • Handle input to ax.bar that is all NaN
    • Make rubber band more visible on Tk and Wx backends
    • Restore (and warn on) seaborn styles in style.library
    • Restore get_renderer function in deprecated tight_layout
    • nb/webagg: Fix resize handle on WebKit browsers (e.g., Safari)
    Source code(tar.gz)
    Source code(zip)
  • v3.6.1(Oct 8, 2022)

    This is the first bugfix release of the 3.6.x series.

    This release contains several bug-fixes and adjustments:

    • A warning is no longer raised when constrained layout explicitly disabled and tight layout is applied
    • Add missing get_cmap method to ColormapRegistry
    • Adding a colorbar on a ScalarMappable that is not attached to an Axes is now deprecated instead of raising a hard error
    • Fix barplot being empty when first element is NaN
    • Fix FigureManager.resize on GTK4
    • Fix fill_between compatibility with NumPy 1.24 development version
    • Fix hexbin with empty arrays and log scaling
    • Fix resize_event deprecation warnings when creating figure on macOS
    • Fix build in mingw
    • Fix compatibility with PyCharm's interagg backend
    • Fix crash on empty Text in PostScript backend
    • Fix generic font families in SVG exports
    • Fix horizontal colorbars with hatches
    • Fix misplaced mathtext using eqnarray
    • stackplot no longer changes the Axes cycler
    Source code(tar.gz)
    Source code(zip)
  • v3.6.0(Sep 16, 2022)

    Highlights of this release include:

    • Figure and Axes creation / management
      • subplots, subplot_mosaic accept height_ratios and width_ratios arguments
      • Constrained layout is no longer considered experimental
      • New layout_engine module
      • Compressed layout added for fixed-aspect ratio Axes
      • Layout engines may now be removed
      • Axes.inset_axes flexibility
      • WebP is now a supported output format
      • Garbage collection is no longer run on figure close
    • Plotting methods
      • Striped lines (experimental)
      • Custom cap widths in box and whisker plots in bxp and boxplot
      • Easier labelling of bars in bar plot
      • New style format string for colorbar ticks
      • Linestyles for negative contours may be set individually
      • Improved quad contour calculations via ContourPy
      • errorbar supports markerfacecoloralt
      • streamplot can disable streamline breaks
      • New axis scale asinh (experimental)
      • stairs(..., fill=True) hides patch edge by setting linewidth
      • Fix the dash offset of the Patch class
      • Rectangle patch rotation point
    • Colors and colormaps
      • Color sequence registry
      • Colormap method for creating a different lookup table size
      • Setting norms with strings
    • Titles, ticks, and labels
      • plt.xticks and plt.yticks support minor keyword argument
    • Legends
      • Legend can control alignment of title and handles
      • ncol keyword argument to legend renamed to ncols
    • Markers
      • marker can now be set to the string "none"
      • Customization of MarkerStyle join and cap style
    • Fonts and Text
      • Font fallback
      • List of available font names
      • math_to_image now has a color keyword argument
      • Active URL area rotates with link text
    • rcParams improvements
      • Allow setting figure label size and weight globally and separately from title
      • Mathtext parsing can be disabled globally
      • Double-quoted strings in matplotlibrc
    • 3D Axes improvements
      • Standardized views for primary plane viewing angles
      • Custom focal length for 3D camera
      • 3D plots gained a 3rd "roll" viewing angle
      • Equal aspect ratio for 3D plots
    • Interactive tool improvements
      • Rotation, aspect ratio correction and add/remove state
      • MultiCursor now supports Axes split over multiple figures
      • PolygonSelector bounding boxes
      • Setting PolygonSelector vertices
      • SpanSelector widget can now be snapped to specified values
      • More toolbar icons are styled for dark themes
    • Platform-specific changes
      • Wx backend uses standard toolbar
      • Improvements to macosx backend
        • Modifier keys handled more consistently
        • savefig.directory rcParam support
        • figure.raise_window rcParam support
        • Full-screen toggle support
        • Improved animation and blitting support
      • macOS application icon applied on Qt backend
      • New minimum macOS version
      • Windows on ARM support
    Source code(tar.gz)
    Source code(zip)
  • v3.6.0rc2(Aug 29, 2022)

  • v3.6.0rc1(Aug 29, 2022)

  • v3.5.3(Aug 11, 2022)

    This is the third bugfix release of the 3.5.x series.

    This release contains several bug-fixes and adjustments:

    • Fix alignment of over/under symbols
    • Fix bugs in colorbars:
      • alpha of extensions
      • drawedges=True with extensions
      • handling of panchor=False
    • Fix builds on Cygwin and IBM i
    • Fix contour labels in SubFigures
    • Fix cursor output:
      • for imshow with all negative values
      • when using BoundaryNorm
    • Fix interactivity in IPython/Jupyter
    • Fix NaN handling in errorbar
    • Fix NumPy conversion from AstroPy unit arrays
    • Fix positional markerfmt passed to stem
    • Fix unpickling:
      • crash loading in a separate process
      • incorrect DPI when HiDPI screens
    Source code(tar.gz)
    Source code(zip)
  • v3.5.2(May 3, 2022)

    This is the second bugfix release of the 3.5.x series.

    This release contains several bug-fixes and adjustments:

    • Add support for Windows on ARM (source-only; no wheels provided yet)
    • Add year to concise date formatter when displaying less than 12 months
    • Disable QuadMesh mouse cursor to avoid severe performance regression in pcolormesh
    • Delay backend selection to allow choosing one in more cases
    • Fix automatic layout bugs in EPS output
    • Fix autoscaling of scatter plots
    • Fix clearing of subfigures
    • Fix colorbar exponents, inversion of extensions, and use on inset axes
    • Fix compatibility with various NumPy-like classes (e.g., Pandas, xarray, etc.)
    • Fix constrained layout bugs with mixed subgrids
    • Fix errorbar with dashes
    • Fix errors in conversion to GTK4 and Qt6
    • Fix figure options accidentally re-ordering data
    • Fix keyboard focus of TkAgg backend
    • Fix manual selection of contour labels
    • Fix path effects on text with whitespace
    • Fix quiver in subfigures
    • Fix RangeSlider.set_val displaying incorrectly
    • Fix regressions in collection data limits
    • Fix stairs with no edgecolor
    • Fix some leaks in Tk backends
    • Fix tight layout DPI confusion
    • Fix tool button customizability and some tool manager bugs
    • Only set Tk HiDPI scaling-on-map for Windows systems
    • Partially allow TTC font collection files by selecting the first font
    Source code(tar.gz)
    Source code(zip)
  • v3.5.1(Dec 11, 2021)

    This is the first bugfix release of the 3.5.x series.

    This release contains several critical bug-fixes:

    • fix installation issues when setting a default backend
    • fix add_lines on horizontal colorbars
    • fix streamplot with start points on right or top edge
    • fix colorbars with boundaries or NoNorm
    • fix colorbars with negative contours
    • fix colorbars with tight layout
    • fix setting Axis label alignment to center
    • fix subfigure tight bounding box
    • fix subplot parameter window on macosx backend
    • fix unit handling in Collections.set_offsets
    • fix unyt integration in errorbar
    • re-display date offset in ConciseDataFormatter after zoom
    • reduce do_3d_projection deprecation warnings in external artists
    Source code(tar.gz)
    Source code(zip)
  • v3.5.0(Nov 16, 2021)

    Highlights of this release include:

    • Figure and Axes creation / management
      • subplot_mosaic supports simple Axes sharing
      • Figure now has draw_without_rendering method
      • Figure __init__ passes keyword arguments through to set
    • Plotting methods
      • Add Annulus patch
      • set_data method for FancyArrow patch
      • New arrow styles in ArrowStyle and ConnectionPatch
      • Setting collection offset transform after initialization
    • Colors and colormaps
      • Colormap registry (experimental)
      • Image interpolation now possible at RGBA stage
      • imshow supports half-float arrays
      • A callback registry has been added to Normalize objects
    • Titles, ticks, and labels
      • Settings tick positions and labels simultaneously in set_ticks
    • Fonts and Text
      • Triple and quadruple dot mathtext accents
      • Font properties of legend title are configurable
      • Text and TextBox parse_math option
      • Text can be positioned inside TextBox widget
      • Simplified font setting for usetex mode
      • Type 42 subsetting is now enabled for PDF/PS backends
    • rcParams improvements
      • Allow setting default legend labelcolor globally
    • 3D Axes improvements
      • Axes3D now allows manual control of draw order
      • Allow changing the vertical axis in 3D plots
      • plot_surface supports masked arrays and NaNs
      • 3D plotting methods support data keyword argument
    • Interactive tool improvements
      • Colorbars now have pan and zoom functionality
      • Updated appearance of Slider widgets
      • Selector additions of clearing, dragging, and removal
      • CallbackRegistry objects gain a method to temporarily block signals
      • Directional sizing cursors
    • Sphinx extensions
      • More configuration of mathmpl sphinx extension
    • Backend-specific improvements
      • New GTK4 backend
      • New Qt6 backend
      • HiDPI support in Cairo-based, GTK, and Tk backends
      • Qt figure options editor improvements
      • WX backends support mouse navigation buttons
      • WebAgg uses asyncio instead of Tornado
    Source code(tar.gz)
    Source code(zip)
  • v3.5.0rc1(Oct 2, 2021)

  • v3.5.0b1(Aug 24, 2021)

  • v3.4.3(Aug 13, 2021)

    This is the third bugfix release of the 3.4.x series.

    This release contains several critical bug-fixes:

    • Clarify deprecation of Axes.figbox
    • Disable MultiCursor widget on Axes subplots which it is not tracking
    • Don't simplify path in LineCollection.get_segments
    • Fix DPI in subfigures, affecting tick spacing, and scatter marker size
    • Fix broken EPS output when using Type 42 STIX fonts
    • Fix change in tick behaviour when calling Axes.clear
    • Fix class docstrings for Norms created from Scales
    • Fix compatibility with NumPy 1.21.0
    • Fix crash on broken TrueType fonts
    • Fix incorrect hits from Path.intersects_path
    • Fix leak if affine_transform is passed invalid vertices
    • Fix legends of stackplot with edgecolors='face'
    • Fix plot directive when building in parallel
    • Fix supxlabel and supylabel behaviour in constrained layout
    • Fix tests with latest Inkscape and Ghostscript
    • Improve DateFormatter styling for month names when usetex=True
    • Re-disable autoscaling after interactive zoom
    • Work around bug in Pillow 8.3.0
    Source code(tar.gz)
    Source code(zip)
  • v3.4.2(May 8, 2021)

    This is the second bugfix release of the 3.4.x series.

    This release contains several critical bug-fixes:

    • Generate wheels usable on older PyPy7.3.{0,1}
    • Fix compatibility with Python 3.10
    • Add subplot_mosaic Axes in the order the user gave them to us
    • Correctly handle 'none' facecolors in do_3d_projection
    • Ensure that Matplotlib is importable even if there's no HOME
    • Fix CenteredNorm with halfrange
    • Fix bar_label for bars with NaN values
    • Fix clip paths when zoomed such that they are outside the figure
    • Fix creation of RangeSlider with valinit
    • Fix handling of "d" glyph in backend_ps, fixing EPS output
    • Fix handling of datetime coordinates in pcolormesh with Pandas
    • Fix processing of some errorbar arguments
    • Fix removal of shared polar Axes
    • Fix resetting grid visibility
    • Fix subfigure indexing error and tight bbox
    • Fix textbox cursor color
    • Fix TkAgg event loop error on window close
    • Ignore errors for sip with no setapi (Qt4Agg import errors)
    Source code(tar.gz)
    Source code(zip)
  • v3.4.1(Mar 31, 2021)

    This is the first bugfix release of the 3.4.x series.

    This release contains several critical bug-fixes:

    • fix errorbar when specifying fillstyle
    • fix Inkscape cleanup at exit on Windows for tests
    • fix legends of colour-mapped scatter plots
    • fix positioning of annotation fancy arrows
    • fix size and color rendering for 3D scatter plots
    • fix suptitle manual positioning when using constrained layout
    • respect antialiasing settings in cairo backends as well
    Source code(tar.gz)
    Source code(zip)
  • v3.4.0(Mar 26, 2021)

    Highlights of this release include:

    • Figure and Axes creation / management
      • New subfigure functionality
      • Single-line string notation for subplot_mosaic
      • Changes to behavior of Axes creation methods (gca, add_axes, add_subplot)
      • add_subplot/add_axes gained an axes_class parameter
      • Subplot and subplot2grid can now work with constrained layout
    • Plotting methods
      • axline supports transform parameter
      • New automatic labeling for bar charts
      • A list of hatches can be specified to bar and barh
      • Setting BarContainer orientation
      • Contour plots now default to using ScalarFormatter
      • Axes.errorbar cycles non-color properties correctly
      • errorbar errorevery parameter matches markevery
      • hexbin supports data reference for C parameter
      • Support callable for formatting of Sankey labels
      • Axes.spines access shortcuts
      • New stairs method and StepPatch artist
      • Added orientation parameter for stem plots
      • Angles on Bracket arrow styles
      • TickedStroke patheffect
    • Colors and colormaps
      • Collection color specification and mapping
      • Transparency (alpha) can be set as an array in collections
      • pcolormesh has improved transparency handling by enabling snapping
      • IPython representations for Colormap objects
      • Colormap.set_extremes and Colormap.with_extremes
      • Get under/over/bad colors of Colormap objects
      • New cm.unregister_cmap function
      • New CenteredNorm for symmetrical data around a center
      • New FuncNorm for arbitrary normalizations
      • GridSpec-based colorbars can now be positioned above or to the left of the main axes
    • Titles, ticks, and labels
      • supxlabel and supylabel
      • Shared-axes subplots tick label visibility is now correct for top or left labels
      • An iterable object with labels can be passed to Axes.plot
    • Fonts and Text
      • Text transform can rotate text direction
      • matplotlib.mathtext now supports overset and underset LaTeX symbols
      • math_fontfamily parameter to change Text font family
      • TextArea/AnchoredText support horizontalalignment
      • PDF supports URLs on Text artists
    • rcParams improvements
      • New rcParams for dates: set converter and whether to use interval_multiples
      • Date formatters now respect usetex rcParam
      • Setting image.cmap to a Colormap
      • Tick and tick label colors can be set independently using rcParams
    • 3D Axes improvements
      • Errorbar method in 3D Axes
      • Stem plots in 3D Axes
      • 3D Collection properties are now modifiable
      • Panning in 3D Axes
    • Interactive tool improvements
      • New RangeSlider widget
      • Sliders can now snap to arbitrary values
      • Pausing and Resuming Animations
    • Sphinx extensions
      • plot_directive caption option
    • Backend-specific improvements
      • Consecutive rasterized draws now merged
      • Support raw/rgba frame format in FFMpegFileWriter
      • nbAgg/WebAgg support middle-click and double-click
      • nbAgg support binary communication
      • Indexed color for PNG images in PDF files when possible
      • Improved font subsettings in PDF/PS
      • Kerning added to strings in PDFs
      • Fully-fractional HiDPI in QtAgg
      • wxAgg supports fullscreen toggle
    Source code(tar.gz)
    Source code(zip)
  • v3.4.0rc3(Mar 11, 2021)

  • v3.4.0rc2(Mar 11, 2021)

  • v3.4.0rc1(Feb 19, 2021)

  • v3.3.4(Jan 28, 2021)

    This is the fourth bugfix release of the 3.3.x series.

    This release contains several critical bug-fixes:

    • Fix WebAgg initialization.
    • Fix parsing QT_API setting with mixed case.
    • Fix build with link-time optimization disabled in environment.
    • Fix test compatibility with NumPy 1.20.
    • Fix test compatibility with pytest 6.2.
    Source code(tar.gz)
    Source code(zip)
  • v3.3.3(Nov 12, 2020)

    This is the third bugfix release of the 3.3.x series.

    This release contains several critical bug-fixes:

    • Fix calls to Axis.grid with argument visible=True.
    • Fix fully masked imshow.
    • Fix inconsistent color mapping in scatter for 3D plots.
    • Fix notebook/nbAgg figures when used with ipywidgets in the same cell.
    • Fix notebook/nbAgg/WebAgg on older (e.g., Firefox ESR) browsers.
    • Fix pcolormesh with datetime coordinates.
    • Fix performance regression with datetimes.
    • Fix singular ticks with small log ranges.
    • Fix timers/animations on wx and notebook backends.
    • Remove certifi as a hard runtime dependency.
    Source code(tar.gz)
    Source code(zip)
  • v3.3.2(Sep 15, 2020)

    This is the second bugfix release of the 3.3.x series.

    This release contains several critical bug-fixes:

    • fix Axis scale on twinned Axes
    • fix auto-close of Figures in nbagg
    • fix automatic title placement if Axes is off the Figure
    • fix autoranging of log scales with barstacked histogram
    • fix extra redraws when using Button or TextBox widgets
    • fix imshow with LogNorm and large vmin/vmax ranges
    • fix plotting Pandas DataFrame with string MultiIndex
    • fix scatter with marker=''
    • fix scatter3d color/linewidth re-projection
    • fix state of mode buttons in TkAgg backends
    • include license files in built distribution
    • reduce Visual C++ runtime requirements on Windows
    Source code(tar.gz)
    Source code(zip)
  • v3.3.1(Aug 14, 2020)

    This is the first bugfix release of the 3.3.x series.

    This release contains several critical bug-fixes:

    • fix docstring import issues when running Python with optimization
    • fix hist with categorical data, such as with Pandas
    • fix install on BSD systems
    • fix nbagg compatibility with Chrome 84+
    • fix ordering of scatter marker size in 3D plots
    • fix performance regression when plotting Paths
    • fix reading from URL in imread
    • fix several regressions with new date epoch handling
    • fix some bad constrained and tight layout interactions with colorbars
    • fix use of customized toolbars in TkAgg and WXAgg backends
    Source code(tar.gz)
    Source code(zip)
  • v3.3.0(Jul 16, 2020)

    Highlights of this release include:

    • Provisional API for composing semantic axes layouts from text or nested lists
    • New Axes.sharex, Axes.sharey methods
    • Turbo colormap
    • colors.BoundaryNorm supports extend keyword argument
    • Text color for legend labels
    • Pcolor and Pcolormesh now accept shading='nearest' and 'auto'
    • Allow tick formatters to be set with str or function inputs
    • New Axes.axline method
    • Dates use a modern epoch
    • Improved font weight detection
    • Axes3D no longer distorts the 3D plot to match the 2D aspect ratio
    • More consistent toolbar behavior across backends
    • Toolbar icons are now styled for dark themes
    • Cursor text now uses a number of significant digits matching pointing precision
    • Functions to compute a Path's size
    • savefig() gained a backend keyword argument
    • Saving SVG now supports adding metadata
    • Saving PDF metadata via PGF now consistent with PDF backend
    • NbAgg and WebAgg no longer use jQuery & jQuery UI

    For the full details please see the What's New and API changes in the documentation.

    Source code(tar.gz)
    Source code(zip)
  • v3.2.2(Jun 17, 2020)

    This is the second bugfix release of the 3.2.x series.

    This release contains several critical bug-fixes:

    • support fractional HiDPI scaling with Qt backends
    • support new Python and fix syntax errors in legacy Python
    • support new Qt 5 and fix support for Qt 4
    • fix animation writer fallback
    • fix figure resizing
    • fix handling of large arcs
    • fix issues with tight layout
    • fix saving figures after closing windows or under certain size conditions
    • fix scatter when specifying a single color
    • fix several memory leaks
    • fix unexpected autoscaling behavior
    • fix various issues with usetex
    • various minor bug and documentation fixes
    Source code(tar.gz)
    Source code(zip)
  • v3.2.1(Mar 18, 2020)

    This is the first bugfix release of the 3.2.x series.

    This release contains several critical bug-fixes:

    • fix Quiver.set_UVC calls with scalar inputs
    • fix bezier.get_parallels failure from floating point rounding errors
    • fix markers specified as tuples (polygons, stars, or asterisks)
    • fix saving PNGs to file objects in some places
    • fix saving figures using the nbAgg/notebook backend
    • fix saving with tight layout using the PGF backend
    • fix setting custom datapath in rcParams (note: it is still deprecated)
    • fix various issues running setup.py in non-CI environments
    • fix xpdf distiller
    • various minor bug and documentation fixes
    Source code(tar.gz)
    Source code(zip)
  • v3.2.0rc3(Feb 2, 2020)

Owner
Matplotlib Developers
:small_red_triangle: Ternary plotting library for python with matplotlib

python-ternary This is a plotting library for use with matplotlib to make ternary plots plots in the two dimensional simplex projected onto a two dime

Marc 611 Dec 29, 2022
matplotlib: plotting with Python

Matplotlib is a comprehensive library for creating static, animated, and interactive visualizations in Python. Check out our home page for more inform

Matplotlib Developers 13.1k Feb 18, 2021
:small_red_triangle: Ternary plotting library for python with matplotlib

python-ternary This is a plotting library for use with matplotlib to make ternary plots plots in the two dimensional simplex projected onto a two dime

Marc 391 Feb 17, 2021
A Python library for plotting hockey rinks with Matplotlib.

Hockey Rink A Python library for plotting hockey rinks with Matplotlib. Installation pip install hockey_rink Current Rinks The following shows the cus

null 24 Jan 2, 2023
MPL Plotter is a Matplotlib based Python plotting library built with the goal of delivering publication-quality plots concisely.

MPL Plotter is a Matplotlib based Python plotting library built with the goal of delivering publication-quality plots concisely.

Antonio López Rivera 162 Nov 11, 2022
Simple plotting for Python. Python wrapper for D3xter - render charts in the browser with simple Python syntax.

PyDexter Simple plotting for Python. Python wrapper for D3xter - render charts in the browser with simple Python syntax. Setup $ pip install PyDexter

D3xter 31 Mar 6, 2021
🎨 Python Echarts Plotting Library

pyecharts Python ❤️ ECharts = pyecharts English README ?? 简介 Apache ECharts (incubating) 是一个由百度开源的数据可视化,凭借着良好的交互性,精巧的图表设计,得到了众多开发者的认可。而 Python 是一门富有表达

pyecharts 13.1k Jan 3, 2023
🎨 Python Echarts Plotting Library

pyecharts Python ❤️ ECharts = pyecharts English README ?? 简介 Apache ECharts (incubating) 是一个由百度开源的数据可视化,凭借着良好的交互性,精巧的图表设计,得到了众多开发者的认可。而 Python 是一门富有表达

pyecharts 10.6k Feb 18, 2021
termplotlib is a Python library for all your terminal plotting needs.

termplotlib termplotlib is a Python library for all your terminal plotting needs. It aims to work like matplotlib. Line plots For line plots, termplot

Nico Schlömer 553 Dec 30, 2022
Python scripts for plotting audiograms and related data from Interacoustics Equinox audiometer and Otoaccess software.

audiometry Python scripts for plotting audiograms and related data from Interacoustics Equinox 2.0 audiometer and Otoaccess software. Maybe similar sc

Hamilton Lab at UT Austin 2 Jun 15, 2022
A simple code for plotting figure, colorbar, and cropping with python

Python Plotting Tools This repository provides a python code to generate figures (e.g., curves and barcharts) that can be used in the paper to show th

Guanying Chen 134 Jan 2, 2023
Plotting library for IPython/Jupyter notebooks

bqplot 2-D plotting library for Project Jupyter Introduction bqplot is a 2-D visualization system for Jupyter, based on the constructs of the Grammar

null 3.4k Dec 29, 2022
An intuitive library to add plotting functionality to scikit-learn objects.

Welcome to Scikit-plot Single line functions for detailed visualizations The quickest and easiest way to go from analysis... ...to this. Scikit-plot i

Reiichiro Nakano 2.3k Dec 31, 2022
🎨 Python3 binding for `@AntV/G2Plot` Plotting Library .

PyG2Plot ?? Python3 binding for @AntV/G2Plot which an interactive and responsive charting library. Based on the grammar of graphics, you can easily ma

hustcc 990 Jan 5, 2023
Plotting library for IPython/Jupyter notebooks

bqplot 2-D plotting library for Project Jupyter Introduction bqplot is a 2-D visualization system for Jupyter, based on the constructs of the Grammar

null 3.4k Dec 30, 2022
3D plotting and mesh analysis through a streamlined interface for the Visualization Toolkit (VTK)

PyVista Deployment Build Status Metrics Citation License Community 3D plotting and mesh analysis through a streamlined interface for the Visualization

PyVista 1.6k Jan 8, 2023
A high-level plotting API for pandas, dask, xarray, and networkx built on HoloViews

hvPlot A high-level plotting API for the PyData ecosystem built on HoloViews. Build Status Coverage Latest dev release Latest release Docs What is it?

HoloViz 697 Jan 6, 2023
Bokeh Plotting Backend for Pandas and GeoPandas

Pandas-Bokeh provides a Bokeh plotting backend for Pandas, GeoPandas and Pyspark DataFrames, similar to the already existing Visualization feature of

Patrik Hlobil 822 Jan 7, 2023
An open-source plotting library for statistical data.

Lets-Plot Lets-Plot is an open-source plotting library for statistical data. It is implemented using the Kotlin programming language. The design of Le

JetBrains 820 Jan 6, 2023