Prisma Cloud CLI
The Prisma Cloud CLI is a command line interface for Prisma Cloud by Palo Alto Networks.
Support
This project has been developed by Prisma Cloud SAs and is not Supported by Palo Alto Networks. Nevertheless, the maintainers will make a best-effort to address issues, and (of course) contributors are encouraged to submit issues and pull requests.
Getting started
Requirements
- Python >= 3.7
- Pip3
Installation
pip3 install prismacloud-cli
Installation on Alpine:
sudo pip3 install --upgrade pip && pip3 install --upgrade setuptools
sudo pip3 install prismacloud-cli
Installation on Ubuntu:
sudo apt update
sudo apt install -y python3-venv python3-pip jq
mkdir python_virtual_environments/
cd python_virtual_enviornments/
python3 -m venv prisma_cli_env
source prisma_cli_env/bin/activate
pip3 install prismacloud-cli
Run the script
Run the pc cli script. If you don't have a config file yet, it will help you to create one.
pc version
This process looks like the screenshot below. the prismacloud-cli asks you for some details, stores it in the credentials file and uses that file when it is already available.
Create your own configuration
Create an access key from Settings then Access key Get the path to console from Compute tab, System, Utilities
Create a file into home directory .prismacloud/credentials.json with the following structure
{
  "api_endpoint": "__REDACTED__",
  "pcc_api_endpoint": "__REDACTED__",
  "access_key_id": "__REDACTED__",
  "secret_key": "__REDACTED__"
}
You can add additional configurations which you can call by using --config. For example, create a file called ~/.prismacloud/demo.json with the contents above.
Add --config demo to your cli commands.
For example:
pc --config demo -o csv policy
Examples
pc -o csv policy
pc -o json policy | jq
pc tags
pc stats dashboard
pc -o json stats dashboard
pc cloud name
pc --columns defendersSummary.host stats dashboard
Global options
The following global options are available
Options:
  -v, --verbose                   Enables verbose mode.
  -vv, --very_verbose             Enables very verbose mode.
  -o, --output [text|csv|json|html|columns]
  -c, --config TEXT               Select configuration
                                  ~/.prismacloud/[CONFIGURATION].json
  --columns TEXT                  Select columns for output
  --help                          Show this message and exit.
Use -o columns to get a list of columns available for --columns, e.g.:
pc -o columns images
pc --columns hostname,repoTag.repo,osDistro -o csv images -l 1
Environment variables
To overwrite the default output settings, use environment variables MAX_WIDTH (console output), MAX_ROWS and MAX_COLUMNS.
Commands
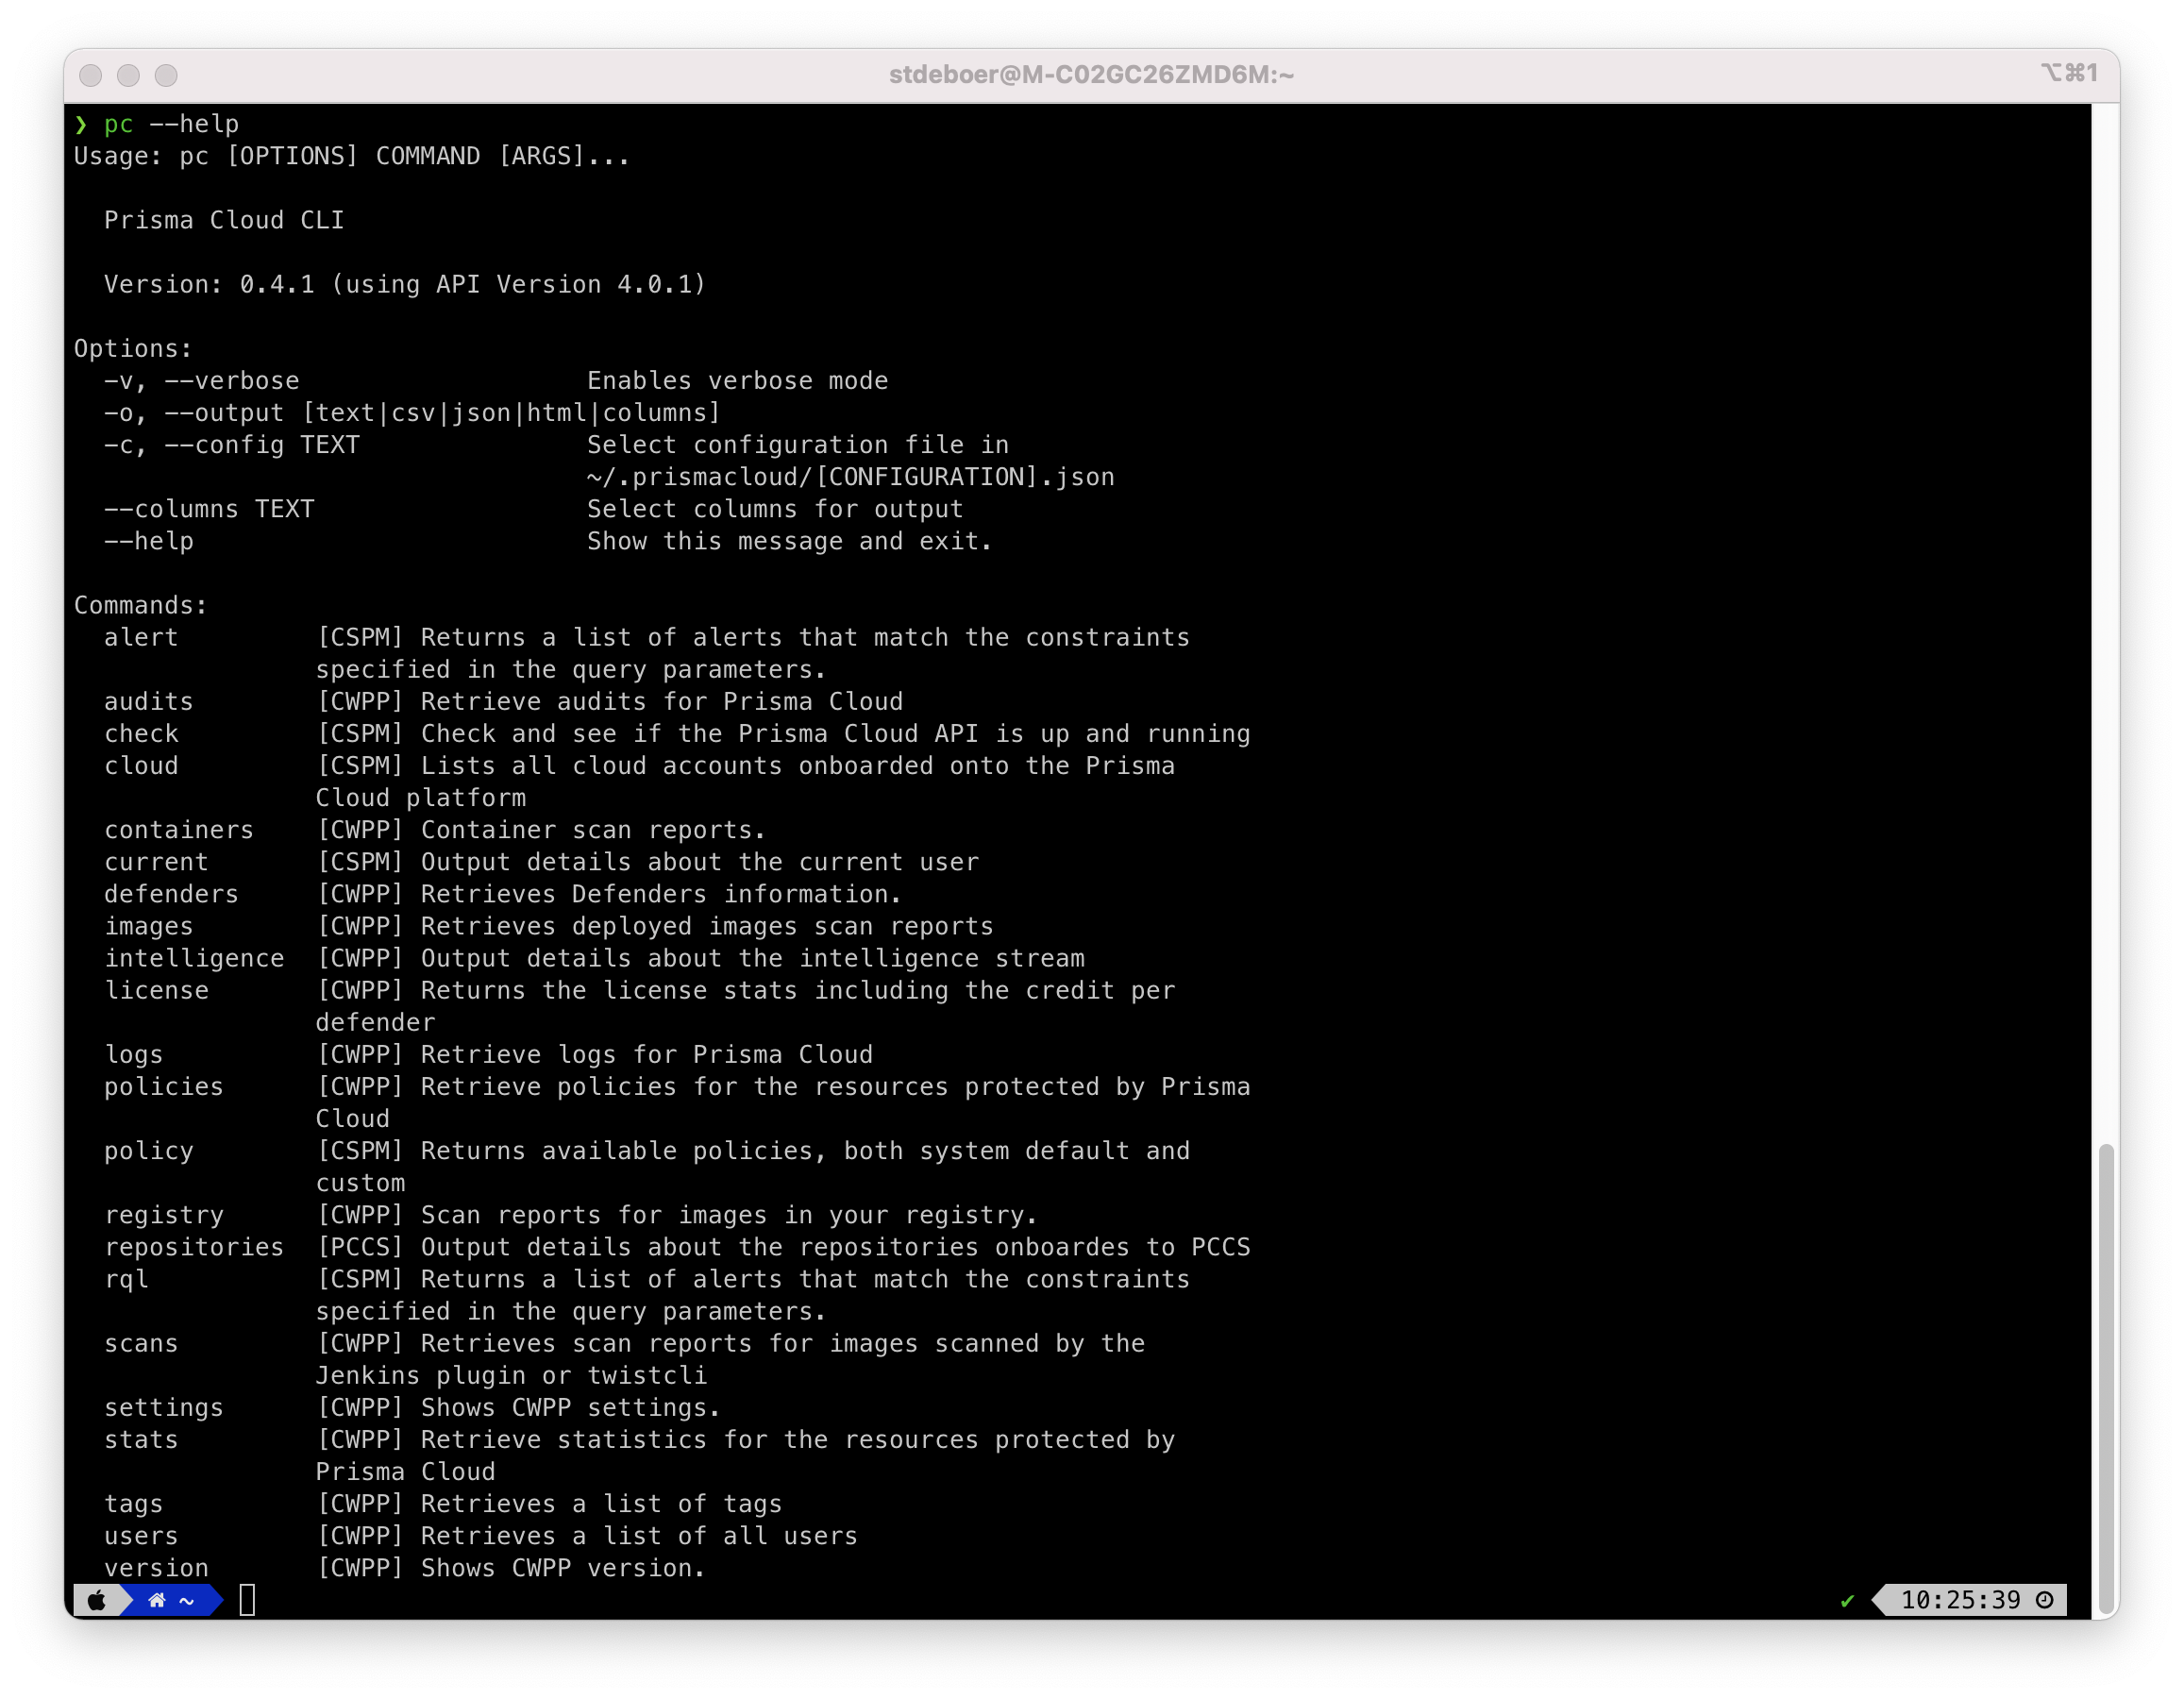
The cli has several commands to work with, see the screenshot below for an example, but use pc --help to see the latest list for your version.
Use cases
Log4J Impacted Resources
pc -o json stats vulnerabilities --cve CVE-2021-44228 | jq
pc stats vulnerabilities --cve CVE-2021-44228
Use something similar for getting the Spring Shell impacted resources.
Search scan reports for images scanned by the Jenkins plugin or twistcli.
pc scans --help
Select only specific columns for the output:
pc --columns entityInfo.repoTag.registry,entityInfo.repoTag.repo,entityInfo.repoTag.tag,entityInfo.vulnerabilitiesCount scans -l 20 -s nginx
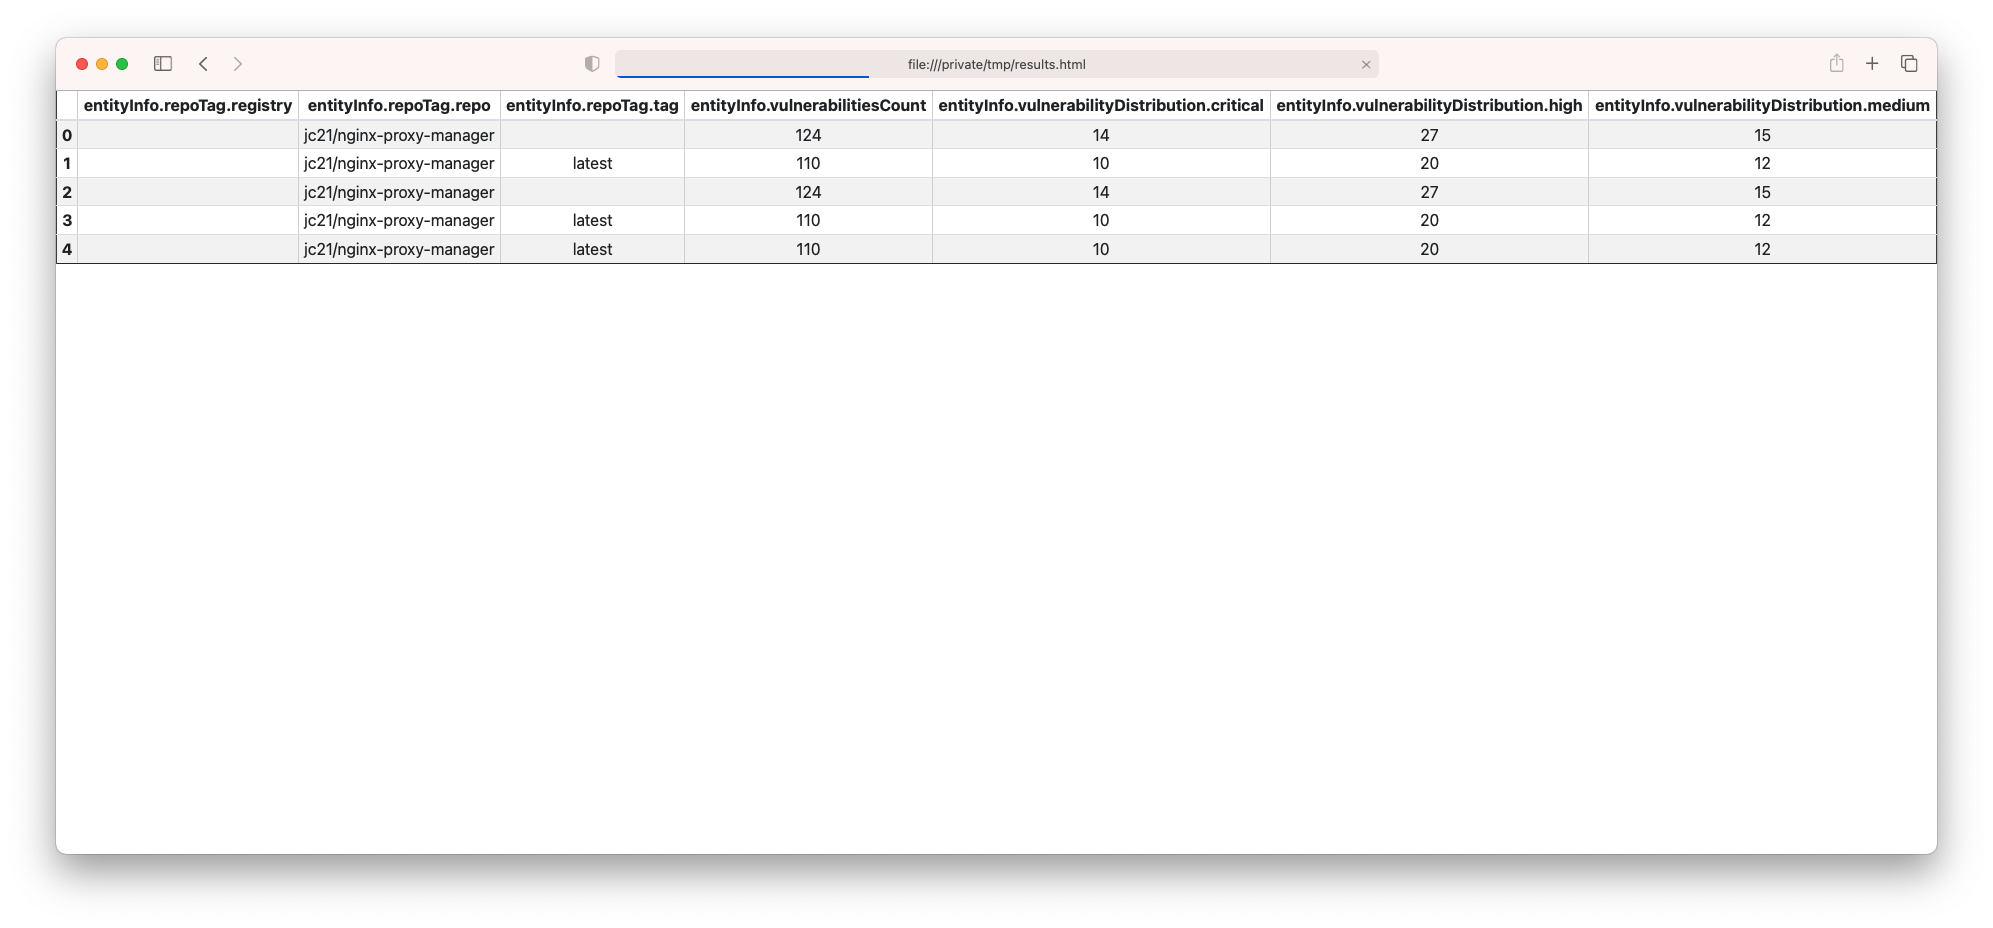
You might also want to add some additional columns and save the output as html:
pc --config local -o html --columns entityInfo.repoTag.registry,entityInfo.repoTag.repo,entityInfo.repoTag.tag,entityInfo.vulnerabilitiesCount,entityInfo.vulnerabilityDistribution.critical,entityInfo.vulnerabilityDistribution.high,entityInfo.vulnerabilityDistribution.medium scans -l 20 -s nginx > /tmp/results.html
Then, open /tmp/results.html:


