Filter By
60 Repositories
Python Debugging Tools
A powerful set of Python debugging tools, based on PySnooper
snoop snoop is a powerful set of Python debugging tools. It's primarily meant to be a more featureful and refined version of PySnooper. It also includ
 874 Jan 8, 2023

Sampling profiler for Python programs
py-spy: Sampling profiler for Python programs py-spy is a sampling profiler for Python programs. It lets you visualize what your Python program is spe
 9.5k Jan 8, 2023

VizTracer is a low-overhead logging/debugging/profiling tool that can trace and visualize your python code execution.
VizTracer is a low-overhead logging/debugging/profiling tool that can trace and visualize your python code execution.
 2.8k Jan 8, 2023
Inject code into running Python processes
pyrasite Tools for injecting arbitrary code into running Python processes. homepage: http://pyrasite.com documentation: http://pyrasite.rtfd.org downl
 2.7k Jan 8, 2023
Integration of IPython pdb
IPython pdb Use ipdb exports functions to access the IPython debugger, which features tab completion, syntax highlighting, better tracebacks, better i
 1.7k Jan 7, 2023
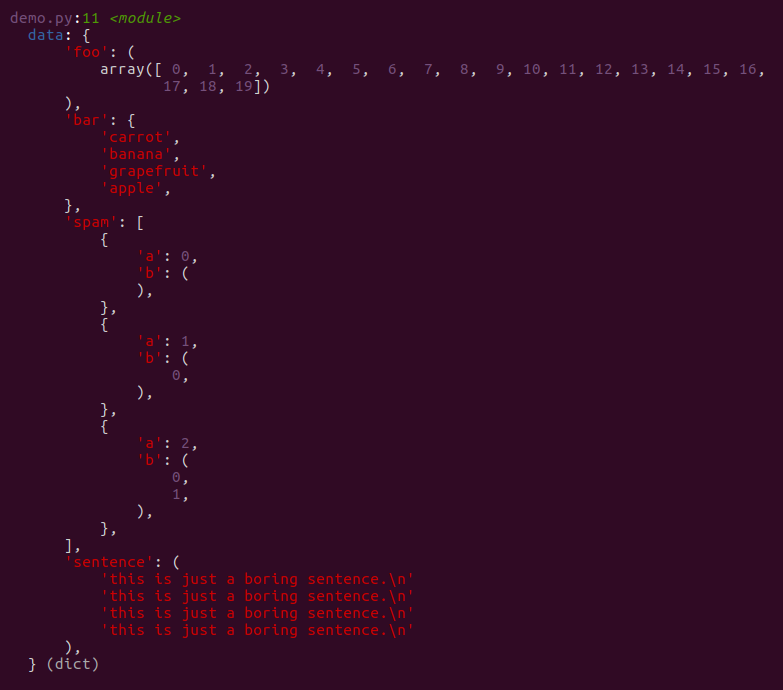
🍦 Never use print() to debug again.
IceCream -- Never use print() to debug again Do you ever use print() or log() to debug your code? Of course you do. IceCream, or ic for short, makes p
 6.5k Jan 7, 2023
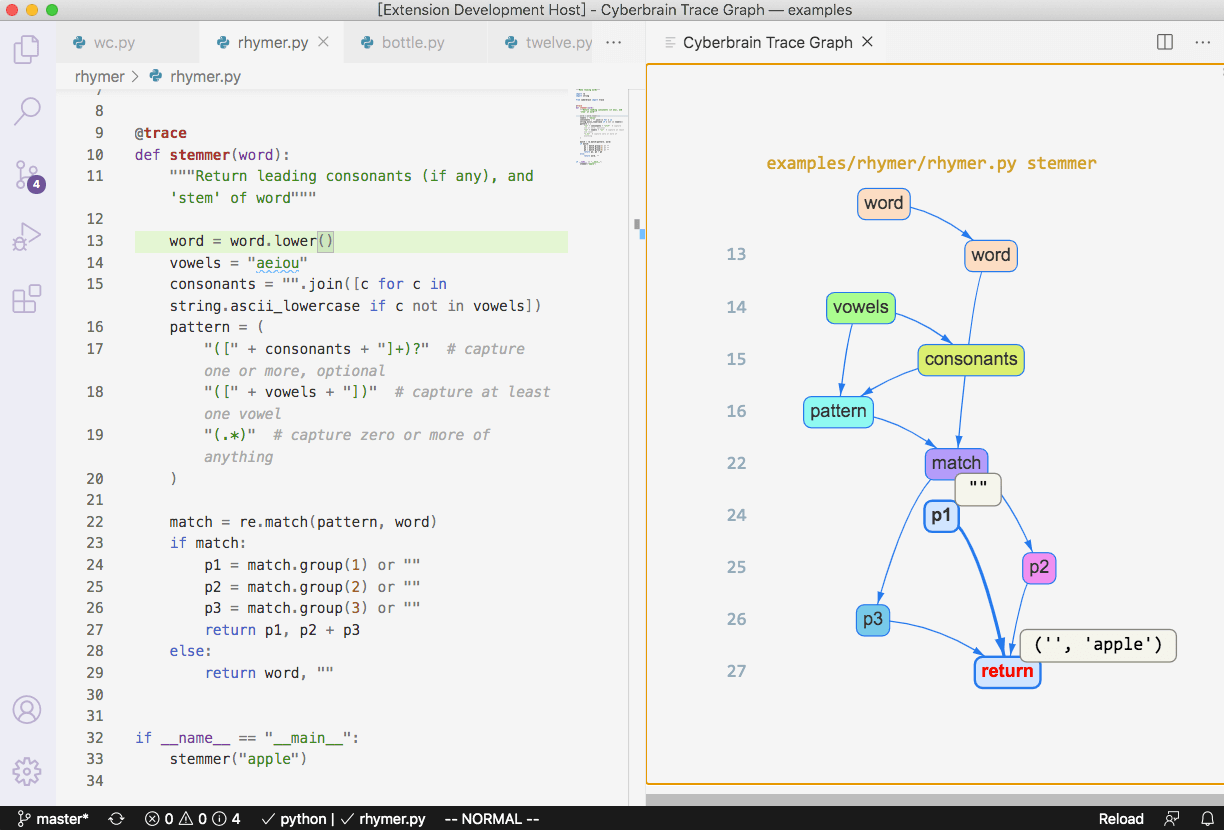
Cyberbrain: Python debugging, redefined.
Cyberbrain1(电子脑) aims to free programmers from debugging.
 2.3k Jan 7, 2023

🔥 Pyflame: A Ptracing Profiler For Python. This project is deprecated and not maintained.
Pyflame: A Ptracing Profiler For Python (This project is deprecated and not maintained.) Pyflame is a high performance profiling tool that generates f
 3k Jan 7, 2023
(OLD REPO) Line-by-line profiling for Python - Current repo -
line_profiler and kernprof line_profiler is a module for doing line-by-line profiling of functions. kernprof is a convenient script for running either
 3.6k Jan 6, 2023
Run-time type checker for Python
This library provides run-time type checking for functions defined with PEP 484 argument (and return) type annotations. Four principal ways to do type
 1.1k Jan 5, 2023
Parsing ELF and DWARF in Python
pyelftools pyelftools is a pure-Python library for parsing and analyzing ELF files and DWARF debugging information. See the User's guide for more deta
 1.6k Jan 4, 2023
Python's missing debug print command and other development tools.
python devtools Python's missing debug print command and other development tools. For more information, see documentation. Install Just pip install de
 637 Jan 2, 2023

pdb++, a drop-in replacement for pdb (the Python debugger)
pdb++, a drop-in replacement for pdb What is it? This module is an extension of the pdb module of the standard library. It is meant to be fully compat
 1k Jan 2, 2023
Visual profiler for Python
vprof vprof is a Python package providing rich and interactive visualizations for various Python program characteristics such as running time and memo
 3.9k Jan 1, 2023
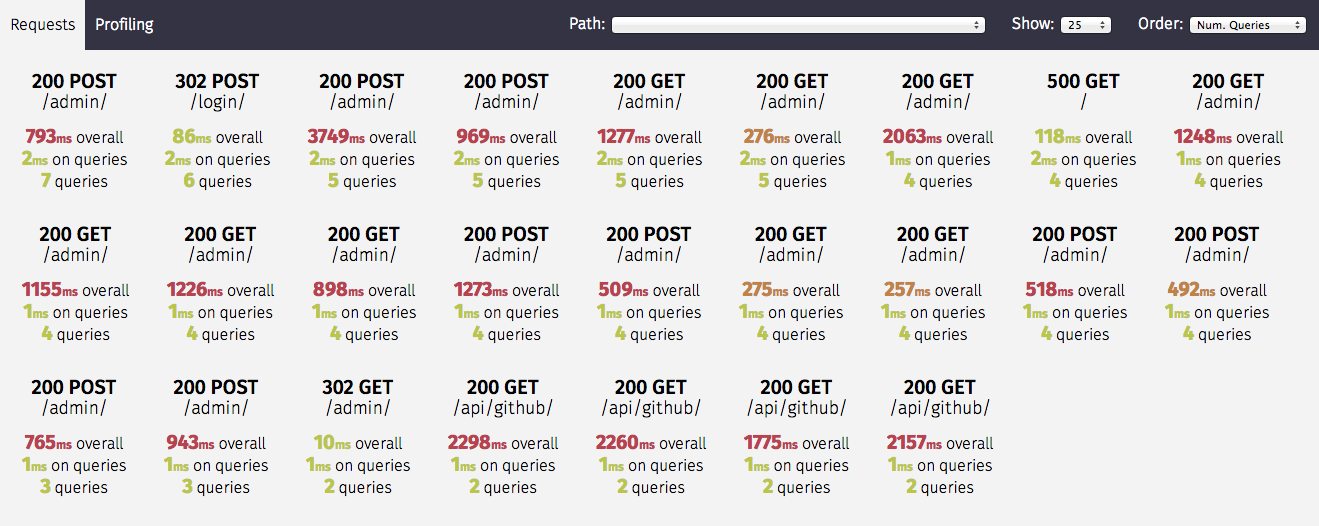
Silky smooth profiling for Django
Silk Silk is a live profiling and inspection tool for the Django framework. Silk intercepts and stores HTTP requests and database queries before prese
 3.7k Jan 1, 2023

Tracing instruction in lldb debugger.Just a python-script for lldb.
lldb-trace Tracing instruction in lldb debugger. just a python-script for lldb. How to use it? Break at an address where you want to begin tracing. Im
 156 Jan 1, 2023
Full-screen console debugger for Python
PuDB: a console-based visual debugger for Python Its goal is to provide all the niceties of modern GUI-based debuggers in a more lightweight and keybo
 2.6k Jan 1, 2023

PINCE is a front-end/reverse engineering tool for the GNU Project Debugger (GDB), focused on games.
PINCE is a front-end/reverse engineering tool for the GNU Project Debugger (GDB), focused on games. However, it can be used for any reverse-engi
 1.5k Jan 1, 2023
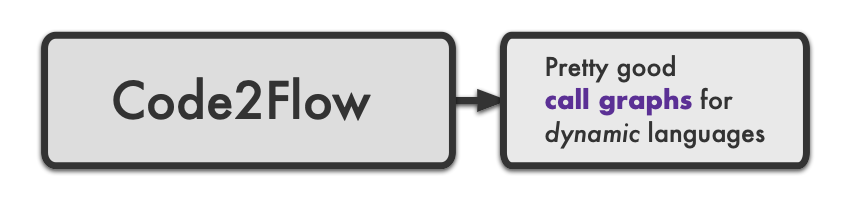
Code2flow generates call graphs for dynamic programming language. Code2flow supports Python, Javascript, Ruby, and PHP.
Code2flow generates call graphs for dynamic programming language. Code2flow supports Python, Javascript, Ruby, and PHP.
 3k Jan 1, 2023
Never use print for debugging again
PySnooper - Never use print for debugging again PySnooper is a poor man's debugger. If you've used Bash, it's like set -x for Python, except it's fanc
 15.5k Jan 1, 2023
A configurable set of panels that display various debug information about the current request/response.
Django Debug Toolbar The Django Debug Toolbar is a configurable set of panels that display various debug information about the current request/respons
7.3k Dec 31, 2022
Sentry is cross-platform application monitoring, with a focus on error reporting.
Users and logs provide clues. Sentry provides answers. What's Sentry? Sentry is a service that helps you monitor and fix crashes in realtime. The serv
 32.9k Dec 31, 2022
Voltron is an extensible debugger UI toolkit written in Python.
Voltron is an extensible debugger UI toolkit written in Python. It aims to improve the user experience of various debuggers (LLDB, GDB, VDB an
 5.9k Dec 30, 2022
Auto-detecting the n+1 queries problem in Python
nplusone nplusone is a library for detecting the n+1 queries problem in Python ORMs, including SQLAlchemy, Peewee, and the Django ORM. The Problem Man
 837 Dec 29, 2022
A configurable set of panels that display various debug information about the current request/response.
Django Debug Toolbar The Django Debug Toolbar is a configurable set of panels that display various debug information about the current request/respons
7.3k Dec 29, 2022
A toolbar overlay for debugging Flask applications
Flask Debug-toolbar This is a port of the excellent django-debug-toolbar for Flask applications. Installation Installing is simple with pip: $ pip ins
 863 Dec 29, 2022
The official code of LM-Debugger, an interactive tool for inspection and intervention in transformer-based language models.
LM-Debugger is an open-source interactive tool for inspection and intervention in transformer-based language models. This repository includes the code
 110 Dec 28, 2022

一个小脚本,用于trace so中native函数的调用。
trace_natives 一个IDA小脚本,获取SO代码段中所有函数的偏移地址,再使用frida-trace 批量trace so函数的调用。 使用方法 1.将traceNatives.py丢进IDA plugins目录中 2.IDA中,Edit-Plugins-traceNatives IDA输
 296 Dec 28, 2022
Dahua Console, access internal debug console and/or other researched functions in Dahua devices.
Dahua Console, access internal debug console and/or other researched functions in Dahua devices.
 156 Dec 28, 2022
Full featured multi arch/os debugger built on top of PyQt5 and frida
Full featured multi arch/os debugger built on top of PyQt5 and frida
 1.1k Dec 26, 2022
pdb++, a drop-in replacement for pdb (the Python debugger)
pdb++, a drop-in replacement for pdb What is it? This module is an extension of the pdb module of the standard library. It is meant to be fully compat
1k Dec 24, 2022
Graphical Python debugger which lets you easily view the values of all evaluated expressions
birdseye birdseye is a Python debugger which records the values of expressions in a function call and lets you easily view them after the function exi
1.5k Dec 24, 2022

Middleware that Prints the number of DB queries to the runserver console.
Django Querycount Inspired by this post by David Szotten, this project gives you a middleware that prints DB query counts in Django's runserver consol
 332 Dec 23, 2022
Debugger capable of attaching to and injecting code into python processes.
DISCLAIMER: This is not an official google project, this is just something I wrote while at Google. Pyringe What this is Pyringe is a python debugger
 1.6k Dec 15, 2022
A drop-in replacement for Django's runserver.
About A drop in replacement for Django's built-in runserver command. Features include: An extendable interface for handling things such as real-time l
 1.3k Dec 15, 2022
A drop-in replacement for Django's runserver.
About A drop in replacement for Django's built-in runserver command. Features include: An extendable interface for handling things such as real-time l
1.3k Dec 15, 2022
An improbable web debugger through WebSockets
wdb - Web Debugger Description wdb is a full featured web debugger based on a client-server architecture. The wdb server which is responsible of manag
 1.6k Dec 9, 2022
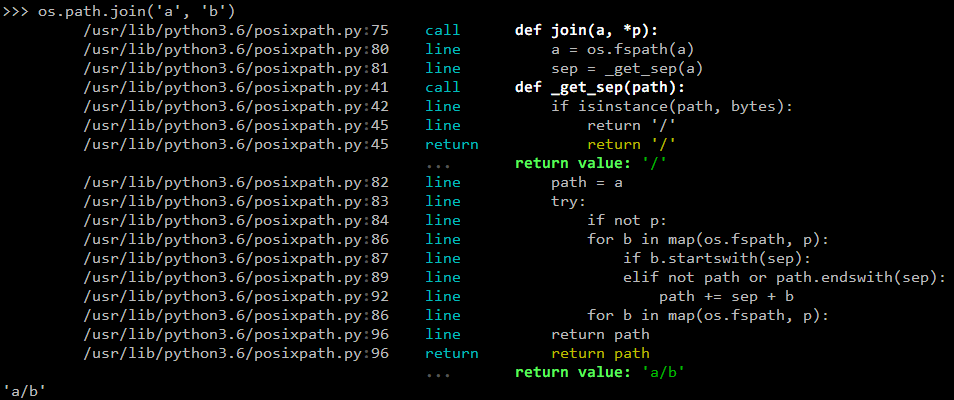
Hunter is a flexible code tracing toolkit.
Overview docs tests package Hunter is a flexible code tracing toolkit, not for measuring coverage, but for debugging, logging, inspection and other ne
 705 Dec 8, 2022
Debugging manhole for python applications.
Overview docs tests package Manhole is in-process service that will accept unix domain socket connections and present the stacktraces for all threads
332 Dec 7, 2022
Little helper to run Steam apps under Proton with a GDB debugger
protongdb A small little helper for running games with Proton and debugging with GDB Requirements At least Python 3.5 protontricks pip package and its
 21 Nov 27, 2022
Trace any Python program, anywhere!
lptrace lptrace is strace for Python programs. It lets you see in real-time what functions a Python program is running. It's particularly useful to de
 687 Nov 20, 2022
Monitor Memory usage of Python code
Memory Profiler This is a python module for monitoring memory consumption of a process as well as line-by-line analysis of memory consumption for pyth
 80 Nov 18, 2022

Sane color handling of osx's accent and highlight color from the commandline
osx-colors Sane command line color customisation for osx, no more fiddling about with defaults, internal apple color constants and rgb color codes Say
 8 Nov 17, 2022
Django package to log request values such as device, IP address, user CPU time, system CPU time, No of queries, SQL time, no of cache calls, missing, setting data cache calls for a particular URL with a basic UI.
django-web-profiler's documentation: Introduction: django-web-profiler is a django profiling tool which logs, stores debug toolbar statistics and also
 77 Oct 29, 2022
NoPdb: Non-interactive Python Debugger
NoPdb: Non-interactive Python Debugger Installation: pip install nopdb Docs: https://nopdb.readthedocs.io/ NoPdb is a programmatic (non-interactive) d
 67 Oct 15, 2022
Automated bug/error reporting for napari
napari-error-monitor Want to help out napari? Install this plugin! This plugin will automatically send error reports to napari (via sentry.io) wheneve
 2 Sep 15, 2022

printstack is a Python package that adds stack trace links to the builtin print function, so that editors such as PyCharm can link you to the source of the print call.
printstack is a Python package that adds stack trace links to the builtin print function, so that editors such as PyCharm can link to the source of the print call.
 101 Aug 26, 2022

A package containing a lot of useful utilities for Python developing and debugging.
Vpack A package containing a lot of useful utilities for Python developing and debugging. Features Sigview: press Ctrl+C to print the current stack in
 16 Aug 18, 2022
Trace all method entries and exits, the exit also prints the return value, if it is of basic type
Trace all method entries and exits, the exit also prints the return value, if it is of basic type. The apk must have set the android:debuggable="true" flag.
 7 Aug 10, 2022

Trashdbg - TrashDBG the world's worse debugger
The world's worse debugger Over the course of multiple OALABS Twitch streams we
 21 Jun 17, 2022
EDB 以太坊单合约交易调试工具
EDB 以太坊单合约交易调试工具 Idea 在刷题的时候遇到一类JOP(Jump-Oriented-Programming)的题目,fuzz或者调试这类题目缺少简单易用的工具,由此开发了一个简单的调试工具EDB(The Ethereum Debugger),利用debug_traceTransact
 16 May 21, 2022
Hypothesis debugging with vscode
Hypothesis debugging with vscode
 0 Feb 9, 2022
AryaBota: An app to teach Python coding via gradual programming and visual output
AryaBota An app to teach Python coding, that gradually allows students to transition from using commands similar to natural language, to more Pythonic
 5 Feb 8, 2022
An x86 old-debug-like program.
An x86 old-debug-like program.
 1 Jan 10, 2022