A Simple Flask-Plotly Example for NTU 110-1 DSSI Class

Overview

A Simple Flask-Plotly Example for NTU 110-1 DSSI Class

Live Demo

截圖 2021-12-10 下午6 13 24

Prerequisites

We will use Flask and Ploty to build a Flask application.

If you haven't installed these packages, run pip install -r requirements.txt and you will be ready for everything.

Contact

If you have any questions or suggestions about the example code, feel free to contact me at [email protected].

You might also like...
Multi-class confusion matrix library in Python

Table of contents Overview Installation Usage Document Try PyCM in Your Browser Issues & Bug Reports Todo Outputs Dependencies Contribution References

These data visualizations were created as homework for my CS40 class. I hope you enjoy!

Data Visualizations These data visualizations were created as homework for my CS40 class. I hope you enjoy! Nobel Laureates by their Country of Birth

Graphical display tools, to help students debug their class implementations in the Carcassonne family of projects

carcassonne_tools Graphical display tools, to help students debug their class implementations in the Carcassonne family of projects NOTE NOTE NOTE The

Here I plotted data for the average test scores across schools and class sizes across school districts.

HW_02 Here I plotted data for the average test scores across schools and class sizes across school districts. Average Test Score by Race This graph re

AB-test-analyzer - Python class to perform AB test analysis

AB-test-analyzer Python class to perform AB test analysis Overview This repo con

Example scripts for generating plots of Bohemian matrices

Bohemian Eigenvalue Plotting Examples This repository contains examples of generating plots of Bohemian eigenvalues. The examples in this repository a

Example Code Notebooks for Data Visualization in Python

This repository contains sample code scripts for creating awesome data visualizations from scratch using different python libraries (such as matplotli

Simple plotting for Python. Python wrapper for D3xter - render charts in the browser with simple Python syntax.

PyDexter Simple plotting for Python. Python wrapper for D3xter - render charts in the browser with simple Python syntax. Setup $ pip install PyDexter

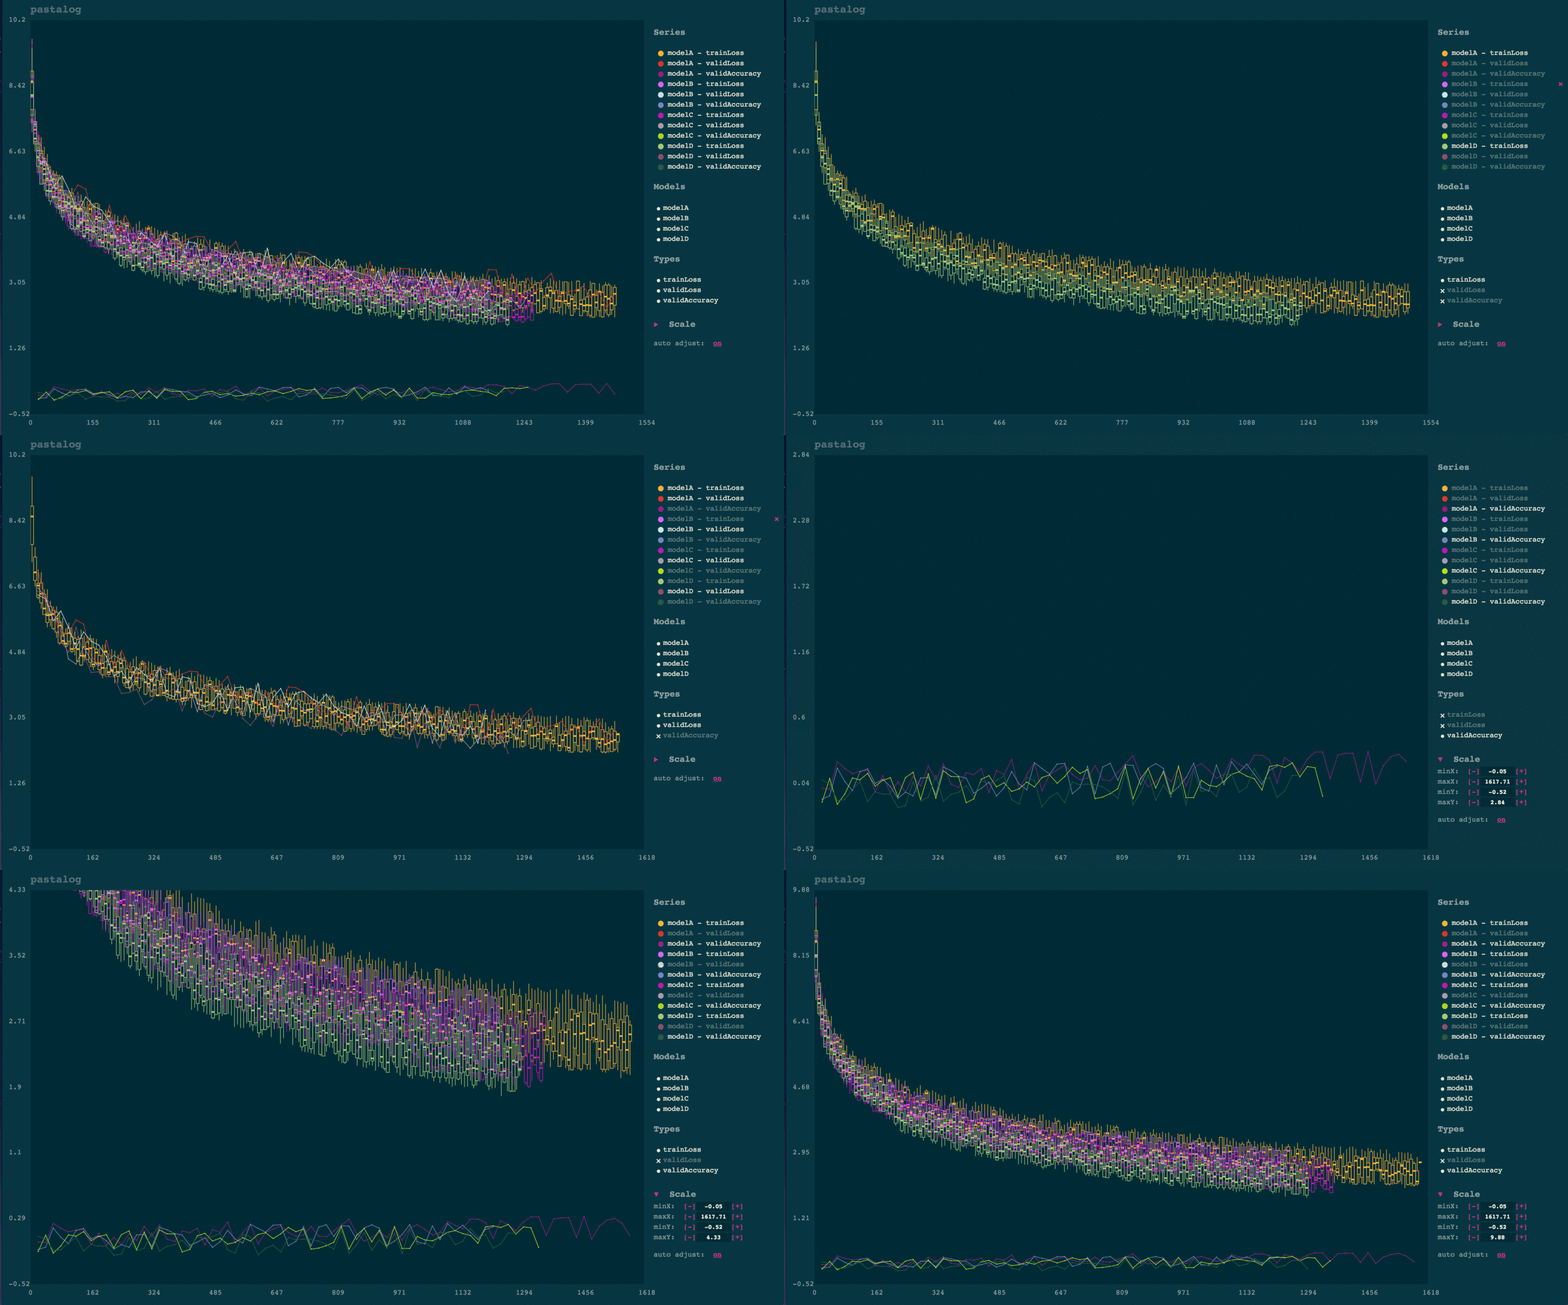
Simple, realtime visualization of neural network training performance.

pastalog Simple, realtime visualization server for training neural networks. Use with Lasagne, Keras, Tensorflow, Torch, Theano, and basically everyth

Owner
Ting Ni Wu
Ting Ni Wu
A curated list of awesome Dash (plotly) resources

Awesome Dash A curated list of awesome Dash (plotly) resources Dash is a productive Python framework for building web applications. Written on top of

Luke Singham 1.7k Dec 26, 2022
The interactive graphing library for Python (includes Plotly Express) :sparkles:

plotly.py Latest Release User forum PyPI Downloads License Data Science Workspaces Our recommended IDE for Plotly’s Python graphing library is Dash En

Plotly 12.7k Jan 5, 2023
Productivity Tools for Plotly + Pandas

Cufflinks This library binds the power of plotly with the flexibility of pandas for easy plotting. This library is available on https://github.com/san

Jorge Santos 2.7k Dec 30, 2022
The interactive graphing library for Python (includes Plotly Express) :sparkles:

plotly.py Latest Release User forum PyPI Downloads License Data Science Workspaces Our recommended IDE for Plotly’s Python graphing library is Dash En

Plotly 8.9k Feb 18, 2021
Productivity Tools for Plotly + Pandas

Cufflinks This library binds the power of plotly with the flexibility of pandas for easy plotting. This library is available on https://github.com/san

Jorge Santos 2.1k Feb 18, 2021
Custom Plotly Dash components based on Mantine React Components library

Dash Mantine Components Dash Mantine Components is a Dash component library based on Mantine React Components Library. It makes it easier to create go

Snehil Vijay 239 Jan 8, 2023
A dashboard built using Plotly-Dash for interactive visualization of Dex-connected individuals across the country.

Dashboard For The DexConnect Platform of Dexterity Global Working prototype submission for internship at Dexterity Global Group. Dashboard for real ti

Yashasvi Misra 2 Jun 15, 2021
Peloton Stats to Google Sheets with Data Visualization through Seaborn and Plotly

Peloton Stats to Google Sheets with Data Visualization through Seaborn and Plotly Problem: 2 peloton users were looking for a way to track their metri

null 9 Jul 22, 2022
A shimmer pre-load component for Plotly Dash

dash-loading-shimmer A shimmer pre-load component for Plotly Dash Installation Get it with pip: pip install dash-loading-extras Or maybe you prefer Pi

Lucas Durand 4 Oct 12, 2022
Regress.me is an easy to use data visualization tool powered by Dash/Plotly.

Regress.me Regress.me is an easy to use data visualization tool powered by Dash/Plotly. Regress.me.-.Google.Chrome.2022-05-10.15-58-59.mp4 Get Started

Amar 14 Aug 14, 2022