Rundeck / Grafana / Prometheus / Rundeck Exporter integration demo

Overview

Rundeck / Prometheus / Grafana integration demo via Rundeck Exporter

This is a demo environment that shows how to monitor a Rundeck instance using Rundeck Exporter (thanks to @phsmith!), Prometheus, and Grafana with this dashboard.

regular

Prerequisites

  1. Docker.
  2. Docker-compose.
  3. A decent modern web browser :-)

Getting the source

git clone https://github.com/MegaDrive68k/rundeck-exporter-demo

Building the environment

  1. Go to the cloned repository directory.
  2. Build the environment with docker-compose build.

Running the environment

  1. Just do docker-compose up.

Testing the environment

  1. Open the http://localhost:3000 URL in your web browser (user admin, password admin) and then select the "Rundeck" dashboard.
  2. Open a new tab with the http://localhost:4440 URL (user admin, password admin) and create a new project with a job, do some executions.
  3. If you check the first browser tab (you will see all Rundeck instance metrics updated on the Grafana dashboard).
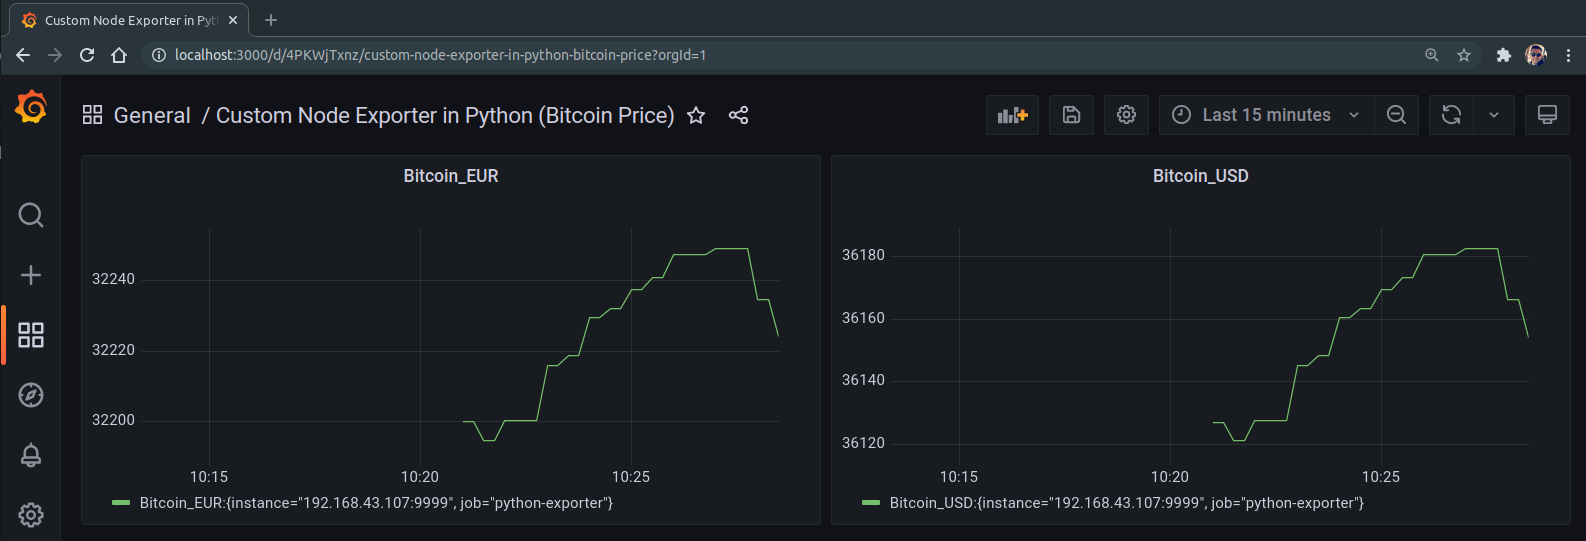
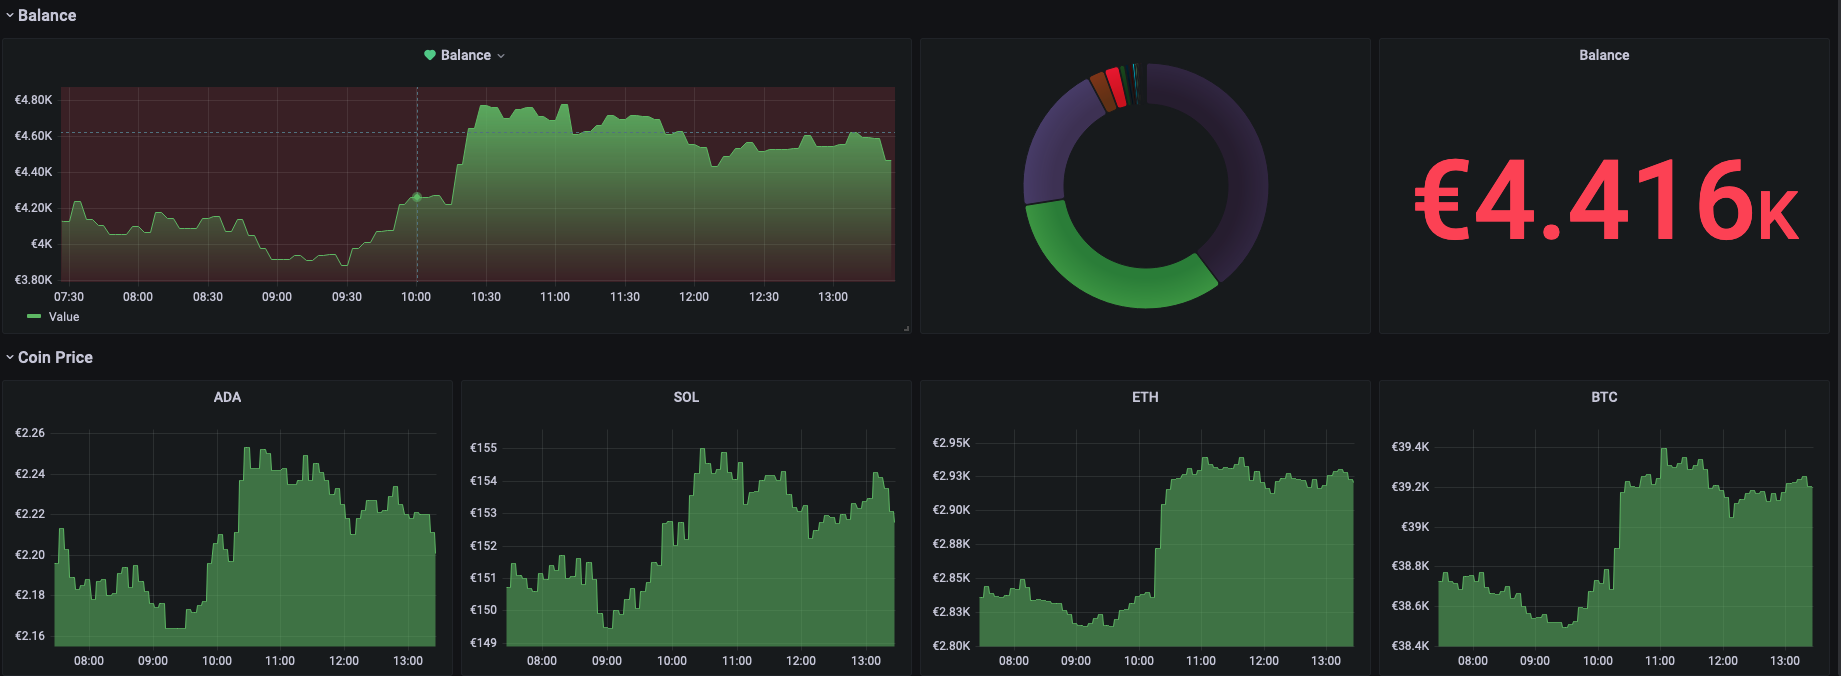
Screenshot

Screen Shot 2021-11-12 at 12 12 34

You might also like...
A demo of Prometheus+Grafana for monitoring an ML model served with FastAPI.

ml-monitoring Jeremy Jordan This repository provides an example setup for monitoring an ML system deployed on Kubernetes.

A System Metrics Monitoring Tool Built using Python3 , rabbitmq,Grafana and InfluxDB. Setup using docker compose. Use to monitor system performance with graphical interface of grafana , storage of influxdb and message queuing of rabbitmq Prometheus exporter for Flask applications
Prometheus exporter for Flask applications

Prometheus Flask exporter This library provides HTTP request metrics to export into Prometheus. It can also track method invocations using convenient

Prometheus exporter for Starlette and FastAPI

starlette_exporter Prometheus exporter for Starlette and FastAPI. The middleware collects basic metrics: Counter: starlette_requests_total Histogram:

Prometheus exporter for Starlette and FastAPI

starlette_exporter Prometheus exporter for Starlette and FastAPI. The middleware collects basic metrics: Counter: starlette_requests_total Histogram:

Prometheus exporter for several chia node statistics

prometheus-chia-exporter Prometheus exporter for several chia node statistics It's assumed that the full node, the harvester and the wallet run on the

A prometheus exporter for torrent downloader like qbittorrent/transmission/deluge

downloader-exporter A prometheus exporter for qBitorrent/Transmission/Deluge. Get metrics from multiple servers and offers them in a prometheus format

Prometheus exporter for Spigot accounts

SpigotExporter Prometheus exporter for Spigot accounts What it provides SpigotExporter will output metrics for each of your plugins and a cumulative d

Prometheus exporter for CNMC API

CNMC Prometheus exporter It needs a Prometheus Pushgateway Install requirements via pip install -r requirements.txt Export the following environment v

Prometheus exporter for AWS Simple Queue Service (SQS)

Prometheus SQS Exporter Prometheus exporter for AWS Simple Queue Service (SQS) Metrics Metric Description ApproximateNumberOfMessages Returns the appr

Prometheus exporter for metrics from the MyAudi API

Prometheus Audi Exporter This Prometheus exporter exports metrics that it fetches from the MyAudi API. Usage Checkout submodules Install dependencies

Prometheus Exporter for data scraped from datenplattform.darmstadt.de

darmstadt-opendata-exporter Scrapes data from https://datenplattform.darmstadt.de and presents it in the Prometheus Exposition format. Pull requests w

Import some key/value data to Prometheus custom-built Node Exporter in Python

About the app In one particilar project, i had to import some key/value data to Prometheus. So i have decided to create my custom-built Node Exporter

Prometheus exporter for chess.com player data

chess-exporter Prometheus exporter for chess.com player data implemented via chess.com's published data API and Prometheus Python Client Example use c

Prometheus exporter for Cisco Unified Computing System (UCS) Manager

prometheus-ucs-exporter Overview Use metrics from the UCS API to export relevant metrics to Prometheus This repository is a fork of Drew Stinnett's or

Restful Api developed with Flask using Prometheus and Grafana for monitoring and containerization with Docker :rocket:

Hephaestus 🚀 In Greek mythology, Hephaestus was either the son of Zeus and Hera or he was Hera's parthenogenous child. ... As a smithing god, Hephaes

CURSO PROMETHEUS E GRAFANA: Observability in a real world

Curso de monitoração com o Prometheus Esse curso ensina como usar o Prometheus como uma ferramenta integrada de monitoração, entender seus conceitos,

Run with one command grafana, prometheus, and a python script to collect and display cryptocurrency prices and track your wallet balance.

CryptoWatch Track your favorite crypto coin price and your wallet balance. Install Create .env: ADMIN_USER=admin ADMIN_PASSWORD=admin Configure you

Launched in 2018 Actively developed and supported. Supports tkinter, Qt, WxPython, Remi (in browser). Create custom layout GUI's simply.  Python 2.7 & 3 Support. 200+ Demo programs & Cookbook for rapid start. Extensive documentation.  Examples using Machine Learning(GUI, OpenCV Integration,  Chatterbot), Floating Desktop Widgets, Matplotlib + Pyplot integration, add GUI to command line scripts, PDF & Image Viewer. For both beginning and advanced programmers .
Comments
  • grafana is showing no data

    grafana is showing no data

    Followed the steps mentioned in documentation. But I am getting "no data" in grafana dashboard image Below is the screenshot of rundeck job image

    Is there anything extra to be done, for getting data?

    opened by manojb7 0
Owner
Reiner
Reiner
Automatically capture your Ookla Speedtest metrics and display them in a Grafana dashboard

Speedtest All-In-One Automatically capture your Ookla Speedtest metrics and display them in a Grafana dashboard. Getting Started About This Code This

Aaron Melton 2 Feb 22, 2022
Linux, Jenkins, AWS, SRE, Prometheus, Docker, Python, Ansible, Git, Kubernetes, Terraform, OpenStack, SQL, NoSQL, Azure, GCP, DNS, Elastic, Network, Virtualization. DevOps Interview Questions

Linux, Jenkins, AWS, SRE, Prometheus, Docker, Python, Ansible, Git, Kubernetes, Terraform, OpenStack, SQL, NoSQL, Azure, GCP, DNS, Elastic, Network, Virtualization. DevOps Interview Questions

Arie Bregman 35.1k Jan 2, 2023
Autoscaling volumes for Kubernetes (with the help of Prometheus)

Kubernetes Volume Autoscaler (with Prometheus) This repository contains a service that automatically increases the size of a Persistent Volume Claim i

DevOps Nirvana 142 Dec 28, 2022
This projects provides the documentation and the automation(code) for the Oracle EMEA WLA COA Demo UseCase.

COA DevOps Training UseCase This projects provides the documentation and the automation(code) for the Oracle EMEA WLA COA Demo UseCase. Demo environme

Cosmin Tudor 1 Jan 28, 2022
Travis CI testing a Dockerfile based on Palantir's remix of Apache Cassandra, testing IaC, and testing integration health of Debian

Testing Palantir's remix of Apache Cassandra with Snyk & Travis CI This repository is to show Travis CI testing a Dockerfile based on Palantir's remix

Montana Mendy 1 Dec 20, 2021
A Habitica Integration with Github Workflows.

Habitica-Workflow A Habitica Integration with Github Workflows. How To Use? Fork (and Star) this repository. Set environment variable in Settings -> S

Priate 2 Dec 20, 2021
Cado Response Integration with Amazon GuardDuty using AWS Lambda

Cado Response Integration with Amazon GuardDuty using AWS Lambda This repository contains a simple example where: An alert is triggered by GuardDuty T

Cado Security 4 Mar 2, 2022
wg-exporter is a simple yet effective Prometheus exporter for Wireguard

wg-exporter wg-exporter is a simple yet effective Prometheus exporter for Wireguard. What are the collected metrics ? General: wg_connected_peers: num

men1n2 3 May 20, 2022
A Prometheus exporter for monitoring & analyzing Grafana Labs' technical documentation

grafana-docs-exporter A Prometheus exporter for monitoring & analyzing Grafana Labs' technical documentation Here is the public endpoint.

Matt Abrams 5 May 2, 2022