K-means clustering is a method used for clustering analysis, especially in data mining and statistics.

Overview

K Means Algorithm

What is K Means

This algorithm is an iterative algorithm that partitions the dataset according to their features into K number of predefined non- overlapping distinct clusters or subgroups. It makes the data points of inter clusters as similar as possible and also tries to keep the clusters as far as possible. It allocates the data points to a cluster if the sum of the squared distance between the cluster’s centroid and the data points is at a minimum, where the cluster’s centroid is the arithmetic mean of the data points that are in the cluster. A less variation in the cluster results in similar or homogeneous data points within the cluster.

Sources :

  1. Nvidia
  2. Wikipedia

How K Means works

  1. Specify number of clusters K.
  2. Initialize centroids by first shuffling the dataset and then randomly selecting K data points for the centroids without replacement.
  3. Keep iterating until there is no change to the centroids. i.e assignment of data points to clusters isn’t changing.
  4. Compute the euclidean distance
  5. Assign each data point to the closest cluster (centroid).
  6. Compute the centroids for the clusters by taking the average of the all data points that belong to each cluster.
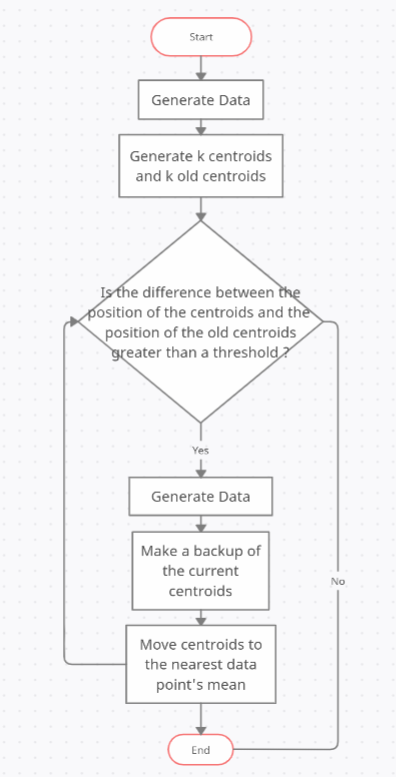
Flow Chart

picture alt


K Means in action

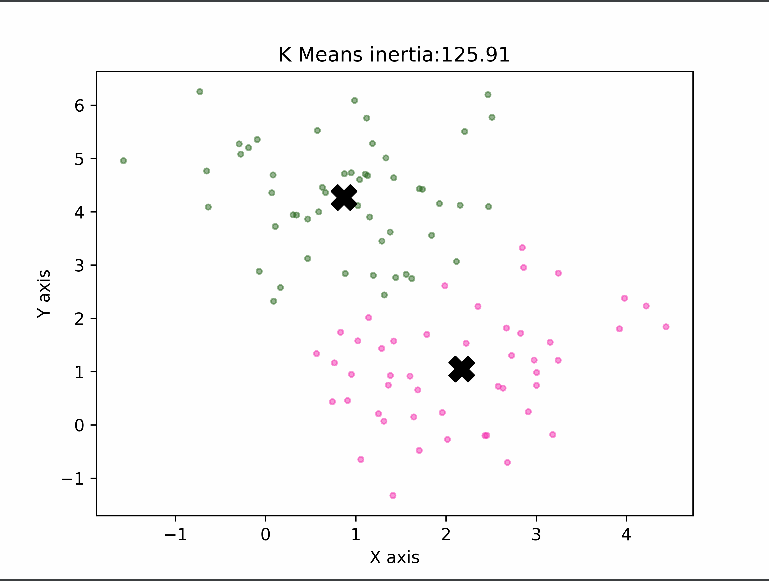
2D:

picture alt

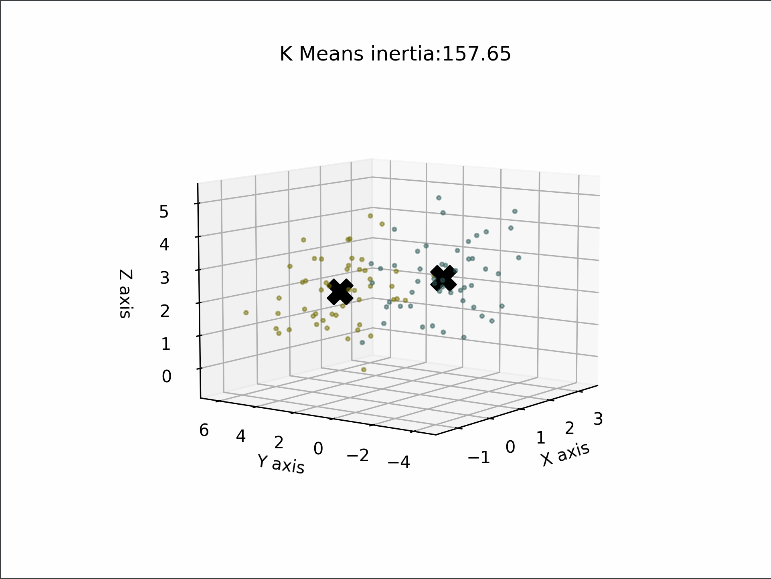
3D:

picture alt

You might also like...
Predicting Baseball Metric Clusters: Clustering Application in Python Using scikit-learn

Clustering Clustering Application in Python Using scikit-learn This repository contains the prediction of baseball metric clusters using MLB Statcast

Turning images into '9-pan' palettes using KMeans clustering from sklearn.

img2palette Turning images into '9-pan' palettes using KMeans clustering from sklearn. Requirements We require: Pillow, for opening and processing ima

A library of extension and helper modules for Python's data analysis and machine learning libraries.

Mlxtend (machine learning extensions) is a Python library of useful tools for the day-to-day data science tasks. Sebastian Raschka 2014-2021 Links Doc

This repository has datasets containing information of Uber pickups in NYC from April 2014 to September 2014 and January to June 2015. data Analysis , virtualization and some insights are gathered here

uber-pickups-analysis Data Source: https://www.kaggle.com/fivethirtyeight/uber-pickups-in-new-york-city Information about data set The dataset contain

This repository contains the code to predict house price using Linear Regression Method

House-Price-Prediction-Using-Linear-Regression The dataset I used for this personal project is from Kaggle uploaded by aariyan panchal. Link of Datase

inding a method to objectively quantify skill versus chance in games, using reinforcement learning

Skill-vs-chance-games-analysis - Finding a method to objectively quantify skill versus chance in games, using reinforcement learning

A toolkit for making real world machine learning and data analysis applications in C++

dlib C++ library Dlib is a modern C++ toolkit containing machine learning algorithms and tools for creating complex software in C++ to solve real worl

Kats is a toolkit to analyze time series data, a lightweight, easy-to-use, and generalizable framework to perform time series analysis.

Kats, a kit to analyze time series data, a lightweight, easy-to-use, generalizable, and extendable framework to perform time series analysis, from understanding the key statistics and characteristics, detecting change points and anomalies, to forecasting future trends.

MaD GUI is a basis for graphical annotation and computational analysis of time series data.

MaD GUI Machine Learning and Data Analytics Graphical User Interface MaD GUI is a basis for graphical annotation and computational analysis of time se

Owner
null
A framework for building (and incrementally growing) graph-based data structures used in hierarchical or DAG-structured clustering and nearest neighbor search

A framework for building (and incrementally growing) graph-based data structures used in hierarchical or DAG-structured clustering and nearest neighbor search

Nicholas Monath 31 Nov 3, 2022
K-Means clusternig example with Python and Scikit-learn

Unsupervised-Machine-Learning Flat Clustering K-Means clusternig example with Python and Scikit-learn Flat clustering Clustering algorithms group a se

Emin 1 Dec 13, 2021
Pandas-method-chaining is a plugin for flake8 that provides method chaining linting for pandas code

pandas-method-chaining pandas-method-chaining is a plugin for flake8 that provides method chaining linting for pandas code. It is a fork from pandas-v

Francis 5 May 14, 2022
Classification based on Fuzzy Logic(C-Means).

CMeans_fuzzy Classification based on Fuzzy Logic(C-Means). Table of Contents About The Project Fuzzy CMeans Algorithm Built With Getting Started Insta

Armin Zolfaghari Daryani 3 Feb 8, 2022
The project's goal is to show a real world application of image segmentation using k means algorithm

The project's goal is to show a real world application of image segmentation using k means algorithm

null 2 Jan 22, 2022
PyPOTS - A Python Toolbox for Data Mining on Partially-Observed Time Series

A python toolbox/library for data mining on partially-observed time series, supporting tasks of forecasting/imputation/classification/clustering on incomplete multivariate time series with missing values.

Wenjie Du 179 Dec 31, 2022
Can a machine learning project be implemented to estimate the salaries of baseball players whose salary information and career statistics for 1986 are shared?

END TO END MACHINE LEARNING PROJECT ON HITTERS DATASET Can a machine learning project be implemented to estimate the salaries of baseball players whos

Pinar Oner 7 Dec 18, 2021
Mixing up the Invariant Information clustering architecture, with self supervised concepts from SimCLR and MoCo approaches

Self Supervised clusterer Combined IIC, and Moco architectures, with some SimCLR notions, to get state of the art unsupervised clustering while retain

Bendidi Ihab 9 Feb 13, 2022
Self Organising Map (SOM) for clustering of atomistic samples through unsupervised learning.

Self Organising Map for Clustering of Atomistic Samples - V2 Description Self Organising Map (also known as Kohonen Network) implemented in Python for

Franco Aquistapace 0 Nov 16, 2021
GroundSeg Clustering Optimized Kdtree

ground seg and clustering based on kitti velodyne data, and a additional optimized kdtree for knn and radius nn search

null 2 Dec 2, 2021