YOPO (You Only Plot Once)
You Only Plot Once
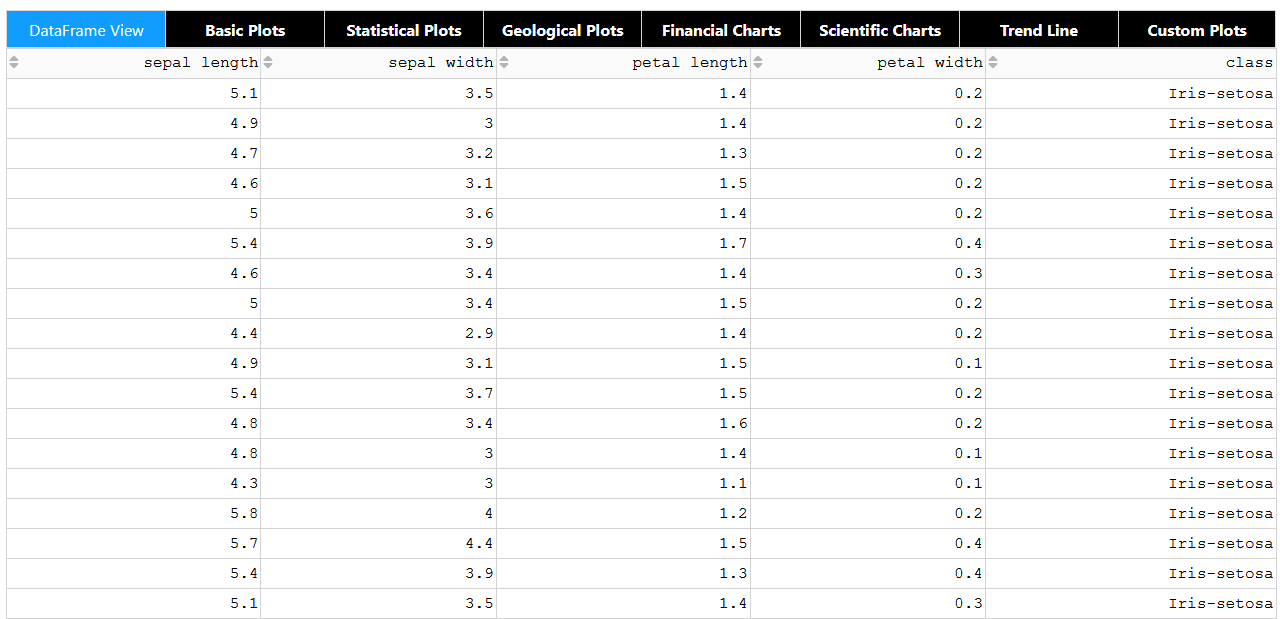
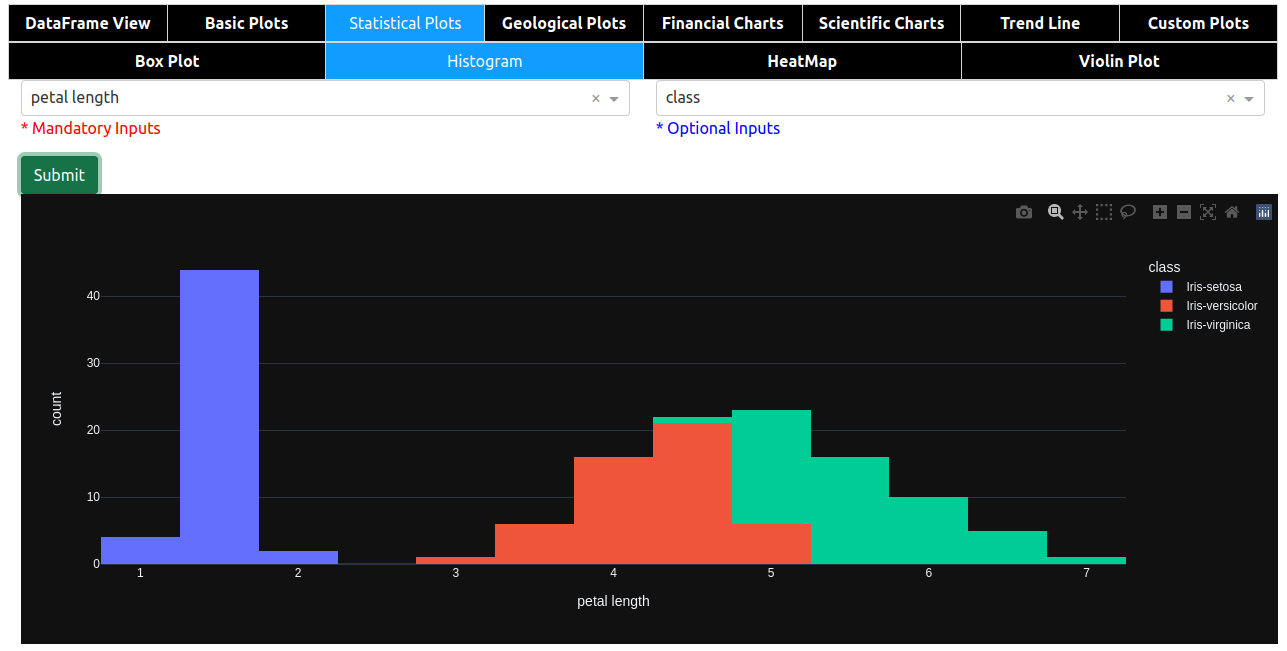
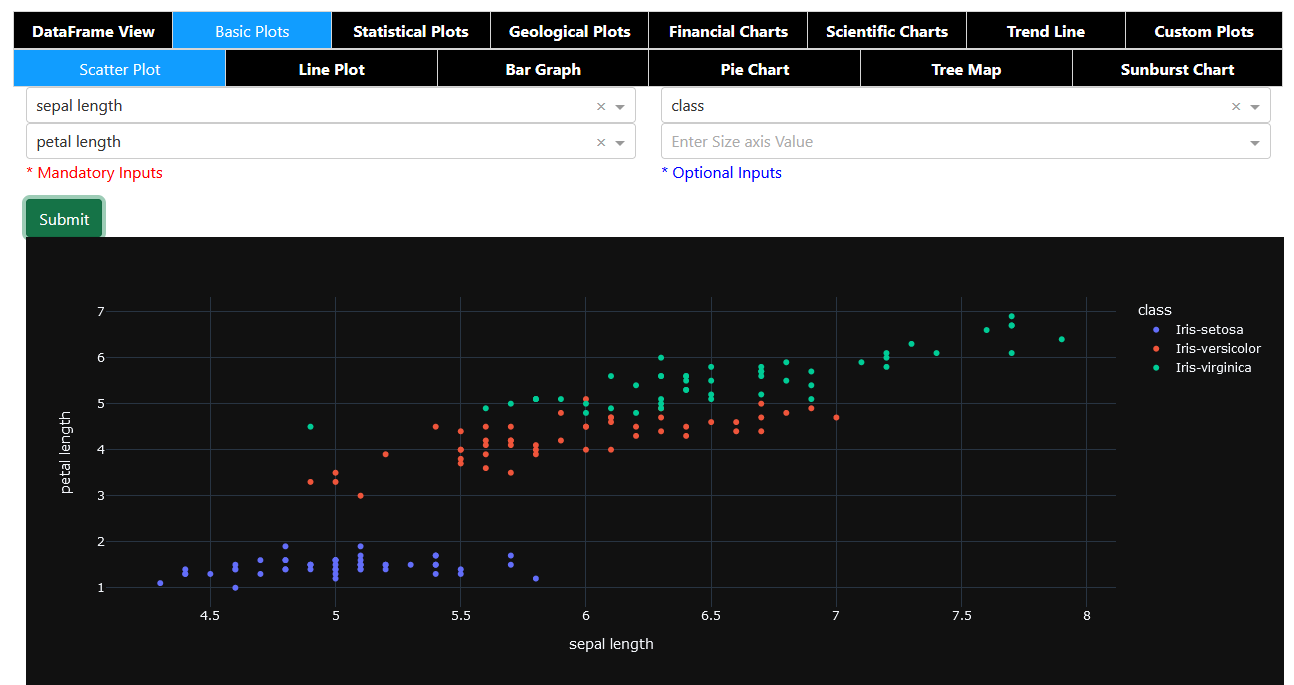
YOPO is an interactive dashboard which generates various standard plots.you can create various graphs and charts with a click of a button. This tool uses Dash and Flask in backend.
Table of contents
Installing YOPO
To install from PyPi:
pip install yopo
To install from source:
cd <your_project>
git clone https://github.com/chekoduadarsh/YOPO-You-Only-Plot-Once.git
# or download and unzip https://github.com/AutoViML/AutoViz/archive/master.zip
# if you dont have virtualenv install from here https://packaging.python.org/en/latest/guides/installing-using-pip-and-virtual-environments/
python3 -m venv env
source env/bin/activate
git clone https://github.com/chekoduadarsh/YOPO-You-Only-Plot-Once.git
# or download and unzip https://github.com/AutoViML/AutoViz/archive/master.zip
cd yopo
python3 -m pip install .
Usage
its very easy to use YOPO, u just need to pass the dataframe and it will generate the dashboard. 
A code like this will generate multiple plots like given below.
Contribute
If you find any error or need support please raise a issue. If you think you can add a feature, or help solve a bug please raise a PR This repo welcomes any kind of contributions pray
Feel free to adapt it criticize it and support it the way you like!!


