Awesome Spectral Indices in Python.

Overview

spyndex

Awesome Spectral Indices in Python:

Numpy | Pandas | GeoPandas | Xarray | Earth Engine | Planetary Computer | Dask

PyPI conda-forge Documentation Status Tests Awesome Spectral Indices License GitHub Sponsors Buy me a coffee Ko-fi Twitter Black isort


GitHub: https://github.com/davemlz/spyndex

Documentation: https://spyndex.readthedocs.io/

PyPI: https://pypi.org/project/spyndex/

Conda-forge: https://anaconda.org/conda-forge/spyndex

Tutorials: https://spyndex.readthedocs.io/en/latest/tutorials.html


Overview

The Awesome Spectral Indices is a standardized ready-to-use curated list of spectral indices that can be used as expressions for computing spectral indices in remote sensing applications. The list was born initially to supply spectral indices for Google Earth Engine through eemont and spectral, but given the necessity to compute spectral indices for other object classes outside the Earth Engine ecosystem, a new package was required.

Spyndex is a python package that uses the spectral indices from the Awesome Spectral Indices list and creates an expression evaluation method that is compatible with python object classes that support overloaded operators (e.g. numpy.ndarray, pandas.Series, xarray.DataArray).

Some of the spyndex features are listed here:

  • Access to Spectral Indices from the Awesome Spectral Indices list.
  • Multiple Spectral Indices computation.
  • Kernel Indices computation.
  • Parallel processing.
  • Compatibility with a lot of python objects!

Check the simple usage of spyndex here:

import spyndex
import numpy as np
import xarray as xr

N = np.random.normal(0.6,0.10,10000)
R = np.random.normal(0.1,0.05,10000)

da = xr.DataArray(
    np.array([N,R]).reshape(2,100,100),
    dims = ("band","x","y"),
    coords = {"band": ["NIR","Red"]}
)

idx = spyndex.computeIndex(
    index = ["NDVI","SAVI"],
    params = {
        "N": da.sel(band = "NIR"),
        "R": da.sel(band = "Red"),
        "L": 0.5
    }
)

How does it work?

Any python object class that supports overloaded operators can be used with spyndex methods.


"Hey... what do you mean by 'overloaded operators'?"


That's the million dollars' question! An object class that supports overloaded operators is the one that allows you to compute mathematical operations using common operators (+, -, /, *, **) like a + b, a + b * c or (a - b) / (a + b). You know the last one, right? That's the formula of the famous NDVI.

So, if you can use the overloaded operators with an object class, you can use that class with spyndex!

BE CAREFUL! Not all overloaded operators work as mathematical operators. In a list object class, the addition operator (+) concatenates two objects instead of performing an addition operation! So you must convert the list into a numpy.ndarray before using spyndex!

Here is a little list of object classes that support mathematical overloaded operators:

And wait, there is more! If objects that support overloaded operatores can be used in spyndex, that means that you can work in parallel with dask!

Here is the list of the dask objects that you can use with spyndex:

  • dask.Array (with dask)
  • dask.Series (with dask)

This means that you can actually use spyndex in a lot of processes! For example, you can download a Sentinel-2 image with sentinelsat, open and read it with rasterio and then compute the desired spectral indices with spyndex. Or you can search through the Landsat-8 STAC in the Planetary Computer ecosystem using pystac-client, convert it to an xarray.DataArray with stackstac and then compute spectral indices using spyndex in parallel with dask! Amazing, right!?

Installation

Install the latest version from PyPI:

pip install spyndex

Upgrade spyndex by running:

pip install -U spyndex

Install the latest version from conda-forge:

conda install -c conda-forge spyndex

Install the latest dev version from GitHub by running:

pip install git+https://github.com/davemlz/spyndex

Features

Exploring Spectral Indices

Spectral Indices from the Awesome Spectral Indices list can be accessed through spyndex.indices. This is a Box object where each one of the indices in the list can be accessed as well as their attributes:

import spyndex

# All indices
spyndex.indices

# NDVI index
spyndex.indices["NDVI"]

# Or with dot notation
spyndex.indices.NDVI

# Formula of the NDVI
spyndex.indices["NDVI"]["formula"]

# Or with dot notation
spyndex.indices.NDVI.formula

# Reference of the NDVI
spyndex.indices["NDVI"]["reference"]

# Or with dot notation
spyndex.indices.NDVI.reference

Default Values

Some Spectral Indices require constant values in order to be computed. Default values can be accessed through spyndex.constants. This is a Box object where each one of the constants can be accessed:

import spyndex

# All constants
spyndex.constants

# Canopy Background Adjustment
spyndex.constants["L"]

# Or with dot notation
spyndex.constants.L

# Default value
spyndex.constants["L"]["default"]

# Or with dot notation
spyndex.constants.L.default

Band Parameters

The standard band parameters description can be accessed through spyndex.bands. This is a Box object where each one of the bands can be accessed:

import spyndex

# All bands
spyndex.bands

# Blue band
spyndex.bands["B"]

# Or with dot notation
spyndex.bands.B

One (or more) Spectral Indices Computation

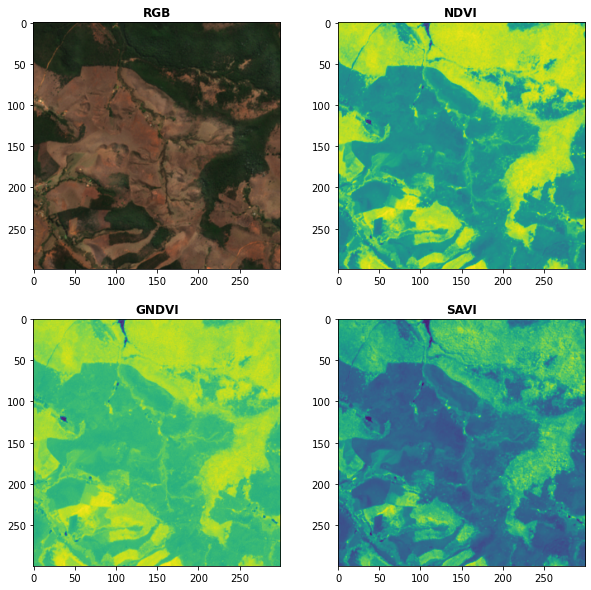
Use the computeIndex() method to compute as many spectral indices as you want! The index parameter receives the spectral index or a list of spectral indices to compute, while the params parameter receives a dictionary with the required parameters for the spectral indices computation.

import spyndex
import xarray as xr
import matplotlib.pyplot as plt
from rasterio import plot

# Open a dataset (in this case a xarray.DataArray)
snt = spyndex.datasets.open("sentinel")

# Scale the data (remember that the valid domain for reflectance is [0,1])
snt = snt / 10000

# Compute the desired spectral indices
idx = spyndex.computeIndex(
    index = ["NDVI","GNDVI","SAVI"],
    params = {
        "N": snt.sel(band = "B08"),
        "R": snt.sel(band = "B04"),
        "G": snt.sel(band = "B03"),
        "L": 0.5
    }
)

# Plot the indices (and the RGB image for comparison)
fig, ax = plt.subplots(2,2,figsize = (10,10))
plot.show(snt.sel(band = ["B04","B03","B02"]).data / 0.3,ax = ax[0,0],title = "RGB")
plot.show(idx.sel(index = "NDVI"),ax = ax[0,1],title = "NDVI")
plot.show(idx.sel(index = "GNDVI"),ax = ax[1,0],title = "GNDVI")
plot.show(idx.sel(index = "SAVI"),ax = ax[1,1],title = "SAVI")

sentinel spectral indices

Kernel Indices Computation

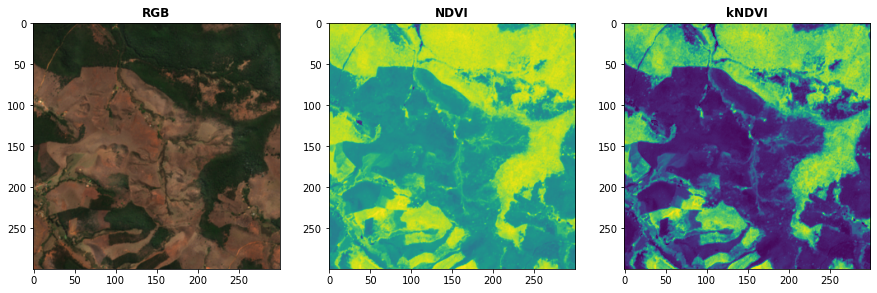
Use the computeKernel() method to compute the required kernel for kernel indices like the kNDVI! The kernel parameter receives the kernel to compute, while the params parameter receives a dictionary with the required parameters for the kernel computation (e.g., a, b and sigma for the RBF kernel).

import spyndex
import xarray as xr
import matplotlib.pyplot as plt
from rasterio import plot

# Open a dataset (in this case a xarray.DataArray)
snt = spyndex.datasets.open("sentinel")

# Scale the data (remember that the valid domain for reflectance is [0,1])
snt = snt / 10000

# Compute the kNDVI and the NDVI for comparison
idx = spyndex.computeIndex(
    index = ["NDVI","kNDVI"],
    params = {
        # Parameters required for NDVI
        "N": snt.sel(band = "B08"),
        "R": snt.sel(band = "B04"),
        # Parameters required for kNDVI
        "kNN" : 1.0,
        "kNR" : spyndex.computeKernel(
            kernel = "RBF",
            params = {
                "a": snt.sel(band = "B08"),
                "b": snt.sel(band = "B04"),
                "sigma": snt.sel(band = ["B08","B04"]).mean("band")
            }),
    }
)

# Plot the indices (and the RGB image for comparison)
fig, ax = plt.subplots(1,3,figsize = (15,15))
plot.show(snt.sel(band = ["B04","B03","B02"]).data / 0.3,ax = ax[0],title = "RGB")
plot.show(idx.sel(index = "NDVI"),ax = ax[1],title = "NDVI")
plot.show(idx.sel(index = "kNDVI"),ax = ax[2],title = "kNDVI")

sentinel kNDVI

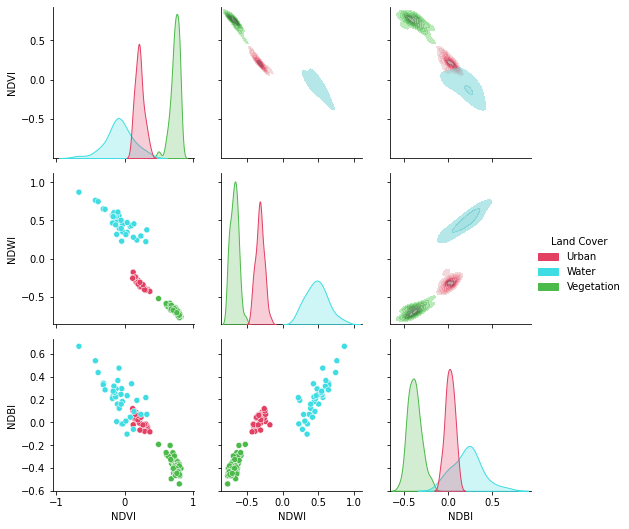
A pandas.DataFrame? Sure!

No matter what kind of python object you're working with, it can be used with spyndex as long as it supports mathematical overloaded operators!

import spyndex
import pandas as pd
import seaborn as sns
import matplotlib.pyplot as plt

# Open a dataset (in this case a pandas.DataFrame)
df = spyndex.datasets.open("spectral")

# Compute the desired spectral indices
idx = spyndex.computeIndex(
    index = ["NDVI","NDWI","NDBI"],
    params = {
        "N": df["SR_B5"],
        "R": df["SR_B4"],
        "G": df["SR_B3"],
        "S1": df["SR_B6"]
    }
)

# Add the land cover column to the result
idx["Land Cover"] = df["class"]

# Create a color palette for plotting
colors = ["#E33F62","#3FDDE3","#4CBA4B"]

# Plot a pairplot to check the indices behaviour
plt.figure(figsize = (15,15))
g = sns.PairGrid(idx,hue = "Land Cover",palette = sns.color_palette(colors))
g.map_lower(sns.scatterplot)
g.map_upper(sns.kdeplot,fill = True,alpha = .5)
g.map_diag(sns.kdeplot,fill = True)
g.add_legend()
plt.show()

landsat spectral indices

Parallel Processing

Parallel processing is possible with spyndex and dask! You can use dask.array or dask.dataframe objects to compute spectral indices with spyndex! If you're using xarray, you can also define a chunk size and work in parallel!

import spyndex
import numpy as np
import dask.array as da

# Define the array shape
array_shape = (10000,10000)

# Define the chunk size
chunk_size = (1000,1000)

# Create a dask.array object
dask_array = da.array([
    da.random.normal(0.6,0.10,array_shape,chunks = chunk_size),
    da.random.normal(0.1,0.05,array_shape,chunks = chunk_size)
])

# "Compute" the desired spectral indices
idx = spyndex.computeIndex(
    index = ["NDVI","SAVI"],
    params = {
        "N": dask_array[0],
        "R": dask_array[1],
        "L": 0.5
    }
)

# Since dask works in lazy mode,
# you have to tell it that you want to compute the indices!
idx.compute()

Plotting Spectral Indices

All posible values of a spectral index can be visualized using spyndex.plot.heatmap()! This is a module that doesn't require data, just specify the index, the bands, and BOOM! Heatmap of all the possible values of the index!

import spyndex
import matplotlib.pyplot as plt
import seaborn as sns

# Define subplots grid
fig, ax = plt.subplots(1,2,figsize = (20,8))

# Plot the NDVI with the Red values on the x-axis and the NIR on the y-axis
ax[0].set_title("NDVI heatmap with default parameters")
spyndex.plot.heatmap("NDVI","R","N",ax = ax[0])

# Keywords arguments can be passed for sns.heatmap()
ax[1].set_title("NDVI heatmap with seaborn keywords arguments")
spyndex.plot.heatmap("NDVI","R","N",annot = True,cmap = "Spectral",ax = ax[1])

plt.show()

heatmap

License

The project is licensed under the MIT license.

Contributing

Check the contributing page.

Comments
  • issue in calculating some of the vegetation indices

    issue in calculating some of the vegetation indices

    Hi, I have used this library to calculate some vegetation indices, but the "EVI", "GBNDVI", "GLI", "GRNDVI", "MSAVI", "MTVI2", and "VARI" could not calculate and I got this error: MergeError: conflicting values for variable 'band' on objects to be combined. You can skip this check by specifying compat='override'.

    bug 
    opened by Raziehgithub 7
  • QST: Compute custom spectral indices

    QST: Compute custom spectral indices

    Hello,

    Is it possible to compute custom indices that are not registered in Awesome Spectral Indices ?

    My usecase is that I have maybe too specific indices that wouldn't be useful to the community. Or indices using satellites not handled currently like WorldViews/PlanetScope with the Yellow band.

    If not I would be happy to share them all 😄

    enhancement 
    opened by remi-braun 4
  • Something wrong with NDWI

    Something wrong with NDWI

    Hello, i've been trying to use the computeIndex for NDWI but apart from all other indexes working well, NDWI has been presenting issues so i've tested every way to compute it correctly but it seems something's wrong.

    The image below shows the test i've made using the same variables but computeIndex returning the wrong range of values:

    image

    opened by abreufilho 2
  • QST: Maturity level of spyndex

    QST: Maturity level of spyndex

    Hello,

    I would like to use your library in eoreader, to replace my own way of computing spectral indices. I see that in setup.py you still are in pre-alpha mode, but according to your code, documentation and README, you seems pretty well advanced.

    So, should I wait an API stabilization ? Or am I good to go ? 😄

    opened by remi-braun 2
  • Can't load the package in google colab

    Can't load the package in google colab

    Hi, thank you for developing the package. I tried to use it in fresh google colab session but it keeps giving me dask error.

    The installation is successful but loading the package gives me this error: image

    thank you..

    opened by seuriously 2
  • Missing gamma parameter for ARVI index.

    Missing gamma parameter for ARVI index.

    @davemlz is the gamma parameter a fixed constant or does it need to always be specified by the user ? It is not added in the constant class. Thanks for looking into this.

    enhancement 
    opened by julianblue 2
  • Add `kwargs` to `computeIndex` and `computeKernel`

    Add `kwargs` to `computeIndex` and `computeKernel`

    Add kwargs so users don't have to pass a dict if they don't want to.

    Example:

    spyndex.computeIndex("NDVI",N = 0.67,R = 0.12)
    

    instead of:

    spyndex.computeIndex("NDVI",{"N": 0.67,"R": 0.12})
    
    enhancement 
    opened by davemlz 1
  • Add plots module

    Add plots module

    Create a plots module where the user can visualize the behaviour of a spectral index value according to the change in the spectral inputs with anotated heatmaps.

    enhancement 
    opened by davemlz 1
  • [Suggestion] Pin requirement versions (specifically python-box)

    [Suggestion] Pin requirement versions (specifically python-box)

    Hello, I am the developer of python-box and see that it is a requirement in this repo and has not been version pinned. I suggest that you pin it to the max known compatible version in your requirements.txt and/or setup.py file(s):

    python-box[all]~=5.4  
    

    Or without extra dependencies

    python-box~=5.4
    

    Using ~=5.0 (or any minor version) will lock it to the major version of 5 and minimum of minor version specified. If you add a bugfix space for 5.4.0 it would lock it to the minor version 5.4.*.

    The next major release of Box is right around the corner, and while it has many improvements, I want to ensure you have a smooth transition by being able to test at your own leisure to ensure your standard user cases do not run into any issues. I am keeping track of major changes, so please check there as a quick overview of any differences.

    To test new changes, try out the release candidate:

    pip install python-box[all]~=6.0.0rc4
    
    opened by cdgriffith 0
  • Default values for constants in spectral indices

    Default values for constants in spectral indices

    Hello,

    Would it be possible (if useful) to have default values for constants in specified index (ie. L for SAVI) ? 😃 I am trying to have the minimum required intervention from the user, so it would be helpful!

    enhancement 
    opened by remi-braun 6
Releases(0.2.0)
  • 0.2.0(Oct 8, 2022)

    spyndex v0.2.0 :artificial_satellite: :seedling: :rocket:

    Improvements

    • Awesome Spectral Indices list upgraded to v0.2.0.
    • Bands and Constants objects are automatically updated.
    Source code(tar.gz)
    Source code(zip)
  • 0.1.0(Jun 2, 2022)

    spyndex v0.1.0 :artificial_satellite: :seedling: :rocket:

    New Features

    • The platformsattribute for the SpectralIndexclass was created.
    • The type attribute was replaced by the application_domain attribute in the SpectralIndex class.

    Improvements

    • Awesome Spectral Indices list upgraded to v0.1.0.
    Source code(tar.gz)
    Source code(zip)
  • 0.0.5(Mar 6, 2022)

    spyndex v0.0.5 :artificial_satellite: :seedling: :rocket:

    New Features

    • The SpectralIndices class was created.
    • The SpectralIndex class was created.
    • The Bands class was created.
    • The Band class was created.
    • The PlatformBand class was created.
    • The Constants class was created.
    • The Constant class was created.

    Improvements

    • Awesome Spectral Indices list upgraded to v0.0.6.
    • Added kwargs argument to computeIndex.
    • Added kwargs argument to computeKernel.
    • Added omega to spyndex.constants.
    • Added k to spyndex.constants.
    • Added PAR to spyndex.constants.
    • Added lambdaG, lambdaR and lambdaN to spyndex.constants.
    Source code(tar.gz)
    Source code(zip)
  • 0.0.4(Dec 23, 2021)

  • 0.0.3(Oct 18, 2021)

  • 0.0.2(Oct 7, 2021)

    v0.0.2

    Improvements

    • Fixed conflicts with coordinates for xarray.DataArray objects when computing multiple indices.
    • Local parameters are now used instead of global parameters.
    Source code(tar.gz)
    Source code(zip)
  • 0.0.1(Sep 21, 2021)

Owner
David Montero Loaiza
PhD Student at UniLeipzig | Research Assistant at RSC4Earth | MSc in Data Science | Topographic Engineer
David Montero Loaiza
Links to awesome OCR projects

Awesome OCR This list contains links to great software tools and libraries and literature related to Optical Character Recognition (OCR). Contribution

Konstantin Baierer 2.2k Jan 2, 2023
A curated list of awesome synthetic data for text location and recognition

awesome-SynthText A curated list of awesome synthetic data for text location and recognition and OCR datasets. Text location SynthText SynthText_Chine

Tianzhong 283 Jan 5, 2023
Awesome anomaly detection in medical images

A curated list of awesome anomaly detection works in medical imaging, inspired by the other awesome-* initiatives.

Kang Zhou 57 Dec 19, 2022
This is a repository to learn and get more computer vision skills, make robotics projects integrating the computer vision as a perception tool and create a lot of awesome advanced controllers for the robots of the future.

This is a repository to learn and get more computer vision skills, make robotics projects integrating the computer vision as a perception tool and create a lot of awesome advanced controllers for the robots of the future.

Elkin Javier Guerra Galeano 17 Nov 3, 2022
A Screen Translator/OCR Translator made by using Python and Tesseract, the user interface are made using Tkinter. All code written in python.

About An OCR translator tool. Made by me by utilizing Tesseract, compiled to .exe using pyinstaller. I made this program to learn more about python. I

Fauzan F A 41 Dec 30, 2022
The world's simplest facial recognition api for Python and the command line

Face Recognition You can also read a translated version of this file in Chinese 简体中文版 or in Korean 한국어 or in Japanese 日本語. Recognize and manipulate fa

Adam Geitgey 47k Jan 7, 2023
A Python wrapper for Google Tesseract

Python Tesseract Python-tesseract is an optical character recognition (OCR) tool for python. That is, it will recognize and "read" the text embedded i

Matthias A Lee 4.6k Jan 6, 2023
A Python wrapper for the tesseract-ocr API

tesserocr A simple, Pillow-friendly, wrapper around the tesseract-ocr API for Optical Character Recognition (OCR). tesserocr integrates directly with

Fayez 1.7k Dec 31, 2022
Simple SDF mesh generation in Python

Generate 3D meshes based on SDFs (signed distance functions) with a dirt simple Python API.

Michael Fogleman 1.1k Jan 8, 2023
Image processing in Python

scikit-image: Image processing in Python Website (including documentation): https://scikit-image.org/ Mailing list: https://mail.python.org/mailman3/l

Image Processing Toolbox for SciPy 5.2k Dec 30, 2022
Image augmentation library in Python for machine learning.

Augmentor is an image augmentation library in Python for machine learning. It aims to be a standalone library that is platform and framework independe

Marcus D. Bloice 4.8k Jan 4, 2023
A simple document layout analysis using Python-OpenCV

Run the application: python main.py *Note: For first time running the application, create a folder named "output". The application is a simple documen

Roinand Aguila 109 Dec 12, 2022
Python library to extract tabular data from images and scanned PDFs

Overview ExtractTable - API to extract tabular data from images and scanned PDFs The motivation is to make it easy for developers to extract tabular d

Org. Account 165 Dec 31, 2022
Textboxes_plusplus implementation with Tensorflow (python)

TextBoxes++-TensorFlow TextBoxes++ re-implementation using tensorflow. This project is greatly inspired by slim project And many functions are modifie

null 81 Dec 7, 2022
Textboxes implementation with Tensorflow (python)

tb_tensorflow A python implementation of TextBoxes Dependencies TensorFlow r1.0 OpenCV2 Code from Chaoyue Wang 03/09/2017 Update: 1.Debugging optimize

Jayne Shin (신재인) 20 May 31, 2019
Textboxes : Image Text Detection Model : python package (tensorflow)

shinTB Abstract A python package for use Textboxes : Image Text Detection Model implemented by tensorflow, cv2 Textboxes Paper Review in Korean (My Bl

Jayne Shin (신재인) 91 Dec 15, 2022
python ocr using tesseract/ with EAST opencv detector

pytextractor python ocr using tesseract/ with EAST opencv text detector Uses the EAST opencv detector defined here with pytesseract to extract text(de

Danny Crasto 38 Dec 5, 2022
Python-based tools for document analysis and OCR

ocropy OCRopus is a collection of document analysis programs, not a turn-key OCR system. In order to apply it to your documents, you may need to do so

OCRopus 3.2k Dec 31, 2022
A Tensorflow model for text recognition (CNN + seq2seq with visual attention) available as a Python package and compatible with Google Cloud ML Engine.

Attention-based OCR Visual attention-based OCR model for image recognition with additional tools for creating TFRecords datasets and exporting the tra

Ed Medvedev 933 Dec 29, 2022