PyG2Plot
🎨 Python3 binding for@AntV/G2Plotwhich an interactive and responsive charting library. Based on the grammar of graphics, you can easily make superior statistical charts through a few lines of code.PyG2Plotis inspired by pyecharts.

![]()

Document: 中文说明文档 · Drawing statistical plots · In Jupyter Notebook · Principles
Installation
$ pip install pyg2plot
Usage
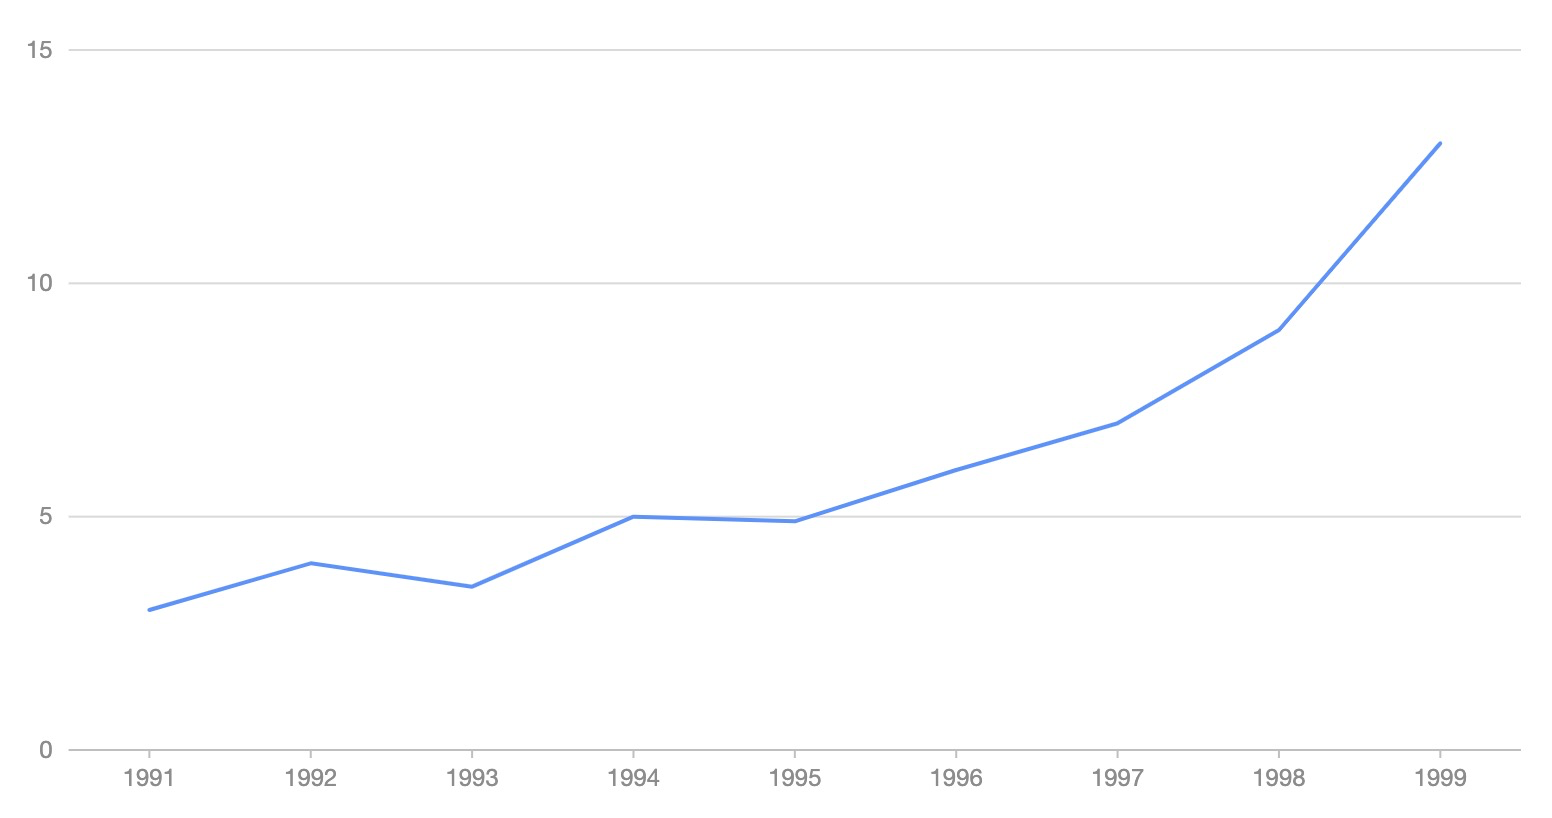
render HTML
from pyg2plot import Plot

line = Plot("Line")

line.set_options({
  "data": [
    { "year": "1991", "value": 3 },
    { "year": "1992", "value": 4 },
    { "year": "1993", "value": 3.5 },
    { "year": "1994", "value": 5 },
    { "year": "1995", "value": 4.9 },
    { "year": "1996", "value": 6 },
    { "year": "1997", "value": 7 },
    { "year": "1998", "value": 9 },
    { "year": "1999", "value": 13 },
  ],
  "xField": "year",
  "yField": "value",
})

# 1. render html file
line.render("plot.html")
# 2. render html string
line.render_html()
render Jupyter
from pyg2plot import Plot

line = Plot("Line")

line.set_options({
  "height": 400, # set a default height in jupyter preview
  "data": [
    { "year": "1991", "value": 3 },
    { "year": "1992", "value": 4 },
    { "year": "1993", "value": 3.5 },
    { "year": "1994", "value": 5 },
    { "year": "1995", "value": 4.9 },
    { "year": "1996", "value": 6 },
    { "year": "1997", "value": 7 },
    { "year": "1998", "value": 9 },
    { "year": "1999", "value": 13 },
  ],
  "xField": "year",
  "yField": "value",
})

# 1. render in notebook
line.render_notebook()

# 2. render in jupyter lab
line.render_jupyter_lab()
API
Now, only has one API of pyg2plot.
- Plot
-
Plot(plot_type: str): get an instance of
Plotclass. -
plot.set_options(options: object): set the options of G2Plot into instance.
-
plot.render(path, env, **kwargs): render out html file by setting the path, jinja2 env and kwargs.
-
plot.render_notebook(env, **kwargs): render plot on jupyter preview.
-
plot.render_html(env, **kwargs): render out html string by setting jinja2 env and kwargs.
-
plot.dump_js_options(env, **kwargs): dump js options by setting jinja2 env and kwargs, use it for HTTP request.
More apis is on the way.
License
MIT@hustcc.


 2.3k Dec 31, 2022
 30 Feb 22, 2022
 13.1k Jan 3, 2023
 3.4k Dec 30, 2022
 611 Dec 29, 2022
 820 Jan 6, 2023
 24 Jan 2, 2023
 192 Dec 29, 2022
 553 Dec 30, 2022
 162 Nov 11, 2022
 31 Mar 6, 2021
 16.7k Jan 8, 2023
 1.6k Jan 8, 2023
 697 Jan 6, 2023
 822 Jan 7, 2023