gpdvega is a bridge between GeoPandas and Altair that allows to seamlessly chart geospatial data

Overview

gpdvega Coverage Status Build Status HitCount GitHub license GitHub issues

gpdvega is a bridge between GeoPandas a geospatial extension of Pandas and the declarative statistical visualization library Altair, which allows to seamlessly chart geospatial data using altair.

Example

import altair as alt
import geopandas as gpd
import gpdvega

alt.renderers.enable('notebook') # render for Jupyter Notebook

world = gpd.read_file(gpd.datasets.get_path('naturalearth_lowres'))

# GeoDataFrame could be passed as usual pd.DataFrame
alt.Chart(world[world.continent!='Antarctica']).mark_geoshape(
).project(
).encode(
    color='pop_est', # shorthand infer types as for regular pd.DataFrame
    tooltip='id:Q' # GeoDataFrame.index is accessible as id
).properties(
    width=500,
    height=300
)

output

Install

Dependencies

gpdvega requires:

  • Altair (>= 2.2.0 )
  • GeoPandas (>= 0.4.0)

User installation

using pip

pip install gpdvega

Changelog

See the changelog for a history of notable changes to gpdvega

Comments
  • `max_rows=None` doesn't work

    `max_rows=None` doesn't work

    Hello when I try out my own example, I get this error:

    TypeError: Object of type 'Polygon' is not JSON serializable
    

    I first tested the example on your site;

    import altair as alt
    import geopandas as gpd
    import gpdvega
    
    
    world = gpd.read_file(gpd.datasets.get_path('naturalearth_lowres'))
    
    # GeoDataFrame could be passed as usual pd.DataFrame
    alt.Chart(world[world.continent!='Antarctica']).mark_geoshape(
    ).project(
    ).encode(
        color='pop_est', # shorthand infer types as for regular pd.DataFrame
        tooltip='id:Q' # GeoDataFrame.index is accessible as id
    ).properties(
        width=500,
        height=300
    )
    

    That worked great, and the plot showed up in jupyterlab.

    I then tried my own example and got the above error.

    alt.data_transformers.enable('default', max_rows=None)
    ga = gpd.read_file('GA.json')
    alt.Chart(ga).mark_geoshape(
    ).project(
    ).encode(
        color='STATE:O', # shorthand infer types as for regular pd.DataFrame
        tooltip='TRACT:Q' # GeoDataFrame.index is accessible as id
    ).properties(
        width=500,
        height=300
    )
    

    Since this did not work, and the error sayd type 'Polygon', I checked the dtypes on your example and on mine.

    On yours:

    world.dtypes
    

    shows:

    |field|dtype| |---|---| |pop_est | float64| |continent| object| |name | object| |iso_a3 | object| |gdp_md_est| float64| |geometry | object|

    dtype: object

    and on mine:

    ga.dtypes
    

    |field|dtype| |---|---| |GEO_ID | object| |STATE | object| |COUNTY | object| |TRACT | object| |BLKGRP | object| |NAME | object| |LSAD | object| |CENSUSAREA| float64| |geometry | object|

    dtype: object

    So my geometry is of type object just like in your example - any ideas on why/how the error is being produced and how to resolve it?

    Note: If I do:

    %matplotlib inline 
    ga.plot()
    

    Which uses matplot lib - the plot shows up fine.

    The file ga.json is just a state shapefile downloaded from here (2010 Georgia): https://www.census.gov/geo/maps-data/data/cbf/cbf_blkgrp.html and converted go geojson from here: http://mapshaper.org/

    bug question 
    opened by afonit 11
  • fix maxrows error

    fix maxrows error

    The maxrows error will still come with this current configuration. I had to take out alt.limit_rows. After doing that, I can plot large geographic plots.

    opened by afonit 6
  • saving to png gives error: TypeError: Object of type 'Polygon' is not JSON serializable

    saving to png gives error: TypeError: Object of type 'Polygon' is not JSON serializable

    using

    chart.save('something.png')
    

    Gives the below error:

    TypeError: Object of type 'Polygon' is not JSON serializable
    

    What does work:

    1. When you to .to_json() there is not an error and it produces it fine.
    combined_chart.to_json()
    
    1. In jupyterlab at the top right of plots you have the (...) menu where you can tell it to save to a png - and that does work fine.

    What does not work:

    combined_chart.save('something.png')
    

    Here is a reproducible example:

    import altair as alt
    import geopandas as gpd
    import gpdvega
    import pandas as pd
    from shapely.geometry import Point
    from gpdvega import gpd_to_values
    
    
    alt.data_transformers.register(
        'gpd_to_values',
        lambda data: alt.pipe(data, gpd_to_values)
    )
    alt.data_transformers.enable('gpd_to_values')
    
    
    world = gpd.read_file(gpd.datasets.get_path('naturalearth_lowres'))
    
    # GeoDataFrame could be passed as usual pd.DataFrame
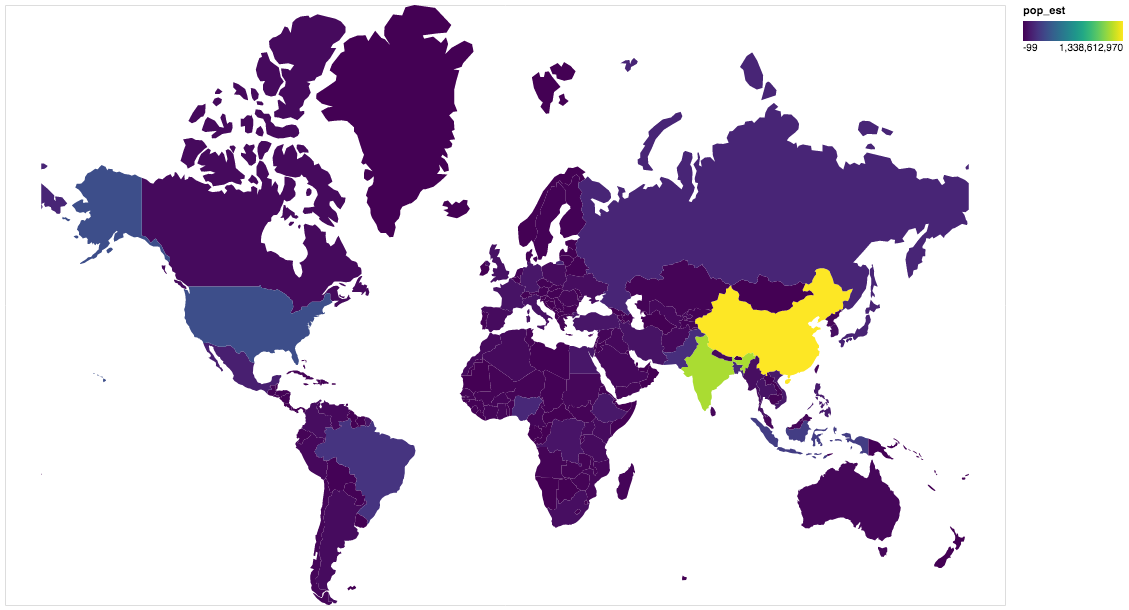
    chart_one = alt.Chart(world[world.continent!='Antarctica']).mark_geoshape(
    ).project(
    ).encode(
        color='pop_est', # shorthand infer types as for regular pd.DataFrame
        tooltip='id:Q' # GeoDataFrame.index is accessible as id
    ).properties(
        width=500,
        height=300
    )
    
    
    # generate some points to push us over the max rows
    some = [[-70.05179, 25.10815] for x in range(6000)]
    
    some = pd.DataFrame(some, columns=['x', 'y'])
    
    some['Coordinates'] = list(zip(some.x, some.y))
    some['Coordinates'] = some['Coordinates'].apply(Point)
    gdfo = gpd.GeoDataFrame(some, geometry='Coordinates')
    chart_two = alt.Chart(gdfo).mark_point(color='red').encode(#.mark_point(size=550, color='orange').encode(
        longitude='x:Q',
        latitude='y:Q'
    )
    
    combined_chart = chart_one + chart_two
    

    To get the error - now run:

    combined_chart.save('something.png')
    

    Looking for ideas as it seems to serialize to json fine with .to_json() but runs into trouble with saving to a png.

    Also of note - is in jupyterlab at the top right of plots you have the (...) menu where you can tell it to save to a png - and that does work fine.

    Here is the full error:

    ---------------------------------------------------------------------------
    TypeError                                 Traceback (most recent call last)
    <ipython-input-5-fe96c4e38374> in <module>()
    ----> 1 combined_chart.save('something.png')
    
    ~\AppData\Local\Continuum\anaconda3\envs\data_analysis\lib\site-packages\altair\vegalite\v2\api.py in save(self, fp, format, override_data_transformer, scale_factor, vegalite_version, vega_version, vegaembed_version, **kwargs)
        500         if override_data_transformer:
        501             with data_transformers.enable('default', max_rows=None):
    --> 502                 result = save(**kwds)
        503         else:
        504             result = save(**kwds)
    
    ~\AppData\Local\Continuum\anaconda3\envs\data_analysis\lib\site-packages\altair\utils\save.py in save(chart, fp, vega_version, vegaembed_version, format, mode, vegalite_version, embed_options, json_kwds, webdriver, scale_factor)
         58                              "['png', 'svg', 'html', 'json']")
         59 
    ---> 60     spec = chart.to_dict()
         61 
         62     if mode is None:
    
    ~\AppData\Local\Continuum\anaconda3\envs\data_analysis\lib\site-packages\altair\vegalite\v2\api.py in to_dict(self, *args, **kwargs)
        406 
        407         try:
    --> 408             dct = super(TopLevelMixin, copy).to_dict(*args, **kwargs)
        409         except jsonschema.ValidationError:
        410             dct = None
    
    ~\AppData\Local\Continuum\anaconda3\envs\data_analysis\lib\site-packages\altair\utils\schemapi.py in to_dict(self, validate, ignore, context)
        243             result = _todict(self._args[0])
        244         elif not self._args:
    --> 245             result = _todict({k: v for k, v in self._kwds.items()
        246                               if k not in ignore})
        247         else:
    
    ~\AppData\Local\Continuum\anaconda3\envs\data_analysis\lib\site-packages\altair\utils\schemapi.py in _todict(val)
        235                 return [_todict(v) for v in val]
        236             elif isinstance(val, dict):
    --> 237                 return {k: _todict(v) for k, v in val.items()
        238                         if v is not Undefined}
        239             else:
    
    ~\AppData\Local\Continuum\anaconda3\envs\data_analysis\lib\site-packages\altair\utils\schemapi.py in <dictcomp>(.0)
        236             elif isinstance(val, dict):
        237                 return {k: _todict(v) for k, v in val.items()
    --> 238                         if v is not Undefined}
        239             else:
        240                 return val
    
    ~\AppData\Local\Continuum\anaconda3\envs\data_analysis\lib\site-packages\altair\utils\schemapi.py in _todict(val)
        233                 return val.to_dict(validate=sub_validate, context=context)
        234             elif isinstance(val, (list, tuple)):
    --> 235                 return [_todict(v) for v in val]
        236             elif isinstance(val, dict):
        237                 return {k: _todict(v) for k, v in val.items()
    
    ~\AppData\Local\Continuum\anaconda3\envs\data_analysis\lib\site-packages\altair\utils\schemapi.py in <listcomp>(.0)
        233                 return val.to_dict(validate=sub_validate, context=context)
        234             elif isinstance(val, (list, tuple)):
    --> 235                 return [_todict(v) for v in val]
        236             elif isinstance(val, dict):
        237                 return {k: _todict(v) for k, v in val.items()
    
    ~\AppData\Local\Continuum\anaconda3\envs\data_analysis\lib\site-packages\altair\utils\schemapi.py in _todict(val)
        231         def _todict(val):
        232             if isinstance(val, SchemaBase):
    --> 233                 return val.to_dict(validate=sub_validate, context=context)
        234             elif isinstance(val, (list, tuple)):
        235                 return [_todict(v) for v in val]
    
    ~\AppData\Local\Continuum\anaconda3\envs\data_analysis\lib\site-packages\altair\vegalite\v2\api.py in to_dict(self, *args, **kwargs)
        396         copy = self.copy()
        397         original_data = getattr(copy, 'data', Undefined)
    --> 398         copy.data = _prepare_data(original_data, context)
        399 
        400         if original_data is not Undefined:
    
    ~\AppData\Local\Continuum\anaconda3\envs\data_analysis\lib\site-packages\altair\vegalite\v2\api.py in _prepare_data(data, context)
         90     # consolidate inline data to top-level datasets
         91     if data_transformers.consolidate_datasets:
    ---> 92         data = _consolidate_data(data, context)
         93 
         94     # if data is still not a recognized type, then return
    
    ~\AppData\Local\Continuum\anaconda3\envs\data_analysis\lib\site-packages\altair\vegalite\v2\api.py in _consolidate_data(data, context)
         57 
         58     if values is not Undefined:
    ---> 59         name = _dataset_name(values)
         60         data = core.NamedData(name=name, **kwds)
         61         context.setdefault('datasets', {})[name] = values
    
    ~\AppData\Local\Continuum\anaconda3\envs\data_analysis\lib\site-packages\altair\vegalite\v2\api.py in _dataset_name(values)
         33     if isinstance(values, core.InlineDataset):
         34         values = values.to_dict()
    ---> 35     values_json = json.dumps(values, sort_keys=True)
         36     hsh = hashlib.md5(values_json.encode()).hexdigest()
         37     return 'data-' + hsh
    
    ~\AppData\Local\Continuum\anaconda3\envs\data_analysis\lib\json\__init__.py in dumps(obj, skipkeys, ensure_ascii, check_circular, allow_nan, cls, indent, separators, default, sort_keys, **kw)
        236         check_circular=check_circular, allow_nan=allow_nan, indent=indent,
        237         separators=separators, default=default, sort_keys=sort_keys,
    --> 238         **kw).encode(obj)
        239 
        240 
    
    ~\AppData\Local\Continuum\anaconda3\envs\data_analysis\lib\json\encoder.py in encode(self, o)
        197         # exceptions aren't as detailed.  The list call should be roughly
        198         # equivalent to the PySequence_Fast that ''.join() would do.
    --> 199         chunks = self.iterencode(o, _one_shot=True)
        200         if not isinstance(chunks, (list, tuple)):
        201             chunks = list(chunks)
    
    ~\AppData\Local\Continuum\anaconda3\envs\data_analysis\lib\json\encoder.py in iterencode(self, o, _one_shot)
        255                 self.key_separator, self.item_separator, self.sort_keys,
        256                 self.skipkeys, _one_shot)
    --> 257         return _iterencode(o, 0)
        258 
        259 def _make_iterencode(markers, _default, _encoder, _indent, _floatstr,
    
    ~\AppData\Local\Continuum\anaconda3\envs\data_analysis\lib\json\encoder.py in default(self, o)
        178         """
        179         raise TypeError("Object of type '%s' is not JSON serializable" %
    --> 180                         o.__class__.__name__)
        181 
        182     def encode(self, o):
    
    TypeError: Object of type 'Polygon' is not JSON serializable
    
    opened by afonit 3
  • Altair producing a deprication warning

    Altair producing a deprication warning

    fyi, Altair is now producing a deprecation warning:

    AltairDeprecationWarning: alt.pipe() is deprecated, and will be removed in a future release. Use toolz.curried.pipe() instead.
    
    opened by afonit 3
  • Unexpected position of 'Oceania'

    Unexpected position of 'Oceania'

    import altair as alt
    import geopandas as gpd
    import gpdvega 
    
    alt.renderers.enable('notebook') # render for Jupyter Notebook
    
    world = gpd.read_file(gpd.datasets.get_path('naturalearth_lowres'))
    
    alt.Chart(world [world.continent=='Oceania']).mark_geoshape(
        stroke='#1f77b4',  
        fill='#7f7f7f',
        fillOpacity=0.3
    
    ).project(
    ).encode( 
    ).properties( 
        width=500,
        height=300
    )
    

    visualization 42

    opened by iliatimofeev 0
  • wrong 'Antarctica'

    wrong 'Antarctica'

    import altair as alt
    import geopandas as gpd
    import gpdvega 
    
    alt.renderers.enable('notebook') # render for Jupyter Notebook
    
    world = gpd.read_file(gpd.datasets.get_path('naturalearth_lowres'))
    
    # GeoDataFrame could be passed as usual pd.DataFrame 
    alt.Chart(world[world.continent=='Antarctica']).mark_geoshape(
        stroke='#1f77b4',  
        fill='#7f7f7f',
        fillOpacity=0.3
    ).project(
    ).encode( 
    ).properties( 
        width=500,
        height=300
    )
    

    visualization 39 but

    world[world.continent=='Antarctica'].plot()
    

    image

    vega geopandas 
    opened by iliatimofeev 1
Implementation of Trajectory classes and functions built on top of GeoPandas

MovingPandas MovingPandas implements a Trajectory class and corresponding methods based on GeoPandas. Visit movingpandas.org for details! You can run

Anita Graser 897 Jan 1, 2023
Interactive Maps with Geopandas

Create Interactive maps ??️ with your geodataframe Geopatra extends geopandas for interactive mapping and attempts to wrap the goodness of amazing map

sangarshanan 46 Aug 16, 2022
Example of animated maps in matplotlib + geopandas using entire time series of congressional district maps from UCLA archive. rendered, interactive version below

Example of animated maps in matplotlib + geopandas using entire time series of congressional district maps from UCLA archive. rendered, interactive version below

Apoorva Lal 5 May 18, 2022
GeoNode is an open source platform that facilitates the creation, sharing, and collaborative use of geospatial data.

Table of Contents What is GeoNode? Try out GeoNode Install Learn GeoNode Development Contributing Roadmap Showcase Most useful links Licensing What is

GeoNode Development Team 1.2k Dec 26, 2022
Minimum Bounding Box of Geospatial data

BBOX Problem definition: The spatial data users often are required to obtain the coordinates of the minimum bounding box of vector and raster data in

Ali Khosravi Kazazi 1 Sep 8, 2022
The geospatial toolkit for redistricting data.

maup maup is the geospatial toolkit for redistricting data. The package streamlines the basic workflows that arise when working with blocks, precincts

Metric Geometry and Gerrymandering Group 60 Dec 5, 2022
A part of HyRiver software stack for handling geospatial data manipulations

Package Description Status PyNHD Navigate and subset NHDPlus (MR and HR) using web services Py3DEP Access topographic data through National Map's 3DEP

Taher Chegini 5 Dec 14, 2022
Enable geospatial data mining through Google Earth Engine in Grasshopper 3D, via its most recent Hops component.

AALU_Geo Mining This repository is produced for a masterclass at the Architectural Association Landscape Urbanism programme. Requirements Rhinoceros (

null 4 Nov 16, 2022
Specification for storing geospatial vector data (point, line, polygon) in Parquet

GeoParquet About This repository defines how to store geospatial vector data (point, lines, polygons) in Apache Parquet, a popular columnar storage fo

Open Geospatial Consortium 449 Dec 27, 2022
Rasterio reads and writes geospatial raster datasets

Rasterio Rasterio reads and writes geospatial raster data. Geographic information systems use GeoTIFF and other formats to organize and store gridded,

Mapbox 1.9k Jan 7, 2023
leafmap - A Python package for geospatial analysis and interactive mapping in a Jupyter environment.

A Python package for geospatial analysis and interactive mapping with minimal coding in a Jupyter environment

Qiusheng Wu 1.4k Jan 2, 2023
WebGL2 powered geospatial visualization layers

deck.gl | Website WebGL2-powered, highly performant large-scale data visualization deck.gl is designed to simplify high-performance, WebGL-based visua

Vis.gl 10.5k Jan 8, 2023
Summary statistics of geospatial raster datasets based on vector geometries.

rasterstats rasterstats is a Python module for summarizing geospatial raster datasets based on vector geometries. It includes functions for zonal stat

Matthew Perry 437 Dec 23, 2022
Geospatial Image Processing for Python

GIPPY Gippy is a Python library for image processing of geospatial raster data. The core of the library is implemented as a C++ library, libgip, with

GIPIT 83 Aug 19, 2022
🌐 Local tile server for viewing geospatial raster files with ipyleaflet

?? Local Tile Server for Geospatial Rasters Need to visualize a rather large raster (gigabytes) you have locally? This is for you. A Flask application

Bane Sullivan 192 Jan 4, 2023
h3-js provides a JavaScript version of H3, a hexagon-based geospatial indexing system.

h3-js The h3-js library provides a pure-JavaScript version of the H3 Core Library, a hexagon-based geographic grid system. It can be used either in No

Uber Open Source 648 Jan 7, 2023
🌐 Local tile server for viewing geospatial raster files with ipyleaflet or folium

?? Local Tile Server for Geospatial Rasters Need to visualize a rather large (gigabytes) raster you have locally? This is for you. A Flask application

Bane Sullivan 192 Jan 4, 2023
A Jupyter - Leaflet.js bridge

ipyleaflet A Jupyter / Leaflet bridge enabling interactive maps in the Jupyter notebook. Usage Selecting a basemap for a leaflet map: Loading a geojso

Jupyter Widgets 1.3k Dec 27, 2022
Script that allows to download data with satellite's orbit height and create CSV with their change in time.

Satellite orbit height ◾ Requirements Python >= 3.8 Packages listen in reuirements.txt (run pip install -r requirements.txt) Account on Space Track ◾

Alicja Musiał 2 Jan 17, 2022