Code2flow generates call graphs for dynamic programming language. Code2flow supports Python, Javascript, Ruby, and PHP.

Overview

code2flow logo

Version 2.2.0 Build passing Coverage 100% License MIT

Code2flow generates call graphs for dynamic programming language. Code2flow supports Python, Javascript, Ruby, and PHP.

The basic algorithm is simple:

  1. Translate your source files into ASTs.
  2. Find all function definitions.
  3. Determine where those functions are called.
  4. Connect the dots.

Code2flow is useful for:

  • Untangling spaghetti code.
  • Identifying orphaned functions.
  • Getting new developers up to speed.

Code2flow will provide a pretty good estimate of your project's structure. No algorithm can generate a perfect call graph for a dynamic language - even less so if that language is duck-typed. See the known limitations in the section below.

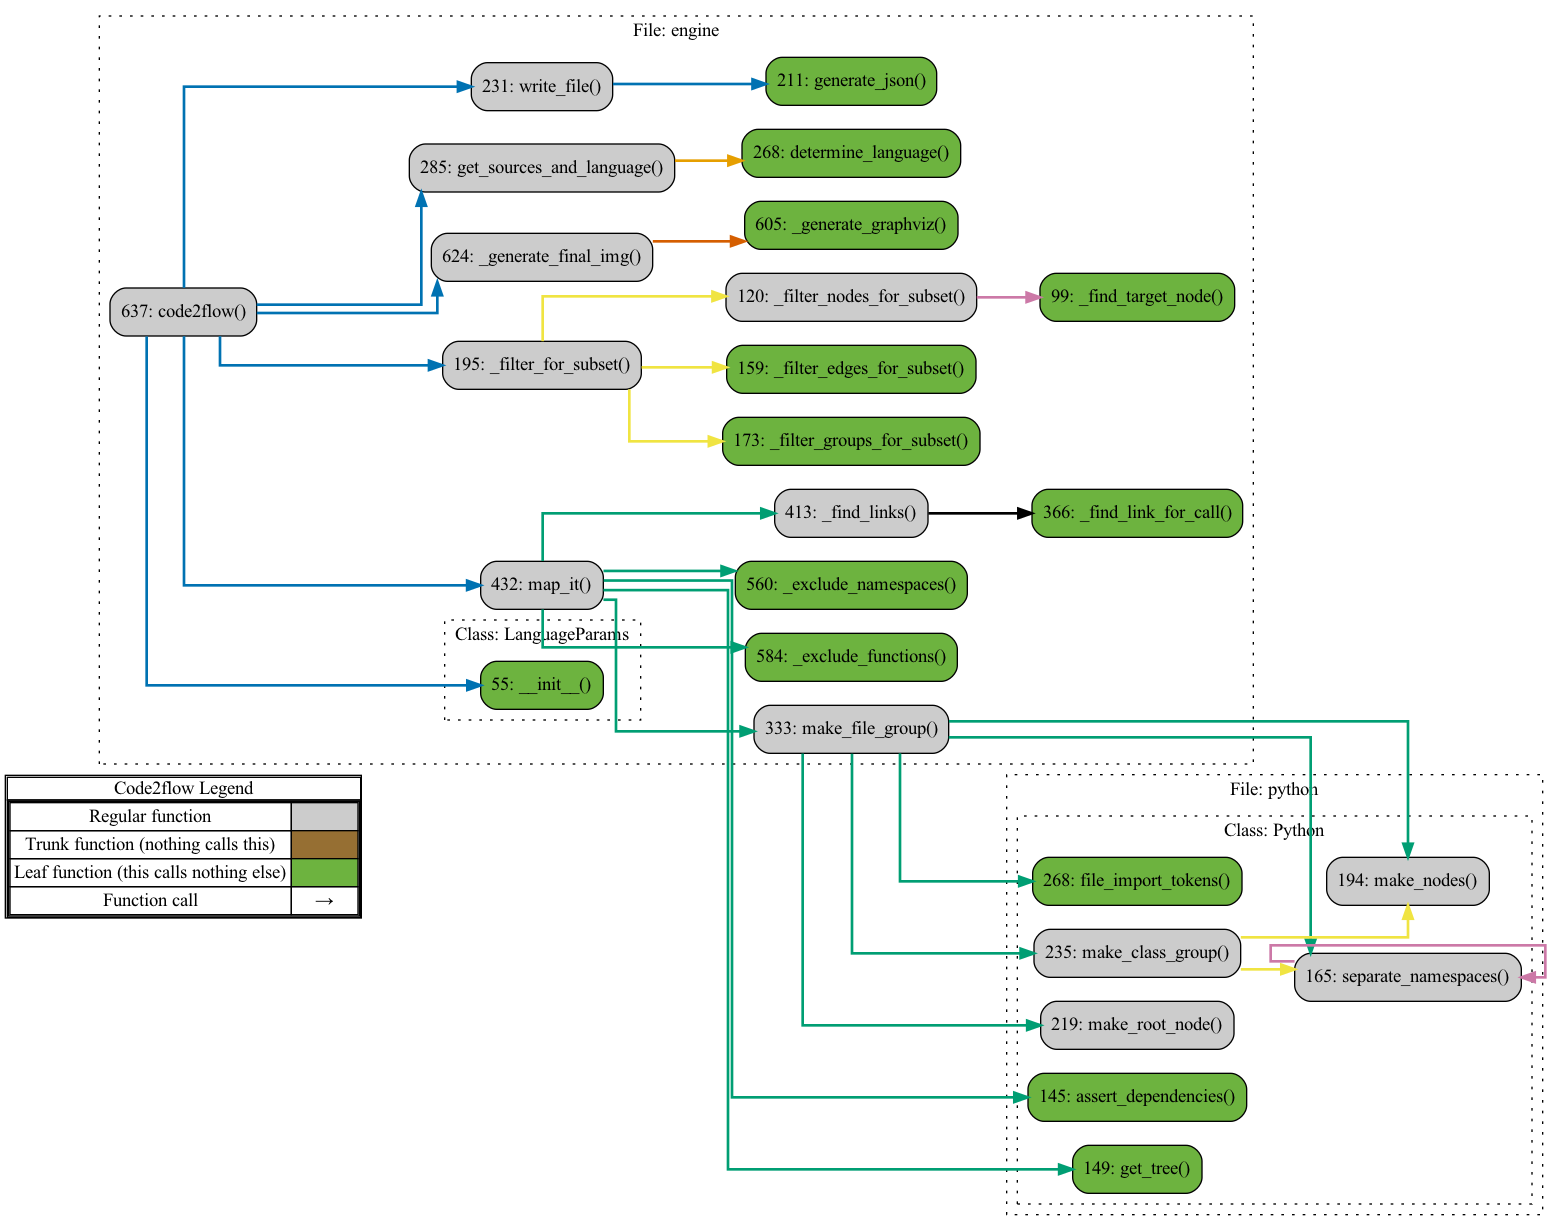
(Below: Code2flow running on itself (excl javascript, PHP, & Ruby for clarity))

code2flow running against itself

Installation

pip3 install code2flow

If you don't have it already, you will also need to install graphviz. Installation instructions can be found here.

Usage

To generate a DOT file run something like:

code2flow mypythonfile.py

Or, for javascript:

code2flow myjavascriptfile.js

You can also specify multiple files or import directories:

code2flow project/directory/source_a.js project/directory/source_b.js
code2flow project/directory/*.js
code2flow project/directory --language js

There are a ton of command line options, to see them all, run:

code2flow --help

How code2flow works

Code2flow approximates the structure of projects in dynamic languages. It is not possible to generate a perfect callgraph for a dynamic language.

Detailed algorithm:

  1. Generate an AST of the source code
  2. Recursively separate groups and nodes. Groups are files, modules, or classes. More precisely, groups are namespaces where functions live. Nodes are the functions themselves.
  3. For all nodes, identify function calls in those nodes.
  4. For all nodes, identify in-scope variables. Attempt to connect those variables to specific nodes and groups. This is where there is some ambiguity in the algorithm because it is possible to know the types of variables in dynamic languages. So, instead, heuristics must be used.
  5. For all calls in all nodes, attempt to find a match from the in-scope variables. This will be an edge.
  6. If a definitive match from in-scope variables cannot be found, attempt to find a single match from all other groups and nodes.
  7. Trim orphaned nodes and groups.
  8. Output results.

Why is it impossible to generate a perfect call graph?

Consider this toy example in Python

def func_factory(param):
    if param < .5:
        return func_a
    else:
        return func_b

func = func_factory(important_variable)
func()

We have no way of knowing whether func will point to func_a or func_b until runtime. In practice, ambiguity like this is common and is present in most non-trivial applications.

Known limitations

Code2flow is internally powered by ASTs. Most limitations stem from a token not being named what code2flow expects it to be named.

  • All functions without definitions are skipped. This most often happens when a file is not included.
  • Functions with identical names in different namespaces are (loudly) skipped. E.g. If you have two classes with identically named methods, code2flow cannot distinguish between these and skips them.
  • Imported functions from outside of your project directory (including from standard libraries) which share names with your defined functions may not be handled correctly. Instead when you call the imported function, code2flow will link to your local functions. E.g. if you have a function "search()" and call, "import searcher; searcher.search()", code2flow may link (incorrectly) to your defined function.
  • Anonymous or generated functions are skipped. This includes lambdas and factories.
  • If a function is renamed, either explicitly or by being passed around as a parameter, it will be skipped.

How to contribute

  1. Open an issue: Code2flow is not perfect and there is a lot that can be improved. If you find a problem parsing your source that you can identify with a simplified example, please open an issue.
  2. Create a PR: Even better, if you have a fix for the issue you identified that passes unit tests, please open a PR.
  3. Add a language: While dense, each language implementation is between 250-400 lines of code including comments. If you want to implement another language, the existing implementations can be your guide.

License

Code2flow is licensed under the MIT license. Prior to the rewrite in April 2021, code2flow was licensed under LGPL. The last commit under that license was 24b2cb854c6a872ba6e17409fbddb6659bf64d4c. The April 2021 rewrite was substantial so it's probably reasonable to treat code2flow as completely MIT-licensed.

Acknowledgements

  • In mid-2021, Code2flow was rewritten and two new languages were added. This was prompted and financially supported by the Sider Corporation.
  • The code2flow pip name was graciouly transferred to this project from Dheeraj Nair. He was using it for his own (unrelated) code2flow project.
  • Many others have contributed through bug fixes, cleanups, and identifying issues. Thank you!!!

Unrelated projects

The name, "code2flow", has been used for several unrelated projects. Specifically, the domain, code2flow.com, has no association with this project. I've never heard anything from them and it doesn't appear like they use anything from here.

Feedback / Contact

Please do email! [email protected]

Feature Requests

Email me. At any time, I'm spread thin across a lot of projects so I will, unfortunately, turn down most requests. However, I am open to paid development for compelling features.

Comments
  • UnicodeDecodeError: 'charmap' codec can't decode byte 0x8f in position 4895: character maps to <undefined>

    UnicodeDecodeError: 'charmap' codec can't decode byte 0x8f in position 4895: character maps to

    C:\Users\sterg\Documents\GitHub\sparks-baird\CrabNet\crabnet>code2flow model.py
    Code2Flow: Found 1 files from sources argument.
    Code2Flow: Implicitly detected language as 'py'.
    Code2Flow: Processing 1 source file(s).
    Code2Flow:   model.py
    Traceback (most recent call last):
      File "C:\Users\sterg\AppData\Local\Programs\Python\Python39\Scripts\code2flow-script.py", line 33, in <module>
        sys.exit(load_entry_point('code2flow==2.2.0', 'console_scripts', 'code2flow')())
      File "c:\users\sterg\appdata\local\programs\python\python39\lib\site-packages\code2flow\engine.py", line 625, in main
        code2flow(
      File "c:\users\sterg\appdata\local\programs\python\python39\lib\site-packages\code2flow\engine.py", line 531, in code2flow
        file_groups, all_nodes, edges = map_it(sources, language, no_trimming,
      File "c:\users\sterg\appdata\local\programs\python\python39\lib\site-packages\code2flow\engine.py", line 317, in map_it
        raise ex
      File "c:\users\sterg\appdata\local\programs\python\python39\lib\site-packages\code2flow\engine.py", line 312, in map_it
        file_ast_trees.append((source, language.get_tree(source, lang_params)))
      File "c:\users\sterg\appdata\local\programs\python\python39\lib\site-packages\code2flow\python.py", line 155, in get_tree
        tree = ast.parse(f.read())
      File "c:\users\sterg\appdata\local\programs\python\python39\lib\encodings\cp1252.py", line 23, in decode
        return codecs.charmap_decode(input,self.errors,decoding_table)[0]
    UnicodeDecodeError: 'charmap' codec can't decode byte 0x8f in position 4895: character maps to <undefined>
    
    opened by sgbaird 9
  • Request: Output all call sites which refer to a given function

    Request: Output all call sites which refer to a given function

    Scenario: I have a method (ruby) defined in a model somewhere. I'd like to identify all call sites which call this method and call sites that refer to those call sites up to some given limit. This sounds like a subset of the graph which is generated.

    opened by jasiek 8
  • Code2flow installs improperly, is added to PATH, and opens

    Code2flow installs improperly, is added to PATH, and opens "How do you want to open this file?" menu

    Following the instructions in the README, using python install setup.py, code2flow is added to PATH, but when trying to run, whether with a file or by itself, it instead opens a "How do you want to open this file?" menu.

    If you select a text editor it will bring up this:

    #!"C:\Users\[User]\AppData\Local\Programs\Python\Python39\python.exe"
    # EASY-INSTALL-SCRIPT: 'code2flow==2.0.1','code2flow'
    __requires__ = 'code2flow==2.0.1'
    __import__('pkg_resources').run_script('code2flow==2.0.1', 'code2flow')
    

    Uninstalling and reinstalling it does nothing.

    Using Python 3.9.1 on Windows 10.

    opened by Shidouuu 8
  • [Feature request] Graphing jQuery calls

    [Feature request] Graphing jQuery calls

    This might be a tough feature, yet it would be exceptionally useful if available. jQuery calls start with a dollar sign, or with (jQuery) with the parenthesis if used in non-conflict mode (iirc). That's where a lot of drawing is done.

    I could give it a shot when I find some time.

    opened by ChristopherRabotin 7
  • Request for PHP support

    Request for PHP support

    From my experience I have seen the messiest code written in PHP. Hence I'd like to see support for PHP.

    What do you think is required to implement a new language in code2flow?

    opened by klaernie 6
  • Thoughts on making JS prototypes work

    Thoughts on making JS prototypes work

    It'd be nice if prototypes worked correctly. But there's the question of how they'd be represented on the graph.

    Just to think out loud, this would possibly require code2flow to be able to differentiate between object methods (e.g. toString) and normal functions. This would then allow the graph to represent which object method is being called (e.g. if a class overrode the Object.toString method, that could be represented.

    One thing I'm curious about is your decision to 'home-grow' the regular expressions etc - have you deliberately decided not to use existing tools (say uglifyjs) to generate an AST and work from there? On a related note, have you seen https://github.com/abort/javascript-call-graph?

    Just pondering on the most appropriate tool for the job at the moment.

    opened by aidanhs 6
  • Re exception: bogus escape: '\\2' (Javascript)

    Re exception: bogus escape: '\\2' (Javascript)

    Input file is called "main.js" (so nothing spectacular).

    Here's the traceback (I tried to correct the output from Powershell):

    PS C:\Users\xxx> ..\..\Python\2.7\python.exe .\Apps\code2flow-master\code2fl
    ow .\Apps\code2flow-master\2graph\main.js
    Mapping .\Apps\code2flow-master\2graph\main
    Removing comments and strings...
    Generating function nodes...
    Traceback (most recent call last):
      File ".\Apps\code2flow-master\code2flow", line 151, in <module>
        groups,nodes,edges = mapper.map()
      File "C:\Users\xxx\Apps\code2flow-master\code2flowlib\engine.py", line 814, in map
        fileGroup = self.generateFileGroup(name=filename,source=source)
      File "C:\Users\xxx\Apps\code2flow-master\code2flowlib\languages\javascript.py", line 329, in generateFileGroup
        return Group(name=name,source=source,fullSource=source,isFunction=True)
      File "C:\Users\xxx\Apps\code2flow-master\code2flowlib\languages\javascript.py", line 79, in __init__
        super(Group,self).__init__(**kwargs)
      File "C:\Users\xxx\Apps\code2flow-master\code2flowlib\engine.py", line 215, in __init__
        self.newObjectPattern = self.generateNewObjectPattern()
      File "C:\Users\xxx\Apps\code2flow-master\code2flowlib\languages\javascript.py", line 170, in generateNewObjectPattern
        return re.compile(r'new\s+%s\s*\('%self.name)
      File "C:\Python\2.7\lib\re.py", line 190, in compile
        return _compile(pattern, flags)
      File "C:\Python\2.7\lib\re.py", line 244, in _compile
        raise error, v # invalid expression
    sre_constants.error: bogus escape: '\\2'
    
    
    opened by ChristopherRabotin 6
  • [Feature Request] A select Namespace argument

    [Feature Request] A select Namespace argument

    Currently, in my project, I just care about how a couple of classes interact with each other. Using code2flow has been an amazing way to see just how they are connected and show it to others. The issue is I've had to write a script that gets every other namespace to ignore with the exceptions of the ones I want. The ability to say, I want a graph with just these classes would be amazing.

    opened by GameDungeon 5
  • Python: Implicit decorator calls breaks `process_assign` with AssertionError

    Python: Implicit decorator calls breaks `process_assign` with AssertionError

    Sample code

    from typing import Callable
    
    def trace(fn: Callable) -> Callable:
        def wrapper(*args, **kwargs):
            print('traced call')
            return fn(*args, **kwargs)
        return wrapper
    
    def do_something(msg):
        return msg + ' world'
    
    message = 'hello'
    new_message = trace(do_something)(message)
    

    when fed into code2flow would produce an AssertionError

    File "%/bin/code2flow", line 33, in <module>
    sys.exit(load_entry_point('code2flow', 'console_scripts', 'code2flow')())
    File "%/code2flow/engine.py", line 630, in main
    code2flow(
    File "%/code2flow/engine.py", line 536, in code2flow
    file_groups, all_nodes, edges = map_it(sources, language, no_trimming,
    File "%/code2flow/engine.py", line 324, in map_it
    file_group = make_file_group(file_ast_tree, source, extension)
    File "%/code2flow/engine.py", line 208, in make_file_group
    file_group.add_node(language.make_root_node(body_trees, parent=file_group), is_root=True)
    File "%/code2flow/python.py", line 229, in make_root_node
    variables = make_local_variables(lines, parent)
    File "%/code2flow/python.py", line 120, in make_local_variables
    variables += process_assign(element)
    File "%/code2flow/python.py", line 79, in process_assign
    ret.append(Variable(token, call, element.lineno))
    File "%/code2flow/model.py", line 159, in __init__
    assert points_to
    
    opened by sudodoki 5
  • Request: New Shape

    Request: New Shape

    As per Russian standard for block-schemes, there is a shape for functions/methods defined elsewhere. It looks like this in plain style: изображение

    I'll try to take a look at the code on my free time, but will promise nothing

    opened by VlaDexa 5
  • Performance

    Performance

    I am running this on a ~1.2mb 38kloc browserified source file, and it's been running for > 10 mins at 100% cpu on a core i7. no disk output, and no output from strace so it appears internally cpu bound. a note of advisement as to the applicability to project size would probably be helpful.

    Update: Traceback when I Ctrl-C it is:

    Traceback (most recent call last):
      File "/home/user/.pyenv/versions/2.7.9/bin/code2flow", line 4, in <module>
        __import__('pkg_resources').run_script('code2flow==0.2', 'code2flow')
      File "build/bdist.linux-x86_64/egg/pkg_resources/__init__.py", line 723, in run_script
      File "build/bdist.linux-x86_64/egg/pkg_resources/__init__.py", line 1643, in run_script
      File "/home/user/.pyenv/versions/2.7.9/lib/python2.7/site-packages/code2flow-0.2-py2.7.egg/EGG-INFO/scripts/code2flow", line 151, in <module>
    
      File "build/bdist.linux-x86_64/egg/code2flowlib/engine.py", line 810, in map
      File "build/bdist.linux-x86_64/egg/code2flowlib/engine.py", line 369, in __init__
      File "build/bdist.linux-x86_64/egg/code2flowlib/engine.py", line 721, in _removeCommentsAndStrings
    

    Update 2: the original source file had (believe it or not) >2mb of sourceMap (a single massive line) appended to it. Once I removed it, code2flow did complete after several minutes, so perhaps there is a pathological case in extremely long comment.

    opened by ahamid 4
  • Request: distinguish functions with the same name but in different files

    Request: distinguish functions with the same name but in different files

    Hello! I tried to use code2flow on some python projects, And found it cannot distinguish files with the same name but in different directories, or functions with the same name but in different files. Also it becomes a mess if the two cases happen in the same time.

    I also looked into the source code. The first problem can be fixed by changing line 348 in engine.py to include the full path into group name. But the second one seems much more difficult. I guess what you get from an ast Call node is only the function name, not enough to tell which function it is if there are more than one function with the same name in the project. But maybe we can use import statement to do this. But to do this, we need to relate the module name in import statement with the corresponding file full path.

    Maybe you can check this problem and see if there's another solution? I think this is not a rare case so a solution is needed.

    opened by Darkbblue 3
  • Request: Allow depth/downstream-depth without `--target-function`

    Request: Allow depth/downstream-depth without `--target-function`

    I'm trying to use code2flow on a very large codebase and the resulting out.png file keeps getting scaled to the point where it is unreadable.

    I would like to be able to set a graph depth without having to pick a particular function.

    code2flow my_package --downstream-depth 3
    

    Or maybe just a generic --depth.

    Scaled out.png file

    image

    ~I realize there's probably a way to get dot/graphwhiz to reduce the scaling, but I haven't figured that out yet.~ Also I only really care about the first few nodes in the graph.

    Edit: changing the output type to .svg solved the issue with low res .png files. But I still think being able to set a depth without specifying a target function would be a good feature.

    Very cool project BTW.

    opened by Kilo59 2
Owner
Scott Rogowski
Author of Mongita, Code2Flow, and the FFER. Working on Fastmap - looking for cofounders.
Scott Rogowski
AryaBota: An app to teach Python coding via gradual programming and visual output

AryaBota An app to teach Python coding, that gradually allows students to transition from using commands similar to natural language, to more Pythonic

null 5 Feb 8, 2022
The official code of LM-Debugger, an interactive tool for inspection and intervention in transformer-based language models.

LM-Debugger is an open-source interactive tool for inspection and intervention in transformer-based language models. This repository includes the code

Mor Geva 110 Dec 28, 2022
Debugger capable of attaching to and injecting code into python processes.

DISCLAIMER: This is not an official google project, this is just something I wrote while at Google. Pyringe What this is Pyringe is a python debugger

Google 1.6k Dec 15, 2022
🔥 Pyflame: A Ptracing Profiler For Python. This project is deprecated and not maintained.

Pyflame: A Ptracing Profiler For Python (This project is deprecated and not maintained.) Pyflame is a high performance profiling tool that generates f

Uber Archive 3k Jan 7, 2023
Parsing ELF and DWARF in Python

pyelftools pyelftools is a pure-Python library for parsing and analyzing ELF files and DWARF debugging information. See the User's guide for more deta

Eli Bendersky 1.6k Jan 4, 2023
Python's missing debug print command and other development tools.

python devtools Python's missing debug print command and other development tools. For more information, see documentation. Install Just pip install de

Samuel Colvin 637 Jan 2, 2023
VizTracer is a low-overhead logging/debugging/profiling tool that can trace and visualize your python code execution.

VizTracer is a low-overhead logging/debugging/profiling tool that can trace and visualize your python code execution.

null 2.8k Jan 8, 2023
A package containing a lot of useful utilities for Python developing and debugging.

Vpack A package containing a lot of useful utilities for Python developing and debugging. Features Sigview: press Ctrl+C to print the current stack in

volltin 16 Aug 18, 2022
Arghonaut is an interactive interpreter, visualizer, and debugger for Argh! and Aargh!

Arghonaut Arghonaut is an interactive interpreter, visualizer, and debugger for Argh! and Aargh!, which are Befunge-like esoteric programming language

Aaron Friesen 2 Dec 10, 2021
pdb++, a drop-in replacement for pdb (the Python debugger)

pdb++, a drop-in replacement for pdb What is it? This module is an extension of the pdb module of the standard library. It is meant to be fully compat

null 1k Dec 24, 2022
Full-screen console debugger for Python

PuDB: a console-based visual debugger for Python Its goal is to provide all the niceties of modern GUI-based debuggers in a more lightweight and keybo

Andreas Klöckner 2.6k Jan 1, 2023
Trace any Python program, anywhere!

lptrace lptrace is strace for Python programs. It lets you see in real-time what functions a Python program is running. It's particularly useful to de

Karim Hamidou 687 Nov 20, 2022
Debugging manhole for python applications.

Overview docs tests package Manhole is in-process service that will accept unix domain socket connections and present the stacktraces for all threads

Ionel Cristian Mărieș 332 Dec 7, 2022
(OLD REPO) Line-by-line profiling for Python - Current repo ->

line_profiler and kernprof line_profiler is a module for doing line-by-line profiling of functions. kernprof is a convenient script for running either

Robert Kern 3.6k Jan 6, 2023
Monitor Memory usage of Python code

Memory Profiler This is a python module for monitoring memory consumption of a process as well as line-by-line analysis of memory consumption for pyth

Fabian Pedregosa 80 Nov 18, 2022
Sampling profiler for Python programs

py-spy: Sampling profiler for Python programs py-spy is a sampling profiler for Python programs. It lets you visualize what your Python program is spe

Ben Frederickson 9.5k Jan 8, 2023
Visual profiler for Python

vprof vprof is a Python package providing rich and interactive visualizations for various Python program characteristics such as running time and memo

Nick Volynets 3.9k Jan 1, 2023
pdb++, a drop-in replacement for pdb (the Python debugger)

pdb++, a drop-in replacement for pdb What is it? This module is an extension of the pdb module of the standard library. It is meant to be fully compat

null 1k Jan 2, 2023
Run-time type checker for Python

This library provides run-time type checking for functions defined with PEP 484 argument (and return) type annotations. Four principal ways to do type

Alex Grönholm 1.1k Jan 5, 2023