Live training loss plot in Jupyter Notebook for Keras, PyTorch and others

Overview

livelossplot

livelossplot version - PyPI PyPI status MIT license - PyPI Python version - PyPI GitHub Workflow Status Downloads Twitter @pmigdal

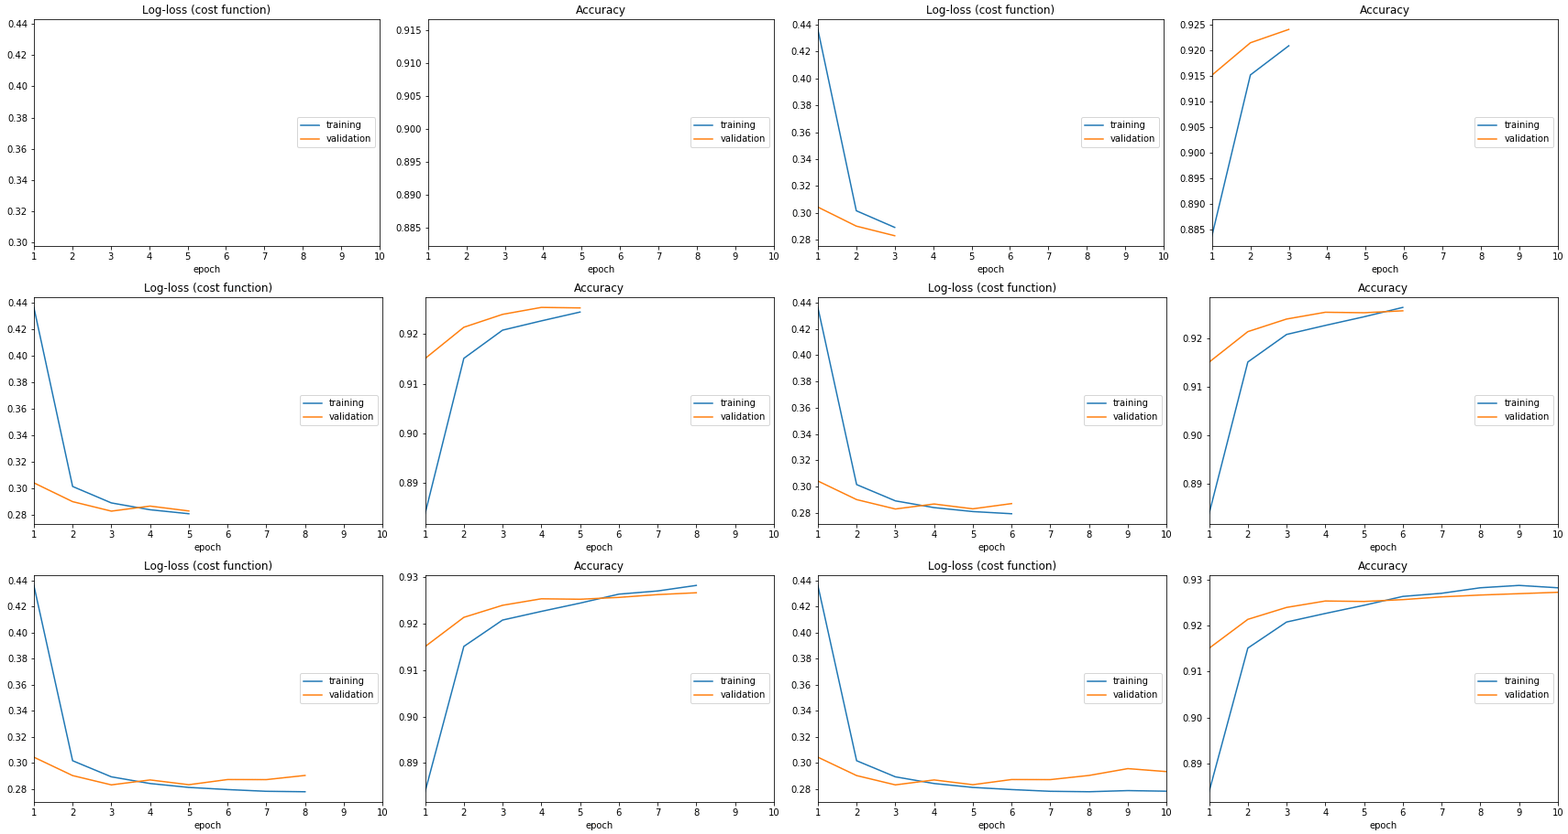
Don't train deep learning models blindfolded! Be impatient and look at each epoch of your training!

(RECENT CHANGES, EXAMPLES IN COLAB, API LOOKUP, CODE)

A live training loss plot in Jupyter Notebook for Keras, PyTorch and other frameworks. An open-source Python package by Piotr Migdał, Bartłomiej Olechno and others. Open for collaboration! (Some tasks are as simple as writing code docstrings, so - no excuses! :))

from livelossplot import PlotLossesKeras

model.fit(X_train, Y_train,
          epochs=10,
          validation_data=(X_test, Y_test),
          callbacks=[PlotLossesKeras()],
          verbose=0)

Animated fig for livelossplot tracking log-loss and accuracy

  • (The most FA)Q: Why not TensorBoard?
  • A: Jupyter Notebook compatibility (for exploration and teaching). The simplicity of use.

Installation

To install this version from PyPI, type:

pip install livelossplot

To get the newest one from this repo (note that we are in the alpha stage, so there may be frequent updates), type:

pip install git+git://github.com/stared/livelossplot.git

Examples

Look at notebook files with full working examples:

You run examples in Colab.

Overview

Text logs are easy, but it's easy to miss the most crucial information: is it learning, doing nothing or overfitting? Visual feedback allows us to keep track of the training process. Now there is one for Jupyter.

If you want to get serious - use TensorBoard, . But what if you just want to train a small model in Jupyter Notebook? Here is a way to do so, using livelossplot as a plug&play component

from livelossplot import ...

PlotLosses for a generic API.

plotlosses = PlotLosses()
plotlosses.update({'acc': 0.7, 'val_acc': 0.4, 'loss': 0.9, 'val_loss': 1.1})
plot.send()  # draw, update logs, etc

There are callbacks for common libraries and frameworks: PlotLossesKeras, PlotLossesKerasTF, PlotLossesPoutyne, PlotLossesIgnite.

Feel invited to write, and contribute, your adapter. If you want to use a bare logger, there is MainLogger.

from livelossplot.outputs import ...

Plots: MatplotlibPlot, BokehPlot.

Loggers: ExtremaPrinter (to standard output), TensorboardLogger, TensorboardTFLogger, NeptuneLogger.

To use them, initialize PlotLosses with some outputs:

plotlosses = PlotLosses(outputs=[MatplotlibPlot(), TensorboardLogger()])

There are custom matplotlib plots in livelossplot.outputs.matplotlib_subplots you can pass in MatplotlibPlot arguments.

If you like to plot with Bokeh instead of matplotlib, use

plotlosses = PlotLosses(outputs=[BokehPlot()])

Sponsors

This project supported by Jacek Migdał, Marek Cichy, Casper da Costa-Luis, and Piotr Zientara. Join the sponsors - show your ❤️ and support, and appear on the list! It will give me time and energy to work on this project.

This project is also supported by a European program Program Operacyjny Inteligentny Rozwój for GearShift - building the engine of behavior of wheeled motor vehicles and map’s generation based on artificial intelligence algorithms implemented on the Unreal Engine platform lead by ECC Games (NCBR grant GameINN).

Trivia

It started as this gist. Since it went popular, I decided to rewrite it as a package.

Oh, and I am in general interested in data vis, see Simple diagrams of convoluted neural networks (and overview of deep learning architecture diagrams):

A good diagram is worth a thousand equations — let’s create more of these!

...or my other data vis projects.

Todo

If you want more functionality - open an Issue or even better - prepare a Pull Request.

Comments
  • Modularization: a serious rewrite

    Modularization: a serious rewrite

    The goal is version 0.5.0:

    • extendable input plugins (kind of right now)
    • extendable output plugins
    • type hints (Python 3.5+)
    • tests

    Some things won't be backward compatible.

    A project with @bartolo1024. So far this branch does not work - work in progress.

    To do:

    • [x] write MainLogger
    • [x] write PlotLoss
    • [x] adapt matplotlib plugin (a big thing...)
    • [x] adapt extrema printing
    • [x] adapt input callbacks
    • [x] adapt TensorBoard plugin
    • [x] adapt Neptune plugin
    • [x] write tests
    • [x] write GitHub actions
    • [x] update Jupyter examples (and add Colab links)
    opened by stared 14
  • LiveLossPlot:  ModuleNotFoundError: No module named 'neptune'

    LiveLossPlot: ModuleNotFoundError: No module named 'neptune'

    from livelossplot.keras import PlotLossesCallback callbacks_list = [PlotLossesCallback()]


    ModuleNotFoundError Traceback (most recent call last) in 4 checkpoint = ModelCheckpoint("C:\home\jupyter\experiments\models", 5 monitor='acc', verbose=1, save_best_only=True, mode='max') ----> 6 callbacks_list = [checkpoint, PlotLossesCallback()]

    ~\AppData\Local\conda\conda\envs\tesseract\lib\site-packages\livelossplot\keras.py in init(self, **kwargs) 7 def init(self, **kwargs): 8 keras.callbacks.Callback.init(self) ----> 9 _PlotLossesCallback.init(self, **kwargs)

    ~\AppData\Local\conda\conda\envs\tesseract\lib\site-packages\livelossplot\generic_keras.py in init(self, **kwargs) 26 class _PlotLossesCallback(): 27 def init(self, **kwargs): ---> 28 self.liveplot = PlotLosses(**kwargs) 29 30 def on_train_begin(self, logs={}):

    ~\AppData\Local\conda\conda\envs\tesseract\lib\site-packages\livelossplot\generic_plot.py in init(self, figsize, cell_size, dynamic_x_axis, max_cols, max_epoch, metric2title, series_fmt, validation_fmt, plot_extrema, fig_path, target) 37 self.plot_extrema = plot_extrema 38 self.target = target ---> 39 from .neptune_integration import neptune_send_plot 40 self.fig_path = fig_path 41

    ~\AppData\Local\conda\conda\envs\tesseract\lib\site-packages\livelossplot\neptune_integration.py in ----> 1 import neptune 2 3 ctx = neptune.Context() 4 5

    ModuleNotFoundError: No module named 'neptune'

    opened by bobloki 13
  • PlotLossesKeras not working due to TypeError

    PlotLossesKeras not working due to TypeError

    For Keras version 2.1.3 the PlotLossesKeras crashes due to error in line 33 of keras_plot.py

    Reason for this is: self.metric2printable['loss'] = self.metric2printable.get(self.model.loss, self.model.loss) + " (cost function)" where this breaks due to self.model.loss being a keras function. This results in

    TypeError: unsupported operand type(s) for +: 'function' and 'str'

    opened by fculinovic 13
  • PlotLossesKeras has an issue with 'lr'

    PlotLossesKeras has an issue with 'lr'

    I'm training a CNN model and I wanted to both a) be able to reduce the optimizer learning rate when it hits a plateau with ReduceLROnPlateau() and b) visually monitor the losses with livelossplot's PlotKerasLosses(). This combination in callbacks gives me a KeyError: 'lr'. When dropping either one of the functions the training works as it should. Hence my guess is that there must be a compatibility issue with the two.

    Keras = 2.2.4 livelossplot = 0.3.4

    Here's some code:

    from keras.callbacks import ReduceLROnPlateau
    from livelossplot import PlotLossesKeras
    
    ...
    
    learning_rate_reduction = ReduceLROnPlateau(monitor='val_acc', 
                                                patience=3, 
                                                verbose=1, 
                                                factor=0.5, 
                                                min_lr=0.00001)
    
    history = model.fit_generator(datagen.flow(X_train,Y_train, batch_size=batch_size),
                                  epochs = epochs, 
                                  validation_data = (X_val,Y_val),
                                  verbose = 1, 
                                  steps_per_epoch=X_train.shape[0] // batch_size,
                                  callbacks=[learning_rate_reduction, PlotLossesKeras()])
    

    And here's the error I get:

    ---------------------------------------------------------------------------
    KeyError                                  Traceback (most recent call last)
    <ipython-input-26-bd8223167e59> in <module>
          5                               verbose = 1,
          6                               steps_per_epoch=X_train.shape[0] // batch_size,
    ----> 7                               callbacks=[learning_rate_reduction, PlotLossesKeras()])
    
    ~/anaconda3/envs/upwork/lib/python3.7/site-packages/keras/legacy/interfaces.py in wrapper(*args, **kwargs)
         89                 warnings.warn('Update your `' + object_name + '` call to the ' +
         90                               'Keras 2 API: ' + signature, stacklevel=2)
    ---> 91             return func(*args, **kwargs)
         92         wrapper._original_function = func
         93         return wrapper
    
    ~/anaconda3/envs/upwork/lib/python3.7/site-packages/keras/engine/training.py in fit_generator(self, generator, steps_per_epoch, epochs, verbose, callbacks, validation_data, validation_steps, class_weight, max_queue_size, workers, use_multiprocessing, shuffle, initial_epoch)
       1416             use_multiprocessing=use_multiprocessing,
       1417             shuffle=shuffle,
    -> 1418             initial_epoch=initial_epoch)
       1419 
       1420     @interfaces.legacy_generator_methods_support
    
    ~/anaconda3/envs/upwork/lib/python3.7/site-packages/keras/engine/training_generator.py in fit_generator(model, generator, steps_per_epoch, epochs, verbose, callbacks, validation_data, validation_steps, class_weight, max_queue_size, workers, use_multiprocessing, shuffle, initial_epoch)
        249                     break
        250 
    --> 251             callbacks.on_epoch_end(epoch, epoch_logs)
        252             epoch += 1
        253             if callback_model.stop_training:
    
    ~/anaconda3/envs/upwork/lib/python3.7/site-packages/keras/callbacks.py in on_epoch_end(self, epoch, logs)
         77         logs = logs or {}
         78         for callback in self.callbacks:
    ---> 79             callback.on_epoch_end(epoch, logs)
         80 
         81     def on_batch_begin(self, batch, logs=None):
    
    ~/anaconda3/envs/upwork/lib/python3.7/site-packages/livelossplot/generic_keras.py in on_epoch_end(self, epoch, logs)
         63 
         64     def on_epoch_end(self, epoch, logs={}):
    ---> 65         self.liveplot.update(logs.copy())
         66         self.liveplot.draw()
    
    ~/anaconda3/envs/upwork/lib/python3.7/site-packages/livelossplot/generic_plot.py in update(self, log)
         80         self.logs.append(log)
         81         if self.plot_extrema:
    ---> 82             self._update_extrema(log)
         83 
         84     def draw(self):
    
    ~/anaconda3/envs/upwork/lib/python3.7/site-packages/livelossplot/generic_plot.py in _update_extrema(self, log)
         69     def _update_extrema(self, log):
         70         for metric, value in log.items():
    ---> 71             extrema = self.metrics_extrema[metric]
         72             if _is_unset(extrema['min']) or value < extrema['min']:
         73                 extrema['min'] = float(value)
    
    KeyError: 'lr'
    
    
    opened by mjkvaak 9
  • Which other data do you need in the plots?

    Which other data do you need in the plots?

    I am thinking what is the best amount of data displayed? Maybe it is good to add other features - like the numerical value of current metrics, or maximal values.

    Though, I don't want to make it too cluttered. So, I am interested in your feedback what is missing (or what you would consider more a distraction).

    enhancement question 
    opened by stared 8
  • KeyError : 'metrics'     Please Help

    KeyError : 'metrics' Please Help

    This error has started appearing after I upgraded my tensorflow version to 2.2

    ~/.local/lib/python3.5/site-packages/livelossplot/generic_keras.py in on_train_begin(self, logs) 29 30 def on_train_begin(self, logs={}): ---> 31 self.liveplot.set_metrics([metric for metric in self.params['metrics'] if not metric.startswith('val_')]) 32 33 # slightly convolved due to model.complie(loss=...) stuff

    KeyError: 'metrics'

    opened by hemangjoshi37a 7
  • Add support for unicode in README.md

    Add support for unicode in README.md

    In setup.py, the contents of README.md are read as a string, but this fails because it contains a unicode character. By using the codecs library, the unicode character can be included in the string.

    I wasn't sure if I needed to do anything special to import other packages in setup.py. Let me know if there's something I need to change.

    opened by jonahweissman 7
  • Setup outputs as str

    Setup outputs as str

    🚀 Feature

    Just to improve user's experience with this part of code:

    • Currently
    from livelossplot import PlotLosses
    from livelossplot.outputs import MatplotlibPlot, TensorboardLogger
    
    outputs=[MatplotlibPlot(), TensorboardLogger()]
    plotlosses = PlotLosses(outputs=outputs)
    
    • FR
    from livelossplot import PlotLosses
    
    outputs=["matplotlib", "tensorboard", ...]
    plotlosses = PlotLosses(outputs=outputs)
    

    @stared what do you think ?

    opened by vfdev-5 6
  • series_fmt in custom_series notebook

    series_fmt in custom_series notebook

    The example from custom_series notebook doesn't work:

    TypeError: init() got an unexpected keyword argument 'series_fmt'

    Was series_fmt parameter in an older version?

    opened by lambdaofgod 6
  • Adding Bokeh backend

    Adding Bokeh backend

    Bokeh, as an alternative backend to matplotlib, would make it simple to:

    • toggle between in-notebook plots and external plots (so that it would work seamlessly with both Jupyter Notebook Python scripts)
    • give mouseover view of exact numerical values (no more eye squeezing!)
    • zoom if needed

    I don't want to have it instead of matplotlib (as this one makes it easier to save plots, so that they are visible in Jupyter Notebooks on GitHub), but as an additional backend.

    My experience with Bokeh is limited, so this issue is open for YOUR contribution! :)

    enhancement help wanted 
    opened by stared 5
  • Fix build for Python 3.7 and Python 3.10

    Fix build for Python 3.7 and Python 3.10

    This PR fixes the current build. There are several modifications. First, it seems that the pdoc3 package or one of its dependencies does not support Python 3.7. I thus removed it from CI. Second, I fixed formatting for Yapf. Third, I changed some arguments used in the bokeh logger because they are/will be removed. And fourth, it seems that the Neptune logger is a bit out of date and that there was some modifications to the library. I just commented the faulty line in the test.

    opened by freud14 4
  • Prediction plot fix

    Prediction plot fix

    A fix to #137.

    While 2d_prediction_map.ipynb should work with this version, I saw there is a lot of inconsistency with the custom chart display. In general, custom plots fell victim to refactoring.

    Screenshot 2022-07-15 at 14 18 46

    opened by stared 0
  • 'Plot2d' object has no attribute 'set_output_mode'

    'Plot2d' object has no attribute 'set_output_mode'

    🐛 Bug description

    The example notebook on 2d prediction maps throws the following error

    ---------------------------------------------------------------------------
    AttributeError                            Traceback (most recent call last)
    /tmp/ipykernel_22241/3692360535.py in <module>
          5                                     margin=0.2, h=0.02, device=device)
          6 plot2d.predict = plot2d._predict_pytorch
    ----> 7 liveloss = PlotLosses(outputs=[plot2d])
          8 
          9 criterion = nn.CrossEntropyLoss()
    
    /usr/local/lib/python3.8/dist-packages/livelossplot/plot_losses.py in __init__(self, outputs, mode, **kwargs)
         30         self.outputs = [getattr(livelossplot.outputs, out)() if isinstance(out, str) else out for out in outputs]
         31         for out in self.outputs:
    ---> 32             out.set_output_mode(mode)
         33 
         34     def update(self, *args, **kwargs):
    
    AttributeError: 'Plot2d' object has no attribute 'set_output_mode'
    

    Environment

    • livelossplot version: 0.5.5
    • torch: 1.11.0+cpu
    • OS: Linux
    • Environment: Both Jupyter Lab and Colab
    • Python version: 3.8.0
    opened by deepak-s-h 1
  • WARNING : tensorflow:Callback method `on_train_batch_end` is slow compared to the batch time

    WARNING : tensorflow:Callback method `on_train_batch_end` is slow compared to the batch time

    tensorflow:Callback

    Hi, Thank you very much for this amazing tool it helps a lot. Just a have a simple warning that will make this tool great if it is fixed. This warning occurs when I use PlotLossesKeras callback.

    WARNING:tensorflow:Callback method `on_train_batch_end` is slow compared to the batch time (batch time: 0.1298s vs `on_train_batch_end` time: 0.2397s). Check your callbacks.
    

    Environment

    • livelossplot==0.5.3
    • tensorflow==2.4.0
    • Keras==2.4.3
    • Windows 10
    • Jupyter Lab
    • Python version 3.6.8

    Thank you

    opened by essanhaji 2
  • Bokeh vis not working in Colab

    Bokeh vis not working in Colab

    🐛 Bug description

    Environment

    • livelossplot version (e.g., 0.5.0): 0.5.1
    • Version of relevant libraries (e.g. TensorFlow if you use it) -
    • OS (e.g., Linux): Collaboratory
    • Environment in which the error occurred (e.g. Jupyter Notebook, Jupyter Lab): Collaboratory
    • Python version (e.g. 3.7.1): 3.6.9
    • Any other relevant information: I was trying to run the minimal Bokeh example and it shows this for each iteration: image and nothing more.
    opened by foxale 2
  • Prevent clearing of output other than the livelossplot graph

    Prevent clearing of output other than the livelossplot graph

    I noticed that any output besides the loss graph of livelossplot gets cleared at each training iteration. (anytime I call liveloss.draw())

    Do you have a way of keeping that output ? It seems that this mechanism is at the core of your package:

    # livelossplot/core.py:15
    def draw_plot(logs, metrics, figsize=None, max_epoch=None,
                  max_cols=2,
                  validation_fmt="val_{}",
                  metric2title={}):
        clear_output(wait=True) # I see what you did here
        plt.figure(figsize=figsize)
    

    So I suspect that finding a workaround will be pretty difficult. With that said, I still would like to know if anyone has suggestions.

    opened by pinouchon 4
Owner
Piotr Migdał
Making quantum mainstream @ Quantum Flytrap. Data viz / explorable explanations / tensors. PhD in quantum optics, a deep learning consultant.
Piotr Migdał
Python library to receive live stream events like comments and gifts in realtime from TikTok LIVE.

TikTokLive A python library to connect to and read events from TikTok's LIVE service A python library to receive and decode livestream events such as

Isaac Kogan 277 Dec 23, 2022
A Jupyter notebook to play with NVIDIA's StyleGAN3 and OpenAI's CLIP for a text-based guided image generation.

A Jupyter notebook to play with NVIDIA's StyleGAN3 and OpenAI's CLIP for a text-based guided image generation.

Eugenio Herrera 175 Dec 29, 2022
Repository of Jupyter notebook tutorials for teaching the Deep Learning Course at the University of Amsterdam (MSc AI), Fall 2020

Repository of Jupyter notebook tutorials for teaching the Deep Learning Course at the University of Amsterdam (MSc AI), Fall 2020

Phillip Lippe 1.1k Jan 7, 2023
This Jupyter notebook shows one way to implement a simple first-order low-pass filter on sampled data in discrete time.

How to Implement a First-Order Low-Pass Filter in Discrete Time We often teach or learn about filters in continuous time, but then need to implement t

Joshua Marshall 4 Aug 24, 2022
Recall Loss for Semantic Segmentation (This repo implements the paper: Recall Loss for Semantic Segmentation)

Recall Loss for Semantic Segmentation (This repo implements the paper: Recall Loss for Semantic Segmentation) Download Synthia dataset The model uses

null 32 Sep 21, 2022
An implementation for the loss function proposed in Decoupled Contrastive Loss paper.

Decoupled-Contrastive-Learning This repository is an implementation for the loss function proposed in Decoupled Contrastive Loss paper. Requirements P

Ramin Nakhli 71 Dec 4, 2022
Deep learning operations reinvented (for pytorch, tensorflow, jax and others)

This video in better quality. einops Flexible and powerful tensor operations for readable and reliable code. Supports numpy, pytorch, tensorflow, and

Alex Rogozhnikov 6.2k Jan 1, 2023
Keras Image Embeddings using Contrastive Loss

Keras-Image-Embeddings-using-Contrastive-Loss Image to Embedding projection in vector space. Implementation in keras and tensorflow for custom data. B

Shravan Anand K 5 Mar 21, 2022
Keras Image Embeddings using Contrastive Loss

Image to Embedding projection in vector space. Implementation in keras and tensorflow of batch all triplet loss for one-shot/few-shot learning.

Shravan Anand K 5 Mar 21, 2022
Classification models 1D Zoo - Keras and TF.Keras

Classification models 1D Zoo - Keras and TF.Keras This repository contains 1D variants of popular CNN models for classification like ResNets, DenseNet

Roman Solovyev 12 Jan 6, 2023
This is an implementation of Googles Yogi-Optimizer in Keras (tf.keras)

Yogi-Optimizer_Keras This is an implementation of Googles Yogi-Optimizer in Keras (tf.keras) The NeurIPS-Paper can be found here: http://papers.nips.c

null 14 Sep 13, 2022
Keras udrl - Keras implementation of Upside Down Reinforcement Learning

keras_udrl Keras implementation of Upside Down Reinforcement Learning This is me

Eder Santana 7 Jan 24, 2022
Example-custom-ml-block-keras - Custom Keras ML block example for Edge Impulse

Custom Keras ML block example for Edge Impulse This repository is an example on

Edge Impulse 8 Nov 2, 2022
load .txt to train YOLOX, same as Yolo others

YOLOX train your data you need generate data.txt like follow format (per line-> one image). prepare one data.txt like this: img_path1 x1,y1,x2,y2,clas

LiMingf 18 Aug 18, 2022
A colab notebook for training Stylegan2-ada on colab, transfer learning onto your own dataset.

Stylegan2-Ada-Google-Colab-Starter-Notebook A no thrills colab notebook for training Stylegan2-ada on colab. transfer learning onto your own dataset h

Harnick Khera 66 Dec 16, 2022
PyGAD, a Python 3 library for building the genetic algorithm and training machine learning algorithms (Keras & PyTorch).

PyGAD: Genetic Algorithm in Python PyGAD is an open-source easy-to-use Python 3 library for building the genetic algorithm and optimizing machine lear

Ahmed Gad 1.1k Dec 26, 2022
A no-BS, dead-simple training visualizer for tf-keras

A no-BS, dead-simple training visualizer for tf-keras TrainingDashboard Plot inter-epoch and intra-epoch loss and metrics within a jupyter notebook wi

Vibhu Agrawal 3 May 28, 2021