BEAMetrics: Benchmark to Evaluate Automatic Metrics in Natural Language Generation

Overview

BEAMetrics: Benchmark to Evaluate Automatic Metrics in Natural Language Generation

Installing The Dependencies

$ conda create --name beametrics python>=3.8
$ conda activate beametrics

WARNING: You need to install, before any package, correct version of pytorch linked to your cuda version.

(beametrics) $ conda install pytorch cudatoolkit=10.1 -c pytorch

Install BEAMetrics:

(beametrics) $ cd BEAMetrics
(beametrics) $ pip install -e .

Install Nubia metric (not on PyPI, 16/08/2021):

(beametrics) git clone https://github.com/wl-research/nubia.git
(beametrics) pip install -r requirements.txt

Alternatively, you can remove nubia from _DEFAULT_METRIC_NAMES in metrics.metric_reporter.

Reproducing the results

First you need to get the processed files, which include the metric scores. You can do that either by simply downloading the processed data (see Section Download Data), or by re-computing the scores (see Section Compute Correlations).

Then, the first bloc in the notebook visualize.ipynb allows to get all the tables from the paper (and also to generate the latex code in data/correlation).

Download the data

All the dataset can be downloaded from this zip file. It needs to be unzipped into the path data before running the correlations.

unzip data.zip

The data folder contains:

  • a subfolder raw containing all the original dataset
  • a subfolder processed containing all the dataset processed in a unified format
  • a subfolder correlation containing all the final correlation results, and the main tables of the paper
  • a subfolder datacards containing all the data cards

Computing the correlations

Processing the files to a clean json with the metrics computed:

python beametrics/run_all.py

The optional argument --dataset allows to compute only on a specific dataset, e.g.:

python run_all.py --dataset SummarizationCNNDM.

The list of the datasets and their corresponding configuration can be found in configs/__init__.

When finished, you can print the final table as in the paper, see the notebook visualize.ipynb.

Data Cards:

For each dataset, a data card is available in the datacard folder. The cards are automatically generated when running run_all.py, by filling the template with the dataset configuration as detailed bellow, in Adding a new dataset.

Adding a new dataset:

In configs/, you need to create a new .py file that inherites from ConfigBase (in configs/co'nfig_base.py). You are expected to fill the mandatory fields that allow to run the code and fill the data card template:

  • file_name: the file name located in data/raw
  • file_name_processed: the file name once processed and formated
  • metric_names: you can pass _DEFAULT_METRIC_NAMES by default or customize it, e.g. metric_names = metric_names + ('sari',) where sari corresponds to a valid metric (see the next section)
  • name_dataset: the name of the dataset as it was published
  • short_name_dataset: few letters that will be used to name the dataset in the final table report
  • languages: the languages of the dataset (e.g. [en] or [en, fr])
  • task: e.g. 'simplification', 'data2text
  • number_examples: the total number of evaluated texts
  • nb_refs: the number of references available in the dataset
  • dimensions_definitions: the evaluated dimensions and their corresponding definition e.g. {'fluency: 'How fluent is the text?'}
  • scale: the scale used during the evaluation, as defined in the protocol
  • source_eval_sets: the dataset from which the source were collected to generate the evaluated examples
  • annotators: some information about who were the annotators
  • sampled_from: the URL where was released the evaluation dataset
  • citation: the citation of the paper where the dataset was released

Your class needs its custom method format_file. The function takes as input the dataset's file_name and return a dictionary d_data. The format for d_data has to be the same for all the datasets:

d_data = {
    key_1: {
        'source': "a_source", 
        'hypothesis': "an_hypothesis",
        'references': ["ref_1", "ref_2", ...],
        'dim_1': float(a_score),
        'dim_2': float(an_other_score),
    },
    ...
    key_n: {
        ...
    }
}

where 'key_1' and 'key_n' are the keys for the first and nth example, dim_1 and dim_2 dimensions corresponding to self.dimensions.

Finally, you need to add your dataset to the dictionary D_ALL_DATASETS located in config/__init__.

Adding a new metric:

First, create a class inheriting from metrics/metrics/MetricBase. Then, simply add it to the dictionary _D_METRICS in metrics/__init__.

For the metric to be computed by default, its name has to be added to either

  • _DEFAULT_METRIC_NAMES: metrics computed on each dataset
  • _DEFAULT_METRIC_NAMES_SRC: metrics computed on dataset that have a text format for their source (are excluded for now image captioning and data2text). These two tuples are located in metrics/metric_reported.

Alternatively, you can add the metric to a specific configuration by adding it to the attribute metric_names in the config.

You might also like...
Ludwig is a toolbox that allows to train and evaluate deep learning models without the need to write code.

Translated in ๐Ÿ‡ฐ๐Ÿ‡ท Korean/ Ludwig is a toolbox that allows users to train and test deep learning models without the need to write code. It is built on

OCTIS: Comparing Topic Models is Simple! A python package to optimize and evaluate topic models (accepted at EACL2021 demo track)

OCTIS : Optimizing and Comparing Topic Models is Simple! OCTIS (Optimizing and Comparing Topic models Is Simple) aims at training, analyzing and compa

Narya API allows you track soccer player from camera inputs, and evaluate them with an Expected Discounted Goal (EDG) Agent

Narya The Narya API allows you track soccer player from camera inputs, and evaluate them with an Expected Discounted Goal (EDG) Agent. This repository

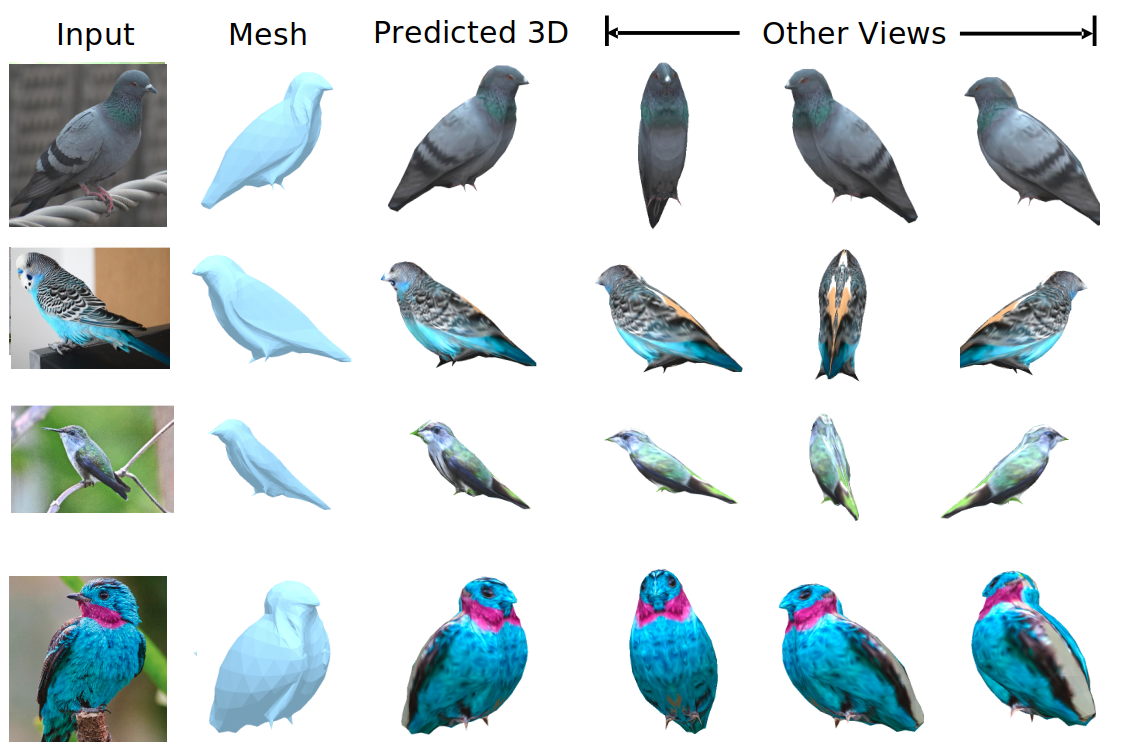
We evaluate our method on different datasets (including ShapeNet, CUB-200-2011, and Pascal3D+) and achieve state-of-the-art results, outperforming all the other supervised and unsupervised methods and 3D representations, all in terms of performance, accuracy, and training time.
This repository contains a set of codes to run (i.e., train, perform inference with, evaluate) a diarization method called EEND-vector-clustering.

EEND-vector clustering The EEND-vector clustering (End-to-End-Neural-Diarization-vector clustering) is a speaker diarization framework that integrates

HeatNet is a python package that provides tools to build, train and evaluate neural networks designed to predict extreme heat wave events globally on daily to subseasonal timescales.

HeatNet HeatNet is a python package that provides tools to build, train and evaluate neural networks designed to predict extreme heat wave events glob

OpenMMLab's Next Generation Video Understanding Toolbox and Benchmark

Introduction English | ็ฎ€ไฝ“ไธญๆ–‡ MMAction2 is an open-source toolbox for video understanding based on PyTorch. It is a part of the OpenMMLab project. The m

Benchmark for evaluating open-ended generation

OpenMEVA Contributed by Jian Guan, Zhexin Zhang. Thank Jiaxin Wen for DeBugging. OpenMEVA is a benchmark for evaluating open-ended story generation me

Comments
  • Reproducing bertscore

    Reproducing bertscore

    Hello,

    Thank you for the great work,

    I am trying to reproduce BertScore for Table 2, block 2 in you paper. Where you evaluate different metrics against one reference. I assume that you are using the first reference in the list of references that you provide in the processed files.

    So my code looks like that for example:

    with open('data/processed/processed.summarization.cnndm') as f:
        data = json.load(f)
    candidates = [data[el]['hypothesis'] for el in data]
    references = [data[el]['references'][0] for el in data]
    

    Then I'm running bertscore after saving the references and the candidates in files using:

    bert-score -r references.txt -c candidates.txt -s --lang en -m bert-base-uncased --idf > bert_score.txt
    

    I trained with\without --idfand with both bert-base-uncased and roberta-large.

    In all cases I'm obtaining values different than those in the json file that I load as follows:

    bertscore = [data[el]['ref_1']['bertscore_f1'] for el in data]
    

    Can you tell me please what are the exact options that you use to compute bertscore?

    opened by moussaKam 2
Owner
null
Metrics to evaluate quality and efficacy of synthetic datasets.

An Open Source Project from the Data to AI Lab, at MIT Metrics for Synthetic Data Generation Projects Website: https://sdv.dev Documentation: https://

The Synthetic Data Vault Project 129 Jan 3, 2023
Pytorch Lightning 1.2k Jan 6, 2023
The source code for the Cutoff data augmentation approach proposed in this paper: "A Simple but Tough-to-Beat Data Augmentation Approach for Natural Language Understanding and Generation".

Cutoff: A Simple Data Augmentation Approach for Natural Language This repository contains source code necessary to reproduce the results presented in

Dinghan Shen 49 Dec 22, 2022
Automatic self-diagnosis program (python required)Automatic self-diagnosis program (python required)

auto-self-checker ์ž๋™์œผ๋กœ ์ž๊ฐ€์ง„๋‹จ ํ•ด์ฃผ๋Š” ํ”„๋กœ๊ทธ๋žจ(python ํ•„์š”) ์ค‘์š” ์ด ํ”„๋กœ๊ทธ๋žจ์ด ์‹คํ–‰๋ ๋•Œ์—๋Š” ์ ˆ๋Œ€๋กœ ๋งˆ์šฐ์Šคํฌ์ธํ„ฐ๋ฅผ ์›€์ง์ด๊ฑฐ๋‚˜ ํ‚ค๋ณด๋“œ๋ฅผ ๊ฑด๋“œ๋ฆฌ๋ฉด ์•ˆ๋œ๋‹ค(ํ™”๋ฉด์ธ์‹, ๋งˆ์šฐ์Šคํฌ์ธํ„ฐ๋กœ ์ง์ ‘ ํด๋ฆญ) ์‚ฌ์šฉ๋ฒ• ํ”„๋กœ๊ทธ๋žจ์„ ๊ตฌ๋™ํ•  ํด๋” ๋‚ด์˜ cmd์ฐฝ์—์„œ pip

null 1 Dec 30, 2021
[IJCAI'21] Deep Automatic Natural Image Matting

Deep Automatic Natural Image Matting [IJCAI-21] This is the official repository of the paper Deep Automatic Natural Image Matting. Introduction | Netw

Jizhizi_Li 316 Jan 6, 2023
Theano is a Python library that allows you to define, optimize, and evaluate mathematical expressions involving multi-dimensional arrays efficiently. It can use GPUs and perform efficient symbolic differentiation.

============================================================================================================ `MILA will stop developing Theano <https:

null 9.6k Dec 31, 2022
Theano is a Python library that allows you to define, optimize, and evaluate mathematical expressions involving multi-dimensional arrays efficiently. It can use GPUs and perform efficient symbolic differentiation.

============================================================================================================ `MILA will stop developing Theano <https:

null 9.6k Jan 6, 2023
Theano is a Python library that allows you to define, optimize, and evaluate mathematical expressions involving multi-dimensional arrays efficiently. It can use GPUs and perform efficient symbolic differentiation.

============================================================================================================ `MILA will stop developing Theano <https:

null 9.3k Feb 12, 2021
Ludwig is a toolbox that allows to train and evaluate deep learning models without the need to write code.

Translated in ???? Korean/ Ludwig is a toolbox that allows users to train and test deep learning models without the need to write code. It is built on

Ludwig 8.7k Jan 5, 2023