I've demonstrated the working of the decision tree-based ID3 algorithm. Use an appropriate data set for building the decision tree and apply this knowledge to classify a new sample. All the steps have been explained in detail with graphics for better understanding.

Overview

Last Commit Created Last Commit Stars Badge Forks Badge Size Pull Requests Badge Issues Badge Language MIT License

binder colab

Python Decision Tree and Random Forest

Decision Tree

A Decision Tree is one of the popular and powerful machine learning algorithms that I have learned. The basics of Decision Tree is explained in detail with clear explanation.

I have given complete theoritical stepwise explanation of computing decision tree using ID3 (Iterative Dichotomiser) and CART (Classification And Regression Trees) along sucessfully implemention of decision tree on ID3 and CART using Python on playgolf_data and Iris dataset

Play Golf dataset:

ID3 CART
ID3 dataset analysis CART dataset analysis

Iris dataset

  1. Method 1: Print Text Representation

  1. Method 2: Plot Tree with plot_tree

  1. Method 3: Plot Decision Tree with graphviz

  1. Method 4: Plot Decision Tree with dtreeviz Package

  1. Method 5: Visualizing the Decision Tree in Regression Task


Table of contents 📋

No. Name
01 Decision_Tree_PlayGolf_ID3
02 Decision_Tree_PlayGolf_CART
03 Decision_Tree_Visualisation_Iris_Dataset
04 Decision_Tree_Classifier_Iris_Dataset

These are online read-only versions. However you can Run ▶ all the codes online by clicking here ➞ binder


Frequently asked questions

How can I thank you for writing and sharing this tutorial? 🌷

You can Star Badge and Fork Badge Starring and Forking is free for you, but it tells me and other people that it was helpful and you like this tutorial.

Go here if you aren't here already and click ➞ ✰ Star and ⵖ Fork button in the top right corner. You will be asked to create a GitHub account if you don't already have one.


How can I read this tutorial without an Internet connection? GIF

  1. Go here and click the big green ➞ Code button in the top right of the page, then click ➞ Download ZIP.

    Download ZIP

  2. Extract the ZIP and open it. Unfortunately I don't have any more specific instructions because how exactly this is done depends on which operating system you run.

  3. Launch ipython notebook from the folder which contains the notebooks. Open each one of them

    Kernel > Restart & Clear Output

This will clear all the outputs and now you can understand each statement and learn interactively.

If you have git and you know how to use it, you can also clone the repository instead of downloading a zip and extracting it. An advantage with doing it this way is that you don't need to download the whole tutorial again to get the latest version of it, all you need to do is to pull with git and run ipython notebook again.


Authors ✍️

I'm Dr. Milaan Parmar and I have written this tutorial. If you think you can add/correct/edit and enhance this tutorial you are most welcome 🙏

See github's contributors page for details.

If you have trouble with this tutorial please tell me about it by Create an issue on GitHub. and I'll make this tutorial better. This is probably the best choice if you had trouble following the tutorial, and something in it should be explained better. You will be asked to create a GitHub account if you don't already have one.

If you like this tutorial, please give it a star.


Licence 📜

You may use this tutorial freely at your own risk. See LICENSE.

You might also like...
Visualizations of linear algebra algorithms for people who want a deep understanding

Visualising algorithms on symmetric matrices Examples QR algorithm and LR algorithm Here, we have a GIF animation of an interactive visualisation of t

Python scripts to manage Chia plots and drive space, providing full reports. Also monitors the number of chia coins you have.

Chia Plot, Drive Manager & Coin Monitor (V0.5 - April 20th, 2021) Multi Server Chia Plot and Drive Management Solution Be sure to ⭐ my repo so you can

The open-source tool for building high-quality datasets and computer vision models

The open-source tool for building high-quality datasets and computer vision models. Website • Docs • Try it Now • Tutorials • Examples • Blog • Commun

The open-source tool for building high-quality datasets and computer vision models

The open-source tool for building high-quality datasets and computer vision models. Website • Docs • Try it Now • Tutorials • Examples • Blog • Commun

Because trello only have payed options to generate a RunUp chart, this solves that!

Trello Runup Chart Generator The basic concept of the project is that Corello is pay-to-use and want to use Trello To-Do/Doing/Done automation with gi

A python wrapper for creating and viewing effects for Matt Parker's christmas tree.

Christmas Tree Visualizer A python wrapper for creating and viewing effects for Matt Parker's christmas tree. Displays py or csv effect files and allo

Focus on Algorithm Design, Not on Data Wrangling

The dataTap Python library is the primary interface for using dataTap's rich data management tools. Create datasets, stream annotations, and analyze model performance all with one library.

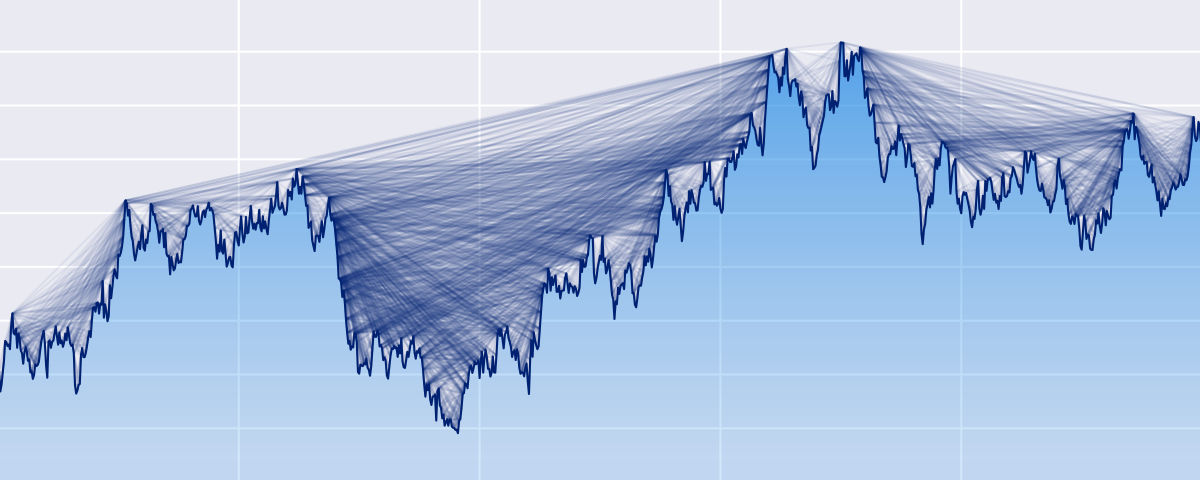
Python ts2vg package provides high-performance algorithm implementations to build visibility graphs from time series data.

ts2vg: Time series to visibility graphs The Python ts2vg package provides high-performance algorithm implementations to build visibility graphs from t

Draw tree diagrams from indented text input

Draw tree diagrams This repository contains two very different scripts to produce hierarchical tree diagrams like this one: $ ./classtree.py collectio

Owner
Milaan Parmar / Милан пармар / _米兰 帕尔马
💼👨‍🏫 Researcher • Python | MATLAB | R • Build🤯 → Test🤞 → Debug✔️ “Change Is the Only Constant in Life" ➶
Milaan Parmar /  Милан пармар / _米兰 帕尔马
The windML framework provides an easy-to-use access to wind data sources within the Python world, building upon numpy, scipy, sklearn, and matplotlib. Renewable Wind Energy, Forecasting, Prediction

windml Build status : The importance of wind in smart grids with a large number of renewable energy resources is increasing. With the growing infrastr

Computational Intelligence Group 125 Dec 24, 2022
A grammar of graphics for Python

plotnine Latest Release License DOI Build Status Coverage Documentation plotnine is an implementation of a grammar of graphics in Python, it is based

Hassan Kibirige 3.3k Jan 1, 2023
A grammar of graphics for Python

plotnine Latest Release License DOI Build Status Coverage Documentation plotnine is an implementation of a grammar of graphics in Python, it is based

Hassan Kibirige 2.6k Feb 12, 2021
A grammar of graphics for Python

plotnine Latest Release License DOI Build Status Coverage Documentation plotnine is an implementation of a grammar of graphics in Python, it is based

Hassan Kibirige 2.6k Feb 18, 2021
A custom qq-plot for two sample data comparision

QQ-Plot 2 Sample Just a gist to include the custom code to draw a qq-plot in python when dealing with a "two sample problem". This means when u try to

null 1 Dec 20, 2021
HiPlot makes understanding high dimensional data easy

HiPlot - High dimensional Interactive Plotting HiPlot is a lightweight interactive visualization tool to help AI researchers discover correlations and

Facebook Research 2.4k Jan 4, 2023
HiPlot makes understanding high dimensional data easy

HiPlot - High dimensional Interactive Plotting HiPlot is a lightweight interactive visualization tool to help AI researchers discover correlations and

Facebook Research 2k Feb 17, 2021
Decision Border Visualizer for Classification Algorithms

dbv Decision Border Visualizer for Classification Algorithms Project description A python package for Machine Learning Engineers who want to visualize

Sven Eschlbeck 1 Nov 1, 2021
Active Transport Analytics Model (ATAM) is a new strategic transport modelling and data visualization framework for Active Transport as well as emerging micro-mobility modes

{ATAM} Active Transport Analytics Model Active Transport Analytics Model (“ATAM”) is a new strategic transport modelling and data visualization framew

Peter Stephan 0 Jan 12, 2022
Data aggregated from the reports found at the MCPS COVID Dashboard into a set of visualizations.

Montgomery County Public Schools COVID-19 Visualizer Contents About this project Data Support this project About this project Data All data we use can

James 3 Jan 19, 2022