Visualization Library

Overview

CamViz

Overview // Installation // Demos // License

Overview

CamViz is a visualization library developed by the TRI-ML team with the goal of providing an interface for the visualization of monocular depth estimation results, both as depth maps and reconstructed pointclouds. It uses PyGame for window display and input management (mouse and keyboard), and OpenGL for 2D and 3D drawing and rendering. It provides an easy and intuitive way to:

  • Store information as textures and data buffers for efficient display
  • Create 2D environments for image display and 3D environments for pointcloud visualization
  • A pinhole camera class that manages most basic geometric operations (reconstruction, projection, transformation to different coordinate frames, etc.)

Although CamViz works as a standalone library, it was designed specifically to be used in conjunction with other TRI-ML's repositories, in particular PackNet-SFM and DDAD. To facilitate integration, it is also provided as a submodule in those repositories.

Installation

We provide a requirements.txt file with all the required libraries (tested on Ubuntu 18.04). To start using CamViz all you need to do is:

git clone [email protected]:TRI-ML/camviz.git
cd camviz
pip install -r requirements.txt
PYTHONPATH=$PYTHONPATH:/path/to/camviz

Demos

The CamViz repository comes with a demo that visualizes a predicted monocular pointcloud (already calculated, and provided as part of the repository). We plan to include more demos as more functionalities are added, usually tied to scientific publications. To run it, type the following command from the root folder:

python demos/pointcloud.py

The output should look like this:

From this initial display you can:

  • Zoom in/out on the images with the mouse wheel, and translate within image boundaries.
  • Move freely within the 3D viewer (translation, rotation and zoom in/out) with the mouse.
  • Change color modes with the enter key.

License

The source code is released under the MIT license.

You might also like...
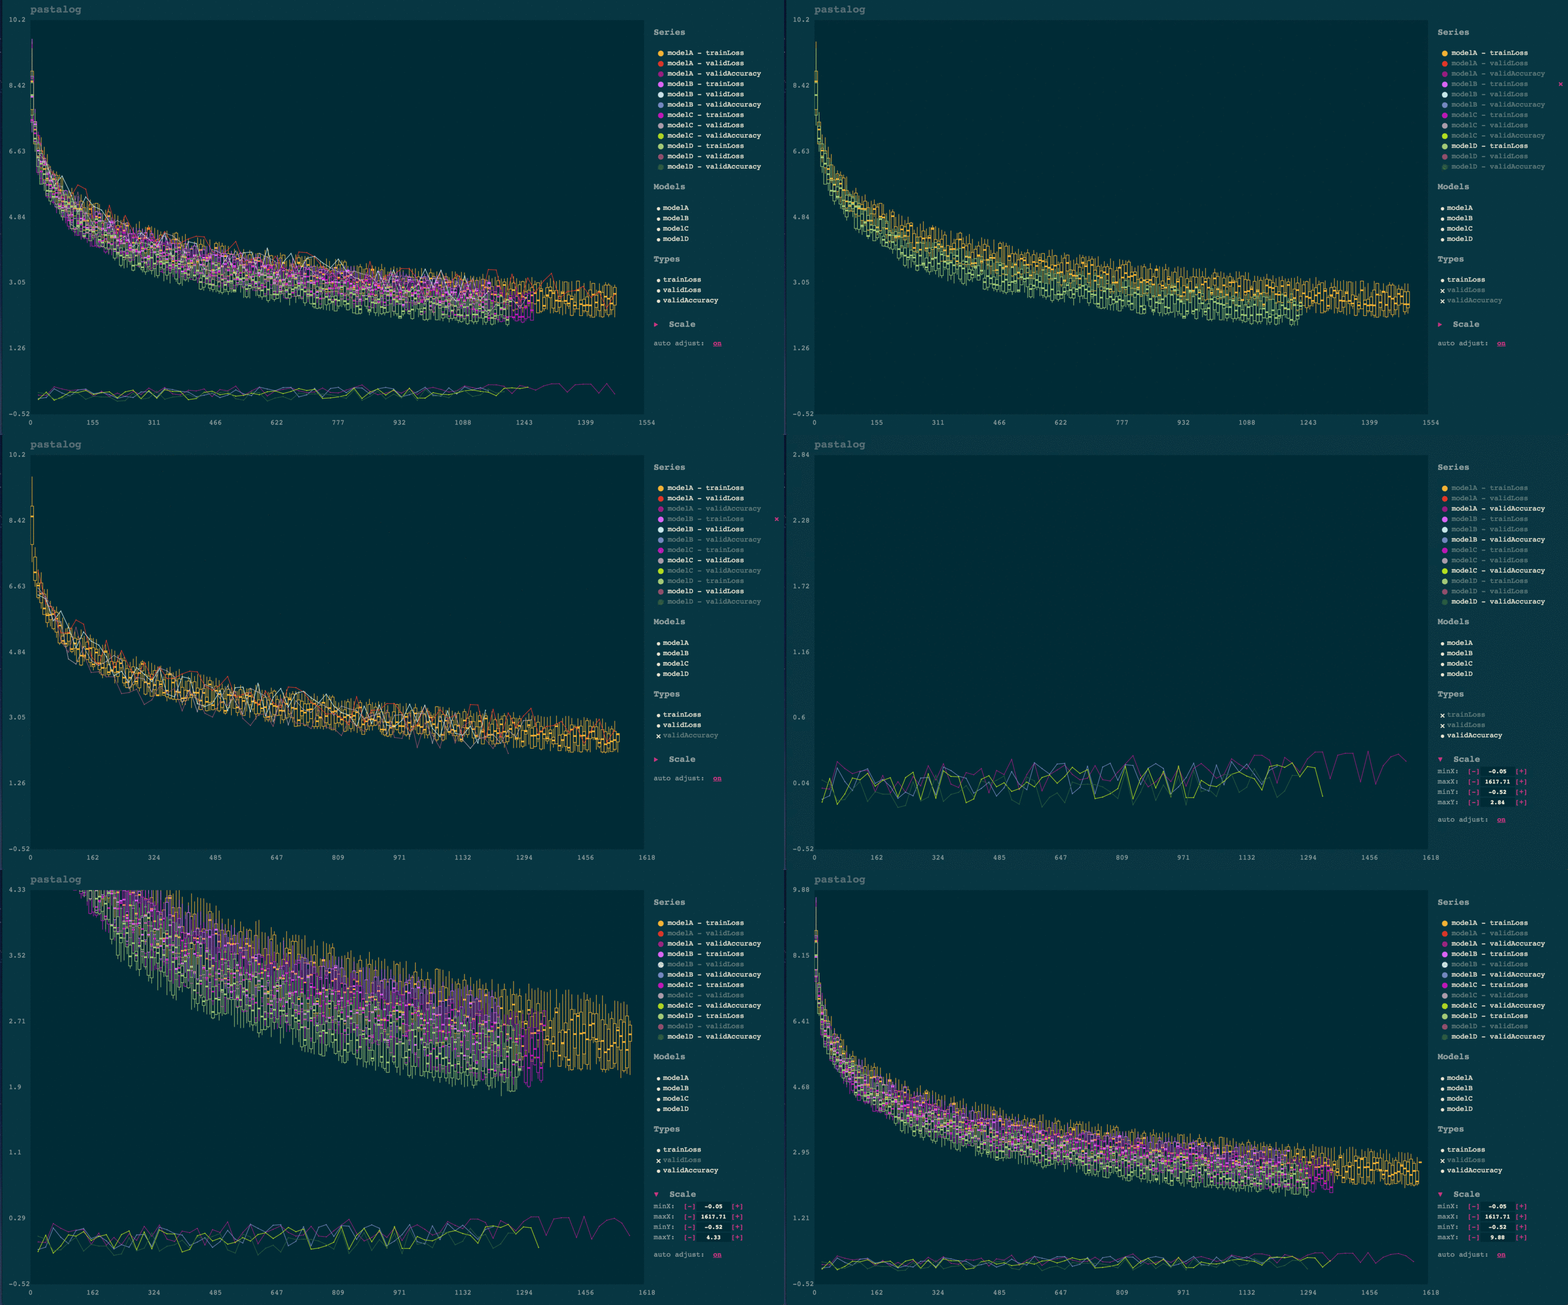
Simple, realtime visualization of neural network training performance.

pastalog Simple, realtime visualization server for training neural networks. Use with Lasagne, Keras, Tensorflow, Torch, Theano, and basically everyth

Apache Superset is a Data Visualization and Data Exploration Platform

Superset A modern, enterprise-ready business intelligence web application. Why Superset? | Supported Databases | Installation and Configuration | Rele

Debugging, monitoring and visualization for Python Machine Learning and Data Science

Welcome to TensorWatch TensorWatch is a debugging and visualization tool designed for data science, deep learning and reinforcement learning from Micr

Python script to generate a visualization of various sorting algorithms, image or video.

sorting_algo_visualizer Python script to generate a visualization of various sorting algorithms, image or video.

Statistical data visualization using matplotlib

seaborn: statistical data visualization Seaborn is a Python visualization library based on matplotlib. It provides a high-level interface for drawing

Interactive Data Visualization in the browser, from  Python
Interactive Data Visualization in the browser, from Python

Bokeh is an interactive visualization library for modern web browsers. It provides elegant, concise construction of versatile graphics, and affords hi

Fast data visualization and GUI tools for scientific / engineering applications

PyQtGraph A pure-Python graphics library for PyQt5/PyQt6/PySide2/PySide6 Copyright 2020 Luke Campagnola, University of North Carolina at Chapel Hill h

Missing data visualization module for Python.

missingno Messy datasets? Missing values? missingno provides a small toolset of flexible and easy-to-use missing data visualizations and utilities tha

Streaming pivot visualization via WebAssembly

Perspective is an interactive visualization component for large, real-time datasets. Originally developed for J.P. Morgan's trading business, Perspect

Comments
  • A small typo in the readme

    A small typo in the readme

    Hi, thanks for finally open sourcing this! Just a quick suggestion: fix the typo in the installation part. The correct command should be:

    git clone [email protected]:TRI-ML/camviz.git
    

    instead of:

    git clone [email protected]:TRI-ML/camviz_internal.git
    

    It also works on Ubuntu 20.04, just for the record. Have a nice day :)

    opened by morsingher 1
  • How to run on headless server?

    How to run on headless server?

    Thank you for such a great release!

    Would the authors know how to run this on headless server?

    X Error of failed request: Badvalue (integer parameter out of range for operation)

    Thanks in advance!

    opened by EphChem 0
Owner
Toyota Research Institute - Machine Learning
Declarative statistical visualization library for Python

Altair http://altair-viz.github.io Altair is a declarative statistical visualization library for Python. With Altair, you can spend more time understa

Altair 6.4k Feb 13, 2021
Declarative statistical visualization library for Python

Altair http://altair-viz.github.io Altair is a declarative statistical visualization library for Python. With Altair, you can spend more time understa

Altair 6.4k Feb 18, 2021
Python histogram library - histograms as updateable, fully semantic objects with visualization tools. [P]ython [HYST]ograms.

physt P(i/y)thon h(i/y)stograms. Inspired (and based on) numpy.histogram, but designed for humans(TM) on steroids(TM). The goal is to unify different

Jan Pipek 120 Dec 8, 2022
High-level geospatial data visualization library for Python.

geoplot: geospatial data visualization geoplot is a high-level Python geospatial plotting library. It's an extension to cartopy and matplotlib which m

Aleksey Bilogur 1k Jan 1, 2023
Streamlit component for Let's-Plot visualization library

streamlit-letsplot This is a work-in-progress, providing a convenience function to plot charts from the Lets-Plot visualization library. Example usage

Randy Zwitch 9 Nov 3, 2022
FURY - A software library for scientific visualization in Python

Free Unified Rendering in Python A software library for scientific visualization in Python. General Information • Key Features • Installation • How to

null 169 Dec 21, 2022
Visualization Library

CamViz Overview // Installation // Demos // License Overview CamViz is a visualization library developed by the TRI-ML team with the goal of providing

Toyota Research Institute - Machine Learning 67 Nov 24, 2022
Interactive Data Visualization in the browser, from Python

Bokeh is an interactive visualization library for modern web browsers. It provides elegant, concise construction of versatile graphics, and affords hi

Bokeh 17.1k Dec 31, 2022
Statistical data visualization using matplotlib

seaborn: statistical data visualization Seaborn is a Python visualization library based on matplotlib. It provides a high-level interface for drawing

Michael Waskom 10.2k Dec 30, 2022
Fast data visualization and GUI tools for scientific / engineering applications

PyQtGraph A pure-Python graphics library for PyQt5/PyQt6/PySide2/PySide6 Copyright 2020 Luke Campagnola, University of North Carolina at Chapel Hill h

pyqtgraph 3.1k Jan 8, 2023