A python library for Bayesian time series modeling

Overview

PyDLM Build Status Coverage Status

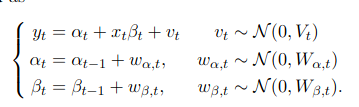
Welcome to pydlm, a flexible time series modeling library for python. This library is based on the Bayesian dynamic linear model (Harrison and West, 1999) and optimized for fast model fitting and inference.

Updates in the github version

  • A temporary fix on the predict() complexity bug (due to incorrect self-referencing, thanks romainjln@ and buhbuhtig@!). The fixed predict() complxity is O(n). The goal is to make it O(1).
  • A lite version pydlm-lite has been created where dependencies on matplotlib was removed. Going forward, most code refactoring on improving multi-threading and online learning will be done on the pydlm-lite package. The development on pydlm package will primarily focus on supporting broader model classes and more advanced sampling algorithms.
  • Version 0.1.1.11 released on PyPI.

Installation

You can get the package (current version 0.1.1.11) from pypi by

  $ pip install pydlm

You can also get the latest from github

  $ git clone [email protected]:wwrechard/pydlm.git pydlm
  $ cd pydlm
  $ sudo python setup.py install

pydlm depends on the following modules,

  • numpy (for core functionality)
  • matplotlib (for plotting results)
  • Sphinx (for generating documentation)
  • unittest (for testing)

Google data science post example

We use the example from the Google data science post as an example to show how pydlm could be used to analyze the real world data. The code and data is placed under examples/unemployment_insurance/.... The dataset contains weekly counts of initial claims for unemployment during 2004 - 2012 and is available from the R package bsts (which is a popular R package for time series modeling). The raw data is shown below (left)

We see strong annual pattern and some local trend from the data.

A simple model

Following the Google's post, we first build a simple model with only local linear trend and seasonality component.
from pydlm import dlm, trend, seasonality
# A linear trend
linear_trend = trend(degree=1, discount=0.95, name='linear_trend', w=10)
# A seasonality
seasonal52 = seasonality(period=52, discount=0.99, name='seasonal52', w=10)
# Build a simple dlm
simple_dlm = dlm(time_series) + linear_trend + seasonal52

In the actual code, the time series data is scored in the variable time_series. degree=1 indicates the trend is linear (2 stands for quadratic) and period=52 means the seasonality has a periodicy of 52. Since the seasonality is generally more stable, we set its discount factor to 0.99. For local linear trend, we use 0.95 to allow for some flexibility. w=10 is the prior guess on the variance of each component, the larger number the more uncertain. For actual meaning of these parameters, please refer to the user manual. After the model built, we can fit the model and plot the result (shown above, right figure)

# Fit the model
simple_dlm.fit()
# Plot the fitted results
simple_dlm.turnOff('data points')
simple_dlm.plot()

The blue curve is the forward filtering result, the green curve is the one-day ahead prediction and the red curve is the backward smoothed result. The light-colored ribbon around the curve is the confidence interval (you might need to zoom-in to see it). The one-day ahead prediction shows this simple model captures the time series somewhat good but loses accuracy around the peak crisis at Week 280 (which is between year 2008 - 2009). The one-day-ahead mean squared prediction error is 0.173 which can be obtained by calling

simple_dlm.getMSE()

We can decompose the time series into each of its components

# Plot each component (attribute the time series to each component)
simple_dlm.turnOff('predict plot')
simple_dlm.turnOff('filtered plot')
simple_dlm.plot('linear_trend')
simple_dlm.plot('seasonal52')

Most of the time series shape is attributed to the local linear trend and the strong seasonality pattern is easily seen. To further verify the performance, we use this simple model for long-term forecasting. In particular, we use the previous 351 week's data to forecast the next 200 weeks and the previous 251 week's data to forecast the next 200 weeks. We lay the predicted results on top of the real data

# Plot the prediction give the first 351 weeks and forcast the next 200 weeks.
simple_dlm.plotPredictN(date=350, N=200)
# Plot the prediction give the first 251 weeks and forcast the next 200 weeks.
simple_dlm.plotPredictN(date=250, N=200)

From the figure we see that after the crisis peak around 2008 - 2009 (Week 280), the simple model can accurately forecast the next 200 weeks (left figure) given the first 351 weeks. However, the model fails to capture the change near the peak if the forecasting start before Week 280 (right figure).

Dynamic linear regression

Now we build a more sophiscated model with extra variables in the data file. The extra variables are stored in the variable `features` in the actual code. To build the dynamic linear regression model, we simply add a new component
# Build a dynamic regression model
from pydlm import dynamic
regressor10 = dynamic(features=features, discount=1.0, name='regressor10', w=10)
drm = dlm(time_series) + linear_trend + seasonal52 + regressor10
drm.fit()
drm.getMSE()

# Plot the fitted results
drm.turnOff('data points')
drm.plot()

dynamic is the component for modeling dynamically changing predictors, which accepts features as its argument. The above code plots the fitted result (top left).

The one-day ahead prediction looks much better than the simple model, particularly around the crisis peak. The mean prediction error is 0.099 which is a 100% improvement over the simple model. Similarly, we also decompose the time series into the three components

drm.turnOff('predict plot')
drm.turnOff('filtered plot')
drm.plot('linear_trend')
drm.plot('seasonal52')
drm.plot('regressor10')

This time, the shape of the time series is mostly attributed to the regressor and the linear trend looks more linear. If we do long-term forecasting again, i.e., use the previous 301 week's data to forecast the next 150 weeks and the previous 251 week's data to forecast the next 200 weeks

drm.plotPredictN(date=300, N=150)
drm.plotPredictN(date=250, N=200)

The results look much better compared to the simple model

Documentation

Detailed documentation is provided in PyDLM with special attention to the User manual.

Comments
  • how to use myDLM.predict to estimate predict_mean, predict_var

    how to use myDLM.predict to estimate predict_mean, predict_var

    hi Samuel, DLM is really great works for time series analysis. while I have some troubles in predict, codes are as following, where I want to predict mean and variance at the 11th day:

    #use 10 days data to predict mean and variance at the 11th day from pydlm import dlm, trend, seasonality, dynamic, autoReg, longSeason y=[1,2,3,4,5,6,7,8,9,10] myDLM=dlm(np.array(y)) myDLM=myDLM+trend(1,discount=0.9)+seasonality(period=4) myDLM.fit() (temp_obser, temp_var)=myDLM.predict(date=10)

    A 'NameError' always raised as 'Prediction can only be made right after the filtered date' , while it works for data=0, i am wondering whether date=9 can be used to predict the 11th day?

    Another bothering, how to use myDLM.getMean(filterType='predict'), the results as following: [0.0, 0.5141700157557093, 1.0505510107948781, 1.6023862753925242, 2.167438960958558, 2.7443287976659794, 3.3319788291099885, 3.9294677809751066, 4.535975127609981, 5.150754959923865] while (temp_mean, temp_var)=myDLM.predict(date=9), the temp_mean is 5.773, which is different with the last data 5.150754959923865 in getMean? I wondering is getMean(filterType='predict') can get the predict mean as myDLM.predict? thanks for your kind help.

    Jianju

    opened by sun137653577 11
  • AttributeError: 'dlm' object has no attribute 'predictStatus'

    AttributeError: 'dlm' object has no attribute 'predictStatus'

    Facing this issue when trying to make two points ahead prediction(for one point ahead prediction it works fine). Looked into the code, it appears that somehow continue prediction module is not getting the first forecasts's AR component which is required for second forecast. I use following model:

    model_prediction

    data_pydlm = data.set_index('date', drop=True)
    myDLM_pred = dlm(data_pydlm.y)
    myDLM_pred = myDLM_pred + trend(degree=trend_degree, name='trend', w=trend_w)
    myDLM_pred = myDLM_pred + seasonality(12, name='12month', w=seasonality_w)
    myDLM_pred = myDLM_pred + autoReg(degree=ar_degree, data=prod_pydlm.y, name='ar', w = ar_w)
    
    myDLM_pred.fit()
    

    Error:

    print(myDLM_pred.predictN(N=2, date=myDLM_pred.n - 1)) File "C:\Anaconda\Anaconda3\lib\site-packages\pydlm\dlm.py", line 379, in predictN (obs, var) = self.continuePredict(featureDict=featureDictOneDay) File "C:\Anaconda\Anaconda3\lib\site-packages\pydlm\dlm.py", line 328, in continuePredict return self._continuePredict(featureDict=featureDict) File "C:\Anaconda\Anaconda3\lib\site-packages\pydlm\func_dlm.py", line 441, in _continuePredict extra = comp.d - len(self.predictStatus[2]) AttributeError: 'dlm' object has no attribute 'predictStatus'

    I would appreciate any help with this

    opened by raviy8408 3
  • How do I create a Time Varying Model using pydlm?

    How do I create a Time Varying Model using pydlm?

    I want to create a Time Varying Linear model like this: image How should I proceed with the same? You documentations lacks some notations, adding which would be really beneficial. But nice work. Its really useful in my research

    opened by Samya98 2
  • problem with longSeason: updateEvaluation() takes 2 positional arguments but 3 were given

    problem with longSeason: updateEvaluation() takes 2 positional arguments but 3 were given

    I have a simple model with one data point for each hour, I have a daily season (24 hours) and a weekly season 7 periods a 24 hours.

            data = df["avg"] # just a column of a pandas DataFrame
            bsts = dlm(data)
            # A linear trend
            bsts = bsts + trend(degree=1, discount=0.95, name='linear_trend', w=10)
            bsts = bsts + seasonality(period=24, discount=0.99, name='seasonal24', w=10)
            bsts = bsts + longSeason(data=data, period=7, stay=24, discount=0.99, name='seasonal7', w=100)
    

    which produces the following error:

    Initializing models...
    Traceback (most recent call last):
      File "bsts.py", line 121, in <module>
        group_by_test()
      File "bsts.py", line 54, in group_by_test
        bsts.fit()
      File "/Applications/anaconda3/lib/python3.7/site-packages/pydlm/dlm.py", line 283, in fit
        self.fitForwardFilter()
      File "/Applications/anaconda3/lib/python3.7/site-packages/pydlm/dlm.py", line 185, in fitForwardFilter
        self._initialize()
      File "/Applications/anaconda3/lib/python3.7/site-packages/pydlm/func/_dlm.py", line 150, in _initialize
        self.builder.initialize(noise=self.options.noise, data=self.padded_data)
      File "/Applications/anaconda3/lib/python3.7/site-packages/pydlm/modeler/builder.py", line 277, in initialize
        comp.updateEvaluation(0, data)
    TypeError: updateEvaluation() takes 2 positional arguments but 3 were given
    

    Am I using longSeason correctly?

    opened by janbolmer 2
  • AutoRegression failing with lag value >1

    AutoRegression failing with lag value >1

    When running

    simple_dlm = dlm(data) + autoReg(degree=3, data=data, name='ar3', w=1.0) simple_dlm.fit()

    I get

    Traceback (most recent call last):
      File "final.py", line 81, in <module>
        simple_dlm.plotPredictN(date=780, N=51)
      File "/Users/gcgibson/anaconda/lib/python2.7/site-packages/pydlm/dlm.py", line 1139, in plotPredictN
        N=N, date=date, featureDict=featureDict)
      File "/Users/gcgibson/anaconda/lib/python2.7/site-packages/pydlm/dlm.py", line 379, in predictN
        (obs, var) = self.continuePredict(featureDict=featureDictOneDay)
      File "/Users/gcgibson/anaconda/lib/python2.7/site-packages/pydlm/dlm.py", line 328, in continuePredict
        return self._continuePredict(featureDict=featureDict)
      File "/Users/gcgibson/anaconda/lib/python2.7/site-packages/pydlm/func/_dlm.py", line 441, in _continuePredict
        extra = comp.d - len(self.predictStatus[2])
    AttributeError: dlm instance has no attribute 'predictStatus'


    however, setting ar=1 seems to work fine.

    opened by gcgibson 2
  • unittest is part of standard python 2 and 3 and cannot be installed f…

    unittest is part of standard python 2 and 3 and cannot be installed f…

    Removed unittest dependency because with any modern Python (2 or 3) this prevents actually running tests. Unittest is a part of standard distribution.

    opened by dtolpin 1
  • Release up-to-date version on PyPi?

    Release up-to-date version on PyPi?

    Hey, thanks for the nice lib! I was wondering if you'd be able to increment and release an up-to-date version to PyPi. If not, do you have any sense of when a new version will be released?

    opened by bdewilde 1
  • dynamic can read numpy matrix as the feature matrix

    dynamic can read numpy matrix as the feature matrix

    @xgdgsc @liguopku Allow dynamic component read numpy matrix as feature matrix. Each row corresponding to all feature values of a day, i.e., the dimension of the numpy matrix must be a n x d, where n is the number of dates and d is the feature dimension.

    opened by wwrechard 1
  • Evaluation speed - Running in root faster than running in venv

    Evaluation speed - Running in root faster than running in venv

    First of all thank you for the library. I find that when i fit a model in root Python (-v 3.6.10) it runs way faster than venv version. Can you please mention, if any of the pydlm dependency causes this or there is something more that needs to be taken into account.

    opened by Arjunh50 0
  • python 3.9 will break pydlm?

    python 3.9 will break pydlm?

    Looks like an easy fix. Want a PR?

    /pydlm/modeler/dynamic.py:18: DeprecationWarning: Using or importing the ABCs from 'collections' instead of from 'collections.abc' is deprecated since Python 3.3, and in 3.9 it will stop working from collections import MutableSequence

    opened by microprediction 0
  • Allow user to suppress warning on dynamic components

    Allow user to suppress warning on dynamic components

    Line 729 of dlm.py reads:

    if len(self.builder.dynamicComponents) > 0: print('Remember to append the new features for the' + ' dynamic components as well')

    I'm going to suggest allowing suppression of this, as there isn't a way to add the data to 'main' and also dynamic at the same time - so this message will always be displayed, often in an inner loop.

    opened by microprediction 0
  • R and Python different results

    R and Python different results

    I am trying to fit the following model (local level model) using pydlm package in Python-

    Yt = θt + vt, vt ∼ N(0, Vt), θt = θt−1 + wt, wt ∼ N(0,Wt) …….(1)

    I have simulated the above model in python with the following values for Vt and Wt-

    sigma2_v = 0.5 ………..(2) sigma2_w = 0.25 ……….(3) x0 = 0 t = 500 t_burn = 100 t_tot = t + t_burn y_tot = np.zeros(t_tot) x_tot = np.zeros(t_tot)

    v = np.random.normal(0, sqrt(sigma2_v), t_tot) w = np.random.normal(0, sqrt(sigma2_w), t_tot)

    x_tot[0] = x0 + w[0] y_tot[0] = x_tot[0] + v[0]

    for i in range(1,t_tot): x_tot[i] = x_tot[i - 1] + w[i] y_tot[i] = x_tot[i] + v[i]

    I am using the following argument to fit model (1) in pydlm

    myDLM1 = dlm(y_tot) trend1 = trend(degree=0, discount=0.99, name = 'trend') myDLM1 = myDLM1 + trend1 myDLM1.tune(maxit = 100) myDLM1.fit()

    Below are my values for Vt and Wt- var_v = myDLM1.getVar(filterType='forwardFilter') var_v 0.996619 0.771301 1.183684 0.910351 0.774972 .. ... 1.003247 1.003131 1.001465 0.999822 0.999866

    var_w = myDLM1.getVar(filterType='forwardFilter', name = 'trend') var_w

    0.496571 0.285149 0.370662 0.257496 0.205303 .. ... 0.231519 0.231492 0.231107 0.230728 0.230738

    Questions-

    1. If I fit model (1) with dlm package in R with same y series, I get the following estimates of Vt and Wt 0.55 0.23

    Which are very close to the original sigma2_v and sigma2_w from which the y series has been simulated. I am unable to recover the similar values using pydlm.

    Can you please help me out with this problem?

    1. Why does pydlm give Vt and Wt across all time points given they are assumed to be constant ?
    opened by SmitRohan 0
  • Hello world example mentioned getFilteredObs which seems not to exist anymore

    Hello world example mentioned getFilteredObs which seems not to exist anymore

    Example in docs at https://pydlm.github.io/# suggests this hello world example, however the getFilteredObs method is seemingly no longer in use

    myDLM = dlm([]) + trend(1) + seasonality(7)
    for t in range(0, len(data)):
    ...     myDLM.append([data[t]])
    ...     myDLM.fitForwardFilter()
    filteredObs = myDLM.getFilteredObs()
    

    I think this should be replaced by a call to model.predict() inside the loop, as per https://github.com/microprediction/timeseries-notebooks/blob/main/pydlm_hello.ipynb ?

    opened by microprediction 0
  • DeprecationWarning in pydlm/modeler/dynamic.py

    DeprecationWarning in pydlm/modeler/dynamic.py

    I obtained the following warning when using this package. Will there be any update to address this issue? Thank you!!

    DeprecationWarning: Using or importing the ABCs from 'collections' instead of from 'collections.abc' is deprecated since Python 3.3, and in 3.9 it will stop working from collections import MutableSequence.

    opened by tianke2020 0
Owner
Sam
Sam
Probabilistic time series modeling in Python

GluonTS - Probabilistic Time Series Modeling in Python GluonTS is a Python toolkit for probabilistic time series modeling, built around Apache MXNet (

Amazon Web Services - Labs 3.3k Jan 3, 2023
Open source time series library for Python

PyFlux PyFlux is an open source time series library for Python. The library has a good array of modern time series models, as well as a flexible array

Ross Taylor 2k Jan 2, 2023
A statistical library designed to fill the void in Python's time series analysis capabilities, including the equivalent of R's auto.arima function.

pmdarima Pmdarima (originally pyramid-arima, for the anagram of 'py' + 'arima') is a statistical library designed to fill the void in Python's time se

alkaline-ml 1.3k Dec 22, 2022
A python library for easy manipulation and forecasting of time series.

Time Series Made Easy in Python darts is a python library for easy manipulation and forecasting of time series. It contains a variety of models, from

Unit8 5.2k Jan 4, 2023
STUMPY is a powerful and scalable Python library for computing a Matrix Profile, which can be used for a variety of time series data mining tasks

STUMPY STUMPY is a powerful and scalable library that efficiently computes something called the matrix profile, which can be used for a variety of tim

TD Ameritrade 2.5k Jan 6, 2023
An open-source library of algorithms to analyse time series in GPU and CPU.

An open-source library of algorithms to analyse time series in GPU and CPU.

Shapelets 216 Dec 30, 2022
Nixtla is an open-source time series forecasting library.

Nixtla Nixtla is an open-source time series forecasting library. We are helping data scientists and developers to have access to open source state-of-

Nixtla 401 Jan 8, 2023
A Python package for time series classification

pyts: a Python package for time series classification pyts is a Python package for time series classification. It aims to make time series classificat

Johann Faouzi 1.4k Jan 1, 2023
Python module for machine learning time series:

seglearn Seglearn is a python package for machine learning time series or sequences. It provides an integrated pipeline for segmentation, feature extr

David Burns 536 Dec 29, 2022
A Python toolkit for rule-based/unsupervised anomaly detection in time series

Anomaly Detection Toolkit (ADTK) Anomaly Detection Toolkit (ADTK) is a Python package for unsupervised / rule-based time series anomaly detection. As

Arundo Analytics 888 Dec 30, 2022
AtsPy: Automated Time Series Models in Python (by @firmai)

Automated Time Series Models in Python (AtsPy) SSRN Report Easily develop state of the art time series models to forecast univariate data series. Simp

Derek Snow 465 Jan 2, 2023
A Python implementation of GRAIL, a generic framework to learn compact time series representations.

GRAIL A Python implementation of GRAIL, a generic framework to learn compact time series representations. Requirements Python 3.6+ numpy scipy tslearn

null 3 Nov 24, 2021
PyPOTS - A Python Toolbox for Data Mining on Partially-Observed Time Series

A python toolbox/library for data mining on partially-observed time series, supporting tasks of forecasting/imputation/classification/clustering on incomplete multivariate time series with missing values.

Wenjie Du 179 Dec 31, 2022
A machine learning toolkit dedicated to time-series data

tslearn The machine learning toolkit for time series analysis in Python Section Description Installation Installing the dependencies and tslearn Getti

null 2.3k Jan 5, 2023
Tool for producing high quality forecasts for time series data that has multiple seasonality with linear or non-linear growth.

Prophet: Automatic Forecasting Procedure Prophet is a procedure for forecasting time series data based on an additive model where non-linear trends ar

Facebook 15.4k Jan 7, 2023
Automatic extraction of relevant features from time series:

tsfresh This repository contains the TSFRESH python package. The abbreviation stands for "Time Series Feature extraction based on scalable hypothesis

Blue Yonder GmbH 7k Jan 6, 2023
A unified framework for machine learning with time series

Welcome to sktime A unified framework for machine learning with time series We provide specialized time series algorithms and scikit-learn compatible

The Alan Turing Institute 6k Jan 6, 2023
A machine learning toolkit dedicated to time-series data

tslearn The machine learning toolkit for time series analysis in Python Section Description Installation Installing the dependencies and tslearn Getti

null 2.3k Dec 29, 2022
Time series forecasting with PyTorch

Our article on Towards Data Science introduces the package and provides background information. Pytorch Forecasting aims to ease state-of-the-art time

Jan Beitner 2.5k Jan 2, 2023