STUMPY is a powerful and scalable Python library for computing a Matrix Profile, which can be used for a variety of time series data mining tasks

Overview
PyPI Version PyPI Downloads Conda-forge Version Conda-forge Downloads License Test Status Code Coverage ReadTheDocs Status Binder JOSS DOI FOSSA Twitter

STUMPY Logo

STUMPY

STUMPY is a powerful and scalable library that efficiently computes something called the matrix profile, which can be used for a variety of time series data mining tasks such as:

  • pattern/motif (approximately repeated subsequences within a longer time series) discovery
  • anomaly/novelty (discord) discovery
  • shapelet discovery
  • semantic segmentation
  • streaming (on-line) data
  • fast approximate matrix profiles
  • time series chains (temporally ordered set of subsequence patterns)
  • and more ...

Whether you are an academic, data scientist, software developer, or time series enthusiast, STUMPY is straightforward to install and our goal is to allow you to get to your time series insights faster. See documentation for more information.

How to use STUMPY

Please see our API documentation for a complete list of available functions and see our informative tutorials for more comprehensive example use cases. Below, you will find code snippets that quickly demonstrate how to use STUMPY.

Typical usage (1-dimensional time series data) with STUMP:

import stumpy
import numpy as np

if __name__ == "__main__":
    your_time_series = np.random.rand(10000)
    window_size = 50  # Approximately, how many data points might be found in a pattern

    matrix_profile = stumpy.stump(your_time_series, m=window_size)

Distributed usage for 1-dimensional time series data with Dask Distributed via STUMPED:

import stumpy
import numpy as np
from dask.distributed import Client

if __name__ == "__main__":
    dask_client = Client()

    your_time_series = np.random.rand(10000)
    window_size = 50  # Approximately, how many data points might be found in a pattern

    matrix_profile = stumpy.stumped(dask_client, your_time_series, m=window_size)

GPU usage for 1-dimensional time series data with GPU-STUMP:

import stumpy
import numpy as np
from numba import cuda

if __name__ == "__main__":
    your_time_series = np.random.rand(10000)
    window_size = 50  # Approximately, how many data points might be found in a pattern
    all_gpu_devices = [device.id for device in cuda.list_devices()]  # Get a list of all available GPU devices

    matrix_profile = stumpy.gpu_stump(your_time_series, m=window_size, device_id=all_gpu_devices)

Multi-dimensional time series data with MSTUMP:

import stumpy
import numpy as np

if __name__ == "__main__":
    your_time_series = np.random.rand(3, 1000)  # Each row represents data from a different dimension while each column represents data from the same dimension
    window_size = 50  # Approximately, how many data points might be found in a pattern

    matrix_profile, matrix_profile_indices = stumpy.mstump(your_time_series, m=window_size)

Distributed multi-dimensional time series data analysis with Dask Distributed MSTUMPED:

import stumpy
import numpy as np
from dask.distributed import Client

if __name__ == "__main__":
    dask_client = Client()

    your_time_series = np.random.rand(3, 1000)   # Each row represents data from a different dimension while each column represents data from the same dimension
    window_size = 50  # Approximately, how many data points might be found in a pattern

    matrix_profile, matrix_profile_indices = stumpy.mstumped(dask_client, your_time_series, m=window_size)

Time Series Chains with Anchored Time Series Chains (ATSC):

import stumpy
import numpy as np

if __name__ == "__main__":
    your_time_series = np.random.rand(10000)
    window_size = 50  # Approximately, how many data points might be found in a pattern

    matrix_profile = stumpy.stump(your_time_series, m=window_size)

    left_matrix_profile_index = matrix_profile[:, 2]
    right_matrix_profile_index = matrix_profile[:, 3]
    idx = 10  # Subsequence index for which to retrieve the anchored time series chain for

    anchored_chain = stumpy.atsc(left_matrix_profile_index, right_matrix_profile_index, idx)

    all_chain_set, longest_unanchored_chain = stumpy.allc(left_matrix_profile_index, right_matrix_profile_index)

Semantic Segmentation with Fast Low-cost Unipotent Semantic Segmentation (FLUSS):

import stumpy
import numpy as np

if __name__ == "__main__":
    your_time_series = np.random.rand(10000)
    window_size = 50  # Approximately, how many data points might be found in a pattern

    matrix_profile = stumpy.stump(your_time_series, m=window_size)

    subseq_len = 50
    correct_arc_curve, regime_locations = stumpy.fluss(matrix_profile[:, 1],
                                                    L=subseq_len,
                                                    n_regimes=2,
                                                    excl_factor=1
                                                    )

Dependencies

Supported Python and NumPy versions are determined according to the NEP 29 deprecation policy.

Where to get it

Conda install (preferred):

conda install -c conda-forge stumpy

PyPI install, presuming you have numpy, scipy, and numba installed:

python -m pip install stumpy

To install stumpy from source, see the instructions in the documentation.

Documentation

In order to fully understand and appreciate the underlying algorithms and applications, it is imperative that you read the original publications. For a more detailed example of how to use STUMPY please consult the latest documentation or explore the following tutorials:

  1. The Matrix Profile
  2. STUMPY Basics
  3. Time Series Chains
  4. Semantic Segmentation

Performance

We tested the performance of computing the exact matrix profile using the Numba JIT compiled version of the code on randomly generated time series data with various lengths (i.e., np.random.rand(n)) along with different CPU and GPU hardware resources.

STUMPY Performance Plot

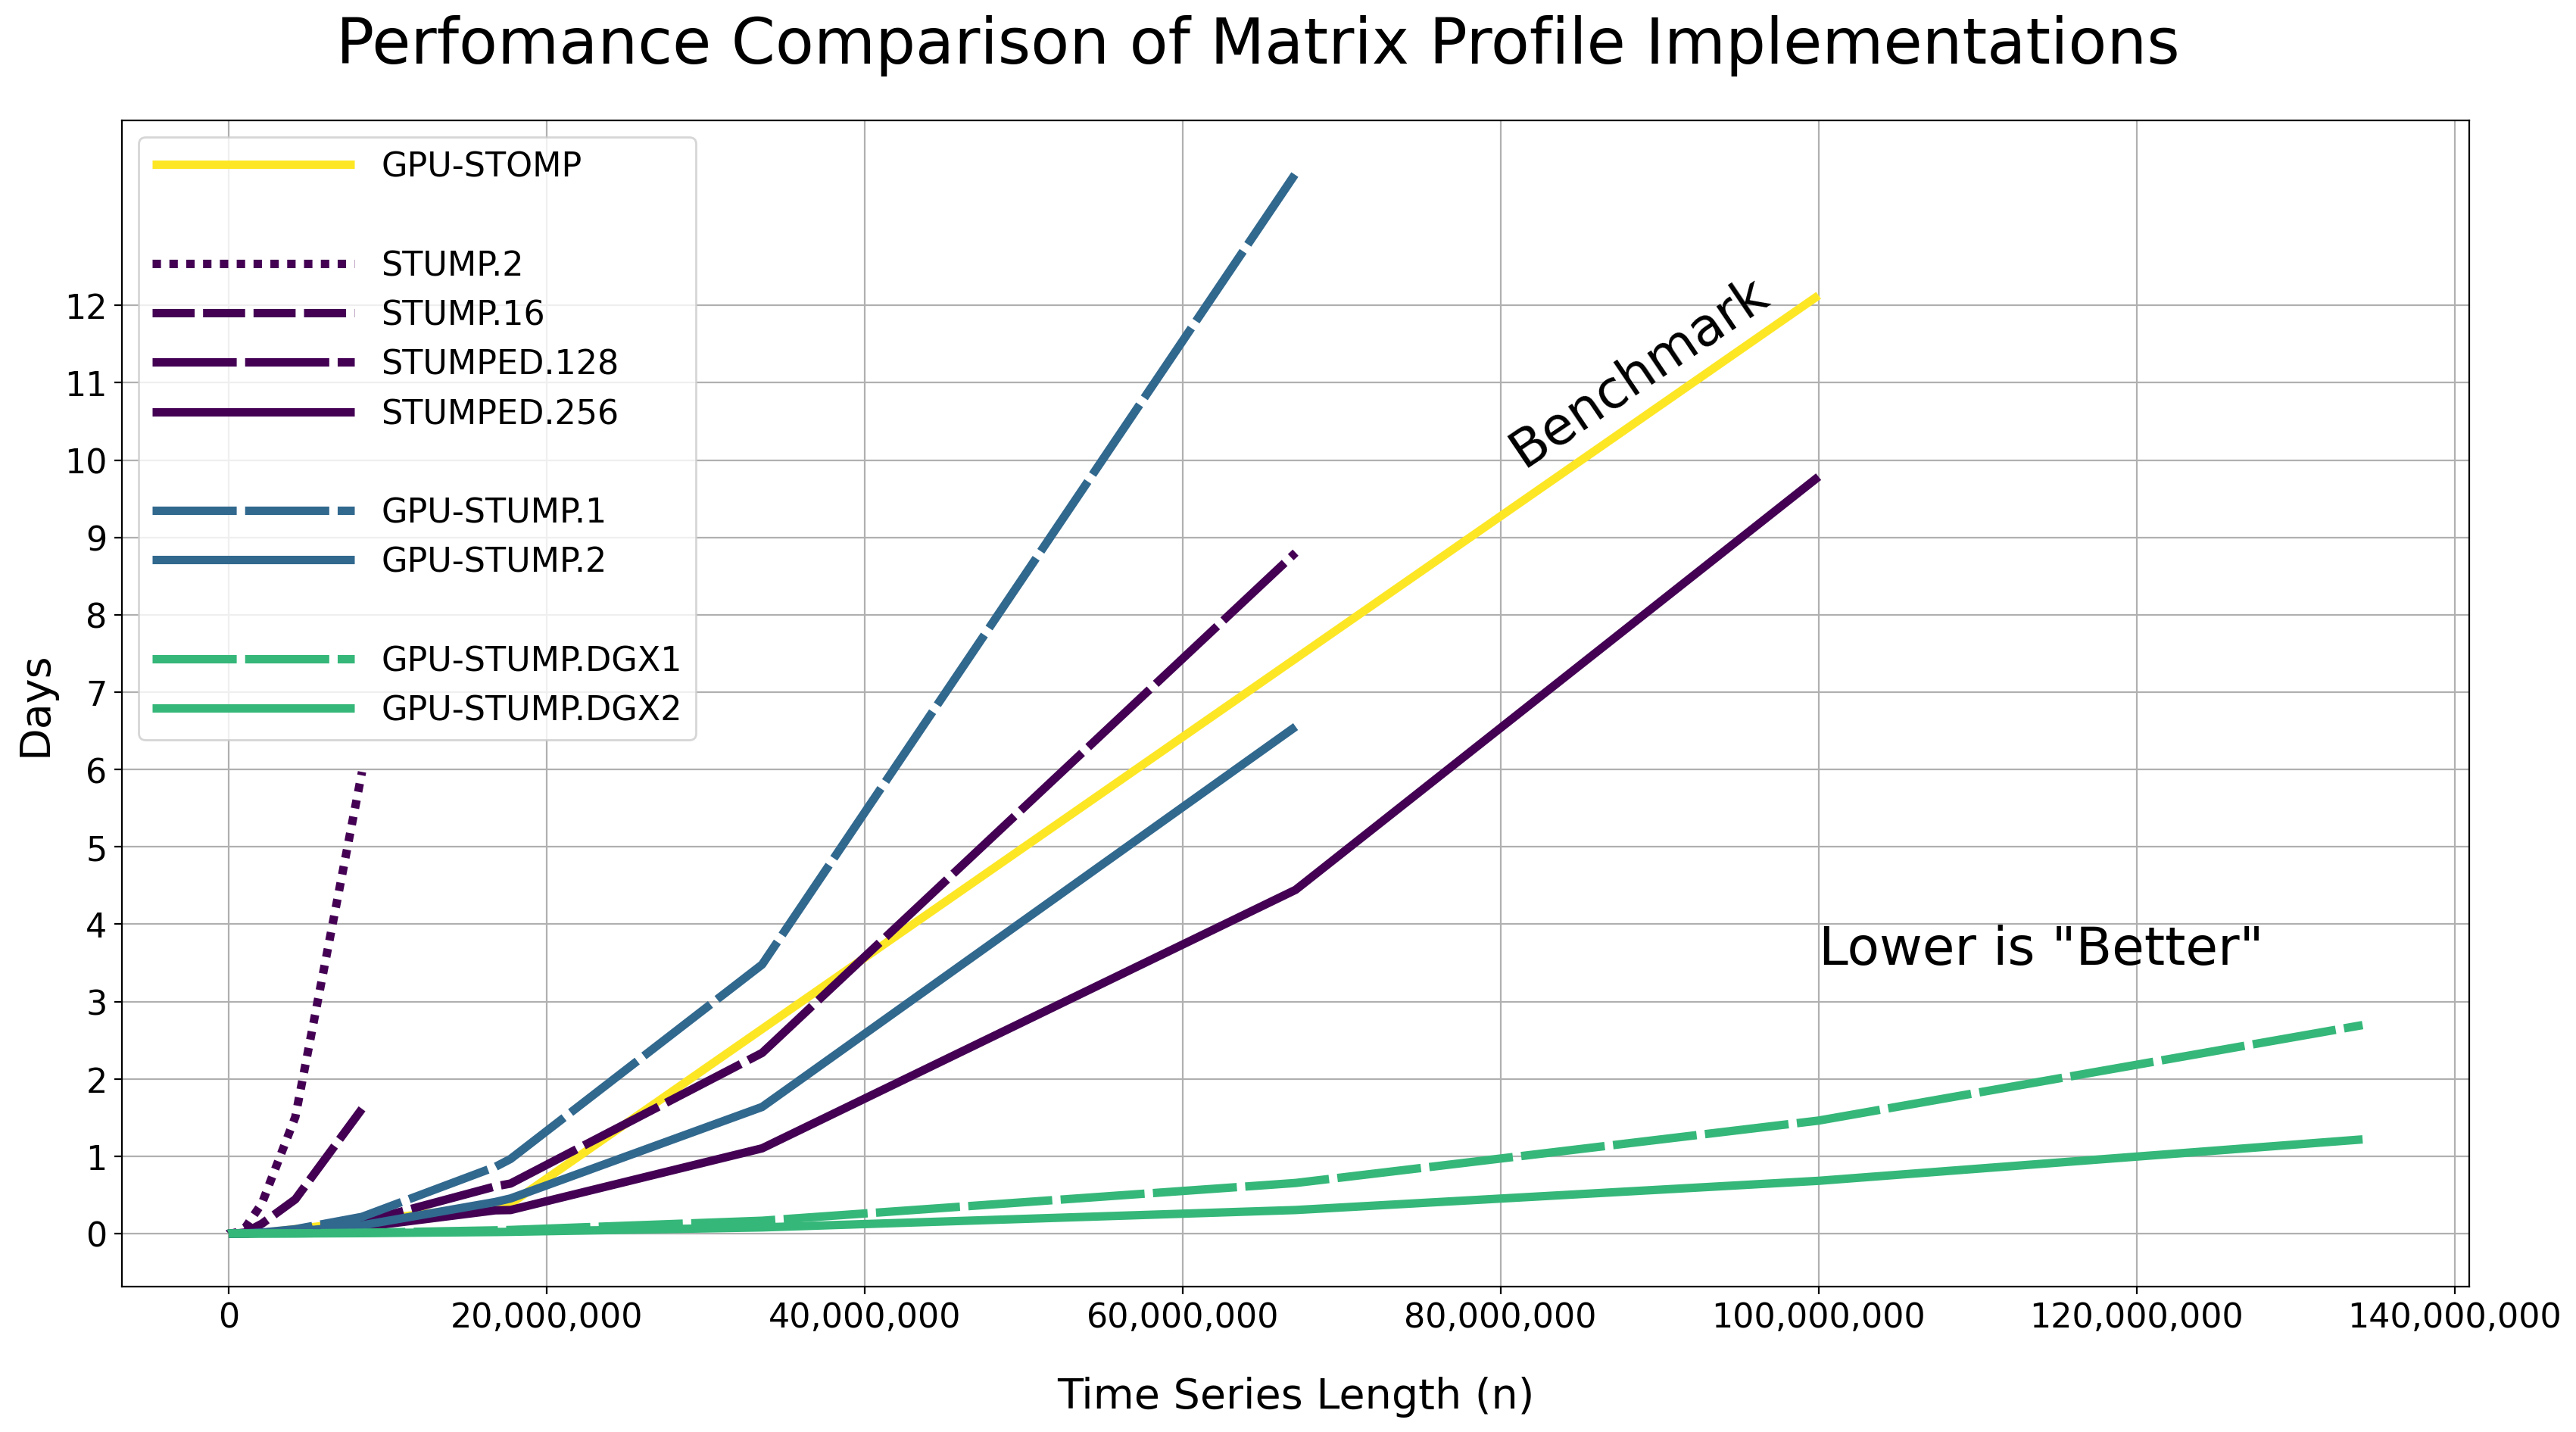
The raw results are displayed in the table below as Hours:Minutes:Seconds.Milliseconds and with a constant window size of m = 50. Note that these reported runtimes include the time that it takes to move the data from the host to all of the GPU device(s). You may need to scroll to the right side of the table in order to see all of the runtimes.

i n = 2i GPU-STOMP STUMP.2 STUMP.16 STUMPED.128 STUMPED.256 GPU-STUMP.1 GPU-STUMP.2 GPU-STUMP.DGX1 GPU-STUMP.DGX2
6 64 00:00:10.00 00:00:00.00 00:00:00.00 00:00:05.77 00:00:06.08 00:00:00.03 00:00:01.63 NaN NaN
7 128 00:00:10.00 00:00:00.00 00:00:00.00 00:00:05.93 00:00:07.29 00:00:00.04 00:00:01.66 NaN NaN
8 256 00:00:10.00 00:00:00.00 00:00:00.01 00:00:05.95 00:00:07.59 00:00:00.08 00:00:01.69 00:00:06.68 00:00:25.68
9 512 00:00:10.00 00:00:00.00 00:00:00.02 00:00:05.97 00:00:07.47 00:00:00.13 00:00:01.66 00:00:06.59 00:00:27.66
10 1024 00:00:10.00 00:00:00.02 00:00:00.04 00:00:05.69 00:00:07.64 00:00:00.24 00:00:01.72 00:00:06.70 00:00:30.49
11 2048 NaN 00:00:00.05 00:00:00.09 00:00:05.60 00:00:07.83 00:00:00.53 00:00:01.88 00:00:06.87 00:00:31.09
12 4096 NaN 00:00:00.22 00:00:00.19 00:00:06.26 00:00:07.90 00:00:01.04 00:00:02.19 00:00:06.91 00:00:33.93
13 8192 NaN 00:00:00.50 00:00:00.41 00:00:06.29 00:00:07.73 00:00:01.97 00:00:02.49 00:00:06.61 00:00:33.81
14 16384 NaN 00:00:01.79 00:00:00.99 00:00:06.24 00:00:08.18 00:00:03.69 00:00:03.29 00:00:07.36 00:00:35.23
15 32768 NaN 00:00:06.17 00:00:02.39 00:00:06.48 00:00:08.29 00:00:07.45 00:00:04.93 00:00:07.02 00:00:36.09
16 65536 NaN 00:00:22.94 00:00:06.42 00:00:07.33 00:00:09.01 00:00:14.89 00:00:08.12 00:00:08.10 00:00:36.54
17 131072 00:00:10.00 00:01:29.27 00:00:19.52 00:00:09.75 00:00:10.53 00:00:29.97 00:00:15.42 00:00:09.45 00:00:37.33
18 262144 00:00:18.00 00:05:56.50 00:01:08.44 00:00:33.38 00:00:24.07 00:00:59.62 00:00:27.41 00:00:13.18 00:00:39.30
19 524288 00:00:46.00 00:25:34.58 00:03:56.82 00:01:35.27 00:03:43.66 00:01:56.67 00:00:54.05 00:00:19.65 00:00:41.45
20 1048576 00:02:30.00 01:51:13.43 00:19:54.75 00:04:37.15 00:03:01.16 00:05:06.48 00:02:24.73 00:00:32.95 00:00:46.14
21 2097152 00:09:15.00 09:25:47.64 03:05:07.64 00:13:36.51 00:08:47.47 00:20:27.94 00:09:41.43 00:01:06.51 00:01:02.67
22 4194304 NaN 36:12:23.74 10:37:51.21 00:55:44.43 00:32:06.70 01:21:12.33 00:38:30.86 00:04:03.26 00:02:23.47
23 8388608 NaN 143:16:09.94 38:42:51.42 03:33:30.53 02:00:49.37 05:11:44.45 02:33:14.60 00:15:46.26 00:08:03.76
24 16777216 NaN NaN NaN 14:39:11.99 07:13:47.12 20:43:03.80 09:48:43.42 01:00:24.06 00:29:07.84
NaN 17729800 09:16:12.00 NaN NaN 15:31:31.75 07:18:42.54 23:09:22.43 10:54:08.64 01:07:35.39 00:32:51.55
25 33554432 NaN NaN NaN 56:03:46.81 26:27:41.29 83:29:21.06 39:17:43.82 03:59:32.79 01:54:56.52
26 67108864 NaN NaN NaN 211:17:37.60 106:40:17.17 328:58:04.68 157:18:30.50 15:42:15.94 07:18:52.91
NaN 100000000 291:07:12.00 NaN NaN NaN 234:51:35.39 NaN NaN 35:03:44.61 16:22:40.81
27 134217728 NaN NaN NaN NaN NaN NaN NaN 64:41:55.09 29:13:48.12

Hardware Resources

GPU-STOMP: These results are reproduced from the original Matrix Profile II paper - NVIDIA Tesla K80 (contains 2 GPUs) and serves as the performance benchmark to compare against.

STUMP.2: stumpy.stump executed with 2 CPUs in Total - 2x Intel(R) Xeon(R) CPU E5-2650 v4 @ 2.20GHz processors parallelized with Numba on a single server without Dask.

STUMP.16: stumpy.stump executed with 16 CPUs in Total - 16x Intel(R) Xeon(R) CPU E5-2650 v4 @ 2.20GHz processors parallelized with Numba on a single server without Dask.

STUMPED.128: stumpy.stumped executed with 128 CPUs in Total - 8x Intel(R) Xeon(R) CPU E5-2650 v4 @ 2.20GHz processors x 16 servers, parallelized with Numba, and distributed with Dask Distributed.

STUMPED.256: stumpy.stumped executed with 256 CPUs in Total - 8x Intel(R) Xeon(R) CPU E5-2650 v4 @ 2.20GHz processors x 32 servers, parallelized with Numba, and distributed with Dask Distributed.

GPU-STUMP.1: stumpy.gpu_stump executed with 1x NVIDIA GeForce GTX 1080 Ti GPU, 512 threads per block, 200W power limit, compiled to CUDA with Numba, and parallelized with Python multiprocessing

GPU-STUMP.2: stumpy.gpu_stump executed with 2x NVIDIA GeForce GTX 1080 Ti GPU, 512 threads per block, 200W power limit, compiled to CUDA with Numba, and parallelized with Python multiprocessing

GPU-STUMP.DGX1: stumpy.gpu_stump executed with 8x NVIDIA Tesla V100, 512 threads per block, compiled to CUDA with Numba, and parallelized with Python multiprocessing

GPU-STUMP.DGX2: stumpy.gpu_stump executed with 16x NVIDIA Tesla V100, 512 threads per block, compiled to CUDA with Numba, and parallelized with Python multiprocessing

Running Tests

Tests are written in the tests directory and processed using PyTest and requires coverage.py for code coverage analysis. Tests can be executed with:

./test.sh

Python Version

STUMPY supports Python 3.7+ and, due to the use of unicode variable names/identifiers, is not compatible with Python 2.x. Given the small dependencies, STUMPY may work on older versions of Python but this is beyond the scope of our support and we strongly recommend that you upgrade to the most recent version of Python.

Getting Help

First, please check the discussions and issues on Github to see if your question has already been answered there. If no solution is available there feel free to open a new discussion or issue and the authors will attempt to respond in a reasonably timely fashion.

Contributing

We welcome contributions in any form! Assistance with documentation, particularly expanding tutorials, is always welcome. To contribute please fork the project, make your changes, and submit a pull request. We will do our best to work through any issues with you and get your code merged into the main branch.

Citing

If you have used this codebase in a scientific publication and wish to cite it, please use the Journal of Open Source Software article.

S.M. Law, (2019). STUMPY: A Powerful and Scalable Python Library for Time Series Data Mining. Journal of Open Source Software, 4(39), 1504.
@article{law2019stumpy,
  title={{STUMPY: A Powerful and Scalable Python Library for Time Series Data Mining}},
  author={Law, Sean M.},
  journal={{The Journal of Open Source Software}},
  volume={4},
  number={39},
  pages={1504},
  year={2019}
}

References

Yeh, Chin-Chia Michael, et al. (2016) Matrix Profile I: All Pairs Similarity Joins for Time Series: A Unifying View that Includes Motifs, Discords, and Shapelets. ICDM:1317-1322. Link

Zhu, Yan, et al. (2016) Matrix Profile II: Exploiting a Novel Algorithm and GPUs to Break the One Hundred Million Barrier for Time Series Motifs and Joins. ICDM:739-748. Link

Yeh, Chin-Chia Michael, et al. (2017) Matrix Profile VI: Meaningful Multidimensional Motif Discovery. ICDM:565-574. Link

Zhu, Yan, et al. (2017) Matrix Profile VII: Time Series Chains: A New Primitive for Time Series Data Mining. ICDM:695-704. Link

Gharghabi, Shaghayegh, et al. (2017) Matrix Profile VIII: Domain Agnostic Online Semantic Segmentation at Superhuman Performance Levels. ICDM:117-126. Link

Zhu, Yan, et al. (2017) Exploiting a Novel Algorithm and GPUs to Break the Ten Quadrillion Pairwise Comparisons Barrier for Time Series Motifs and Joins. KAIS:203-236. Link

Zhu, Yan, et al. (2018) Matrix Profile XI: SCRIMP++: Time Series Motif Discovery at Interactive Speeds. ICDM:837-846. Link

Yeh, Chin-Chia Michael, et al. (2018) Time Series Joins, Motifs, Discords and Shapelets: a Unifying View that Exploits the Matrix Profile. Data Min Knowl Disc:83-123. Link

Gharghabi, Shaghayegh, et al. (2018) "Matrix Profile XII: MPdist: A Novel Time Series Distance Measure to Allow Data Mining in More Challenging Scenarios." ICDM:965-970. Link

Zimmerman, Zachary, et al. (2019) Matrix Profile XIV: Scaling Time Series Motif Discovery with GPUs to Break a Quintillion Pairwise Comparisons a Day and Beyond. SoCC '19:74-86. Link

Akbarinia, Reza, and Betrand Cloez. (2019) Efficient Matrix Profile Computation Using Different Distance Functions. arXiv:1901.05708. Link

Kamgar, Kaveh, et al. (2019) Matrix Profile XV: Exploiting Time Series Consensus Motifs to Find Structure in Time Series Sets. ICDM:1156-1161. Link

License & Trademark

STUMPY
Copyright 2019 TD Ameritrade. Released under the terms of the 3-Clause BSD license.
STUMPY is a trademark of TD Ameritrade IP Company, Inc. All rights reserved.
Comments
  • [WIP] Add Top-K Nearest Neighbors  for Normalized Matrix Profile #592

    [WIP] Add Top-K Nearest Neighbors for Normalized Matrix Profile #592

    This PR addresses issue #592. In this PR, we want to extend the function stump and the related ones so that it returns Top-K Nearest Neighbors Matrix Profile (i.e. the k smallest values for each distance profile and their corresponding indices).

    What I have done so far:

    • Wrote a naïve implementation of stump_topk
    • Provided a new unit test for function stump

    Notes: (1) np.searchsort() is used in the naive.stump_topk. Another naive approach can be traversing distance matrix row-by-row, and using np.argpartition() followed by `np.argsort()'.

    (2) I think considering the first k columns in the output of stump_topk is cleaner, and also easier for the user to get access to those top-k values.

    I can/will think about a clean way to change the structure of output just before returning it so that the first four columns becomes the same for all k. However, I think that makes it hard to use the output later in other modules.


    Add To-Do List

    • [x] Add parameter k to stump
    • [x] Add parameter k to stumped
    • [x] Add parameter k to gpu_stump
    • [x] Add parameter k to scrump
    • [x] Add parameter k to stumpi
    • [ ] Run published tutorials to see if they still work with no problem

    Side notes:

    • Add parameter k to non-normalized versions.
    • Check docstrings for functions that require matrix profile P as input. For instance, in stumpy.motifs, we may say something like... "P is (top-1) 1D array matrix profile"
    opened by NimaSarajpoor 328
  • Tutorial Discovering Motifs Under Uniform Scaling

    Tutorial Discovering Motifs Under Uniform Scaling

    Discovering motifs under uniform scaling

    From #85, I add Discovering motifs under uniform scaling tutorial from 3.1 of The Matrix Profile Top Ten paper. Add docs/Tutorial_Matrix_Profile_Top_Ten.ipynb

    It still needs modification to plot, markdown, coding...., but please have a look through and let me know if you find problem.

    Pull Request Checklist

    Below is a simple checklist but please do not hesitate to ask for assistance!

    • [x] Fork, clone, and checkout the newest version of the code
    • [x] Create a new branch
    • [x] Make necessary code changes
    • [ ] Install black (i.e., python -m pip install black or conda install -c conda-forge black)
    • [ ] Install flake8 (i.e., python -m pip install flake8 or conda install -c conda-forge flake8)
    • [ ] Install pytest-cov (i.e., python -m pip install pytest-cov or conda install -c conda-forge pytest-cov)
    • [ ] Run black . in the root stumpy directory
    • [ ] Run flake8 . in the root stumpy directory
    • [ ] Run ./setup.sh && ./test.sh in the root stumpy directory
    • [ ] Reference a Github issue (and create one if one doesn't already exist)
    opened by ken-maeda 135
  • [WIP] Discovering Discords of arbitrary length using MERLIN #417

    [WIP] Discovering Discords of arbitrary length using MERLIN #417

    In this PR, we would like to implement MERLIN algorithm that discovers discords of arbitrary length. Although the MATLAB implementation of the faster version of MERLIN is available on MERLIN: SUPPORT, we, for now, implement the original version as proposed in the MERLIN.

    What I have done so far:

    • Add Introduction
    • Explain the advantage / disadvantage of MatrixProfile for discovering discords
    • Explain two core ideas of MERLIN algorithm
    • Implement the first phase of DRAG (DRAG is the first part of MERLIN)

    NOTE: (1) I already implemented MERLIN algorithm and enhanced it a little bit. Both MERLIN and STUMPY: MatrixProfile gives EXACTLY the same output regarding the discords indices and their distances to their NN. The discord NN indices are the same in almost all cases.

    (2) In terms of performance, MERLIN outperforms STUMPY for long time series.

    opened by NimaSarajpoor 120
  • [WIP] Add Tutorial for Matrix Profile XXI: MERLIN algorithm #Issue 417

    [WIP] Add Tutorial for Matrix Profile XXI: MERLIN algorithm #Issue 417

    Pull Request Checklist

    Below is a simple checklist but please do not hesitate to ask for assistance!

    • [x] Fork, clone, and checkout the newest version of the code
    • [x] Create a new branch
    • [x] Make necessary code changes
    • [x] Install black (i.e., python -m pip install black or conda install -c conda-forge black)
    • [x] Install flake8 (i.e., python -m pip install flake8 or conda install -c conda-forge flake8)
    • [x] Install pytest-cov (i.e., python -m pip install pytest-cov or conda install -c conda-forge pytest-cov)
    • [x] Run black . in the root stumpy directory
    • [x] Run flake8 . in the root stumpy directory
    • [x] Run ./setup.sh && ./test.sh in the root stumpy directory
    • [x] Reference a Github issue (and create one if one doesn't already exist)
    opened by NimaSarajpoor 94
  • [WIP] Add `mmotifs` and `aamp_mmoitfs` Unit Tests

    [WIP] Add `mmotifs` and `aamp_mmoitfs` Unit Tests

    Pull Request Checklist

    Below is a simple checklist but please do not hesitate to ask for assistance!

    • [x] Fork, clone, and checkout the newest version of the code
    • [x] Create a new branch
    • [x] Make necessary code changes
    • [x] Install black (i.e., python -m pip install black or conda install -c conda-forge black)
    • [x] Install flake8 (i.e., python -m pip install flake8 or conda install -c conda-forge flake8)
    • [x] Install pytest-cov (i.e., python -m pip install pytest-cov or conda install -c conda-forge pytest-cov)
    • [x] Run black . in the root stumpy directory
    • [x] Run flake8 . in the root stumpy directory
    • [x] Run ./setup.sh && ./test.sh in the root stumpy directory
    • [x] Reference a Github issue (and create one if one doesn't already exist) #552
    opened by SaVoAMP 89
  • Added Annotation Vectors Tutorial, #177

    Added Annotation Vectors Tutorial, #177

    Added first draft of the Annotation Vectors Tutorial, requested in issue #177, for feedback. The tutorial includes all 4 examples explored in the Matrix Profile V paper (https://www.cs.ucr.edu/~hdau001/guided_motif_search/). Planning to remove 2/3 out of the 4 examples. Let me know which ones I should keep/remove.

    Pull Request Checklist

    Below is a simple checklist but please do not hesitate to ask for assistance!

    • [x] Fork, clone, and checkout the newest version of the code
    • [x] Create a new branch
    • [x] Make necessary code changes
    • [x] Install black (i.e., python -m pip install black or conda install -c conda-forge black)
    • [x] Install flake8 (i.e., python -m pip install flake8 or conda install -c conda-forge flake8)
    • [x] Install pytest-cov (i.e., python -m pip install pytest-cov or conda install -c conda-forge pytest-cov)
    • [x] Run black . in the root stumpy directory
    • [x] Run flake8 . in the root stumpy directory
    • [x] Run ./setup.sh && ./test.sh in the root stumpy directory
    • [x] Reference a Github issue (and create one if one doesn't already exist)
    opened by alvii147 88
  • [WIP] Module for motif and discord discovery

    [WIP] Module for motif and discord discovery

    I gave the motif discovery module a go (issue #184), what do you think? (Ignore all changes outside motifs.py and test_motifs.py, as we discuss this in another PR)

    There are still more tests to be done, but I'm not sure how to approach it yet. Ideally I'd like a naive_k_motifs method.

    opened by mihailescum 81
  • [WIP] Added stump_tiles module (#248)

    [WIP] Added stump_tiles module (#248)

    This is a work-in-progress pull request addressing issue #248, i.e. implementation of a method that reduces cache misses while computing the Matrix Profile using stump.

    How it works right now

    Let us first briefly explore how stump works right now and what's wrong with it.

    Consider a time series of length 20 and a window of 6. Then we know the distance matrix will be a 15 x 15 matrix (20 - 6 + 1 = 15). Furthermore, the exclusion zone will be ±2 (np.ceil(6 / 4) = 2). Thus the distance matrix will look something like this:

    Empty Distance Matrix

    The grey area is the exclusion zone.

    Currently, if this time series and window are passed into stump, each of the diagonals in the matrix will be processed one by one:

    stump Matrix

    The traversal will be along the yellow dividers.

    The benefit with this method is the benefit we get from computing by diagonals. Computing each distance is a lot simpler given the distance from the previous index in the diagonal. For eg, once we compute the distance for point (3, 0), we can use it to calculate the distance for point (4, 1).

    The issue with this is, the cache is more likely to store points that are closer to each other, and so traversing an entire diagonal is likely to cause too many cache misses.

    How we want it to work

    While traversing diagonally is certainly the right approach, traversing entire diagonals will negatively affect performance. Instead, we want to split the matrix into smaller tiles, each of which will be divides into groups of diagonals.

    Suppose the tile size is set to 4 and the number of diagonals to be iterated together is set to 2. Then, the distance matrix will be divided like this:

    Tiles Matrix

    The matrix is split into 4 x 4 tiles (except near the edges). Tiles with blue borders indicate that there are distances to traverse within those tiles, tiles with red borders indicate that we should skip those tiles as there are no distances to traverse within them. Further more, each of the diagonals within the blue tiles are split into groups of 2 (or less). Each diagonal groups are traversed together.

    For example, if we were to traverse the tile colored light pink, we would do so in the following order:

    (8, 4)
    (8, 5)
    (9, 5)
    (9, 6)
    (10, 6)
    (10, 7)
    (11, 7)
    (9, 4)
    (10, 4)
    (10, 5)
    (11, 5)
    (11, 6)
    (11, 4)
    

    What's done so far

    The changes in the alvii147/cache_optimization branch is the first step to accomplishing this.

    Two new functions were added to core.py, _get_tiles and _get_tiles_ranges, and a new module was added named stump_tiles.py.

    core._get_tiles

    _get_tiles(m, n_A, n_B, diags, tile_size)
    
    Parameters
    ----------
    m : int
        Window size
    
    n_A : ndarray
        The length of time series `T_A`
    
    n_B : ndarray
        The length of time series `T_B`
    
    diags : ndarray
        The diagonal indices of interest
    
    tile_size : int
        Maximum length of each tile
    

    _get_tiles can be used to split the distance matrix into tiles of a given size. It returns tiles, an array of 2-column arrays, with each element representing each tile. The contents of each 2-column array are described below.

    2-column array contents:
    
    [ y_offset                x_offset            ]
    [tile_height              tile_width          ]
    [lower_diagonal_index     upper_diagonal_index]
    [tile_weight              tile_validity       ]
    
    x_offset, y_offset: position of the tile with respect to the distance matrix
    tile_height, tile_width: dimensions of the tile
    lower_diagonal_index, upper_diagonal_index: range of diagonals to be traversed within the tile
    tile_weight: number of distances to be computed within the tile
    tile_validity: 0 if no distances within tile are to be computed, 1 otherwise
    

    The first 4 tiles of the distance matrix considered above should return the following result:

    [[ 0  0]
     [ 4  4]
     [ 3  4]
     [ 1  1]]
    
    [[ 0  4]
     [ 4  4]
     [-1  4]
     [13  1]]
    
    [[ 0  8]
     [ 4  4]
     [-3  4]
     [16  1]]
    
    [[ 0 12]
     [ 4  3]
     [-3  2]
     [12  1]]
    
    ...
    

    core._get_tiles_ranges

    _get_tiles_ranges(tiles, n_threads)
    
    Split given `tiles` into `n_threads`.
    
    Parameters
    ----------
    tiles : ndarray
        An array of two column arrays representing each tile
    
    n_threads : int
        Number of threads to split the tiles into
    
    Returns
    -------
    tiles_ranges : ndarray
        A two-dimensional array representing tile indices for each thread
    

    _get_tiles_ranges can be used to split the tiles that we obtain from _get_tiles into n_threads given threads. This is done by sorting the tiles in descending order of tile_weight, then assigning them one by one to each thread. Once we reach the end of the thread, we keep assigning the tiles to the threads in reverse order.

    For example, suppose we have tiles of weights in descending order [7, 6, 5, 3, 2, 1] and we have 3 threads to divide these into. We start by assigning 7, 6, and 5 to the first three threads respectively. Then the third thread gets 3, second thread gets 2, and first thread gets 1. So the division between the threads would look something like this:

    First thread: [7 1]
    Second thread: [6 2]
    Third thread: [5 3]
    

    This way, the workload is most equally divided.

    If we were to run _get_tiles on the previously described example, and then divide those tiles into 3 threads using _get_tiles_ranges, we would obtain the following array, where each row are the indices of the tiles assigned to each thread:

    [[ 2, 11, 10, 13, 12, -1]
     [ 6,  3,  5, 14,  9, -1]
     [ 1,  7,  0, 15,  8,  4]]
    

    NOTE: -1 is just a blank slot.

    stump_tiles

    The stump_tiles module is a modified version of stump. While stump calls _stump which calls _compute_diagonal, stump_tiles calls _stump_tiles, which calls _compute_tiles.

    _stump_tiles will call core._get_tiles and core._get_tiles_ranges to get tiles data and pass each group of tiles to _compute_tiles in a single thread. _compute_tiles will process the given tiles and divide each tile into "chunks" of tiles that are to be processed together.

    The default tile size, STUMPY_TILE_SIZE and the default number of diagonal to traverse together, STUMPY_DIAGONALS_CHUNK_SIZE are current defined in config.py.

    ...
    STUMPY_TILE_SIZE = 1000
    STUMPY_DIAGONALS_CHUNK_SIZE = 100


    Testing

    The only testing module added so far is test_stump_tiles.py, which is copied over and modified from test_stump.py. Use the following command to run them:

    export NUMBA_DISABLE_JIT=1
    export NUMBA_ENABLE_CUDASIM=1
    py.test -x -W ignore::RuntimeWarning -W ignore::DeprecationWarning tests/test_stump_tiles.py
    
    unset NUMBA_DISABLE_JIT
    unset NUMBA_ENABLE_CUDASIM
    py.test -x -W ignore::RuntimeWarning -W ignore::DeprecationWarning tests/test_stump_tiles.py
    

    All test cases in test_stump_tiles are currently PASSING.

    Performance

    Currently stump_tiles performs very poorly on relatively smaller time series, and marginally faster on relatively larger ones. Outlined below are the performances comparisons stump and stump_tiles for different time series lengths.

    Time Series Length | Window Size m | stump Performance (seconds) | stump_tiles Performance (seconds) | Percentage Improvement --- | --- | --- | --- | --- 1000 | 10 | 0.016 | 0.016 | 0.0% 2500 | 10 | 0.016 | 0.031 | -100.0% 5000 | 10 | 0.06 | 0.078 | -30.77% 10000 | 10 | 0.269 | 0.219 | 18.61% 25000 | 10 | 1.533 | 1.366 | 10.91% 50000 | 10 | 6.262 | 5.206 | 16.87% 100000 | 10 | 25.189 | 20.589 | 18.27% 200000 | 10 | 104.818 | 84.124 | 19.74% 250000 | 10 | 164.197 | 130.789 | 20.35%

    You may use the following script for testing performance:

    import stumpy
    import numpy as np
    import numpy.testing as npt
    import time
    
    def performance_test(m, ts_len):
        ts = np.random.rand(ts_len)
    
        print('\nTime series length:', ts_len)
        print('Window length:', m)
    
        time_elapsed = time.time()
        stump_mp = stumpy.stump(ts, m=m)
        time_elapsed = time.time() - time_elapsed
        print('stump performance (seconds):', time_elapsed)
    
        time_elapsed = time.time()
        stump_tiles_mp = stumpy.stump_tiles(ts, m=m)
        time_elapsed = time.time() - time_elapsed
        print('stump_tiles performance (seconds):', time_elapsed)
    
        npt.assert_almost_equal(stump_tiles_mp, stump_mp)
    
    if __name__ == "__main__":
        stumpy.stump(np.random.rand(1000), m=200)
        stumpy.stump_tiles(np.random.rand(1000), m=200)
    
        parameters = (
            (10, 1000),
            (10, 2500),
            (10, 5000),
            (100, 10000),
            (100, 100000),
            (100, 200000),
            (100, 250000),
        )
        for param in parameters:
            performance_test(*param)
    

    Note that the performance may vary with the values of STUMPY_TILE_SIZE and STUMPY_DIAGONALS_CHUNK_SIZE, as well as with different systems.

    Okay, but what now?

    There's still a lot to do, here are a few things that come to mind.

    Time different components

    Use the time module to time different functions that we call, namely _get_tiles, _get_tiles_ranges and _compute_tiles, find out where exactly we lose time. If any of the components take time that is exponentially increasing with the number of distances, that's a good place for possible optimization.

    Optimize _get_tiles_ranges

    I am almost certain _get_tiles_ranges can be simplified. Currently this function sorts the tiles by weight, which is very expensive and may not be worth it. One thing to remember, the results of _get_tiles_ranges need not be perfect, the tiles don't need to be perfectly equally split among the threads. There's no point in dividing it perfectly if we spend a lot of time doing it. A roughly equal division is also good enough if it saves time.

    Optimize _compute_tiles

    I will also not be surprised if _compute_tiles isn't perfectly optimized. There may be room for improvement with the way the iterations are done.

    Find good values for STUMPY_TILE_SIZE and STUMPY_DIAGONALS_CHUNK_SIZE

    This is a tough one, since it's system dependent. Section 4.2.2 of the Time Series Analysis with Matrix Profile on HPC Systems Paper may help with this.

    Make the code NumPy and Numba friendly

    Some places may use native Python functions, such as range. These should be replaced with NumPy equivalents, such as np.arange.

    opened by alvii147 69
  • Consensus Motifs: Ostinato algorithm; most central motif; reproduce Fig 1, 2, 9 from paper Matrix Profile XV

    Consensus Motifs: Ostinato algorithm; most central motif; reproduce Fig 1, 2, 9 from paper Matrix Profile XV

    This uses the mtDNA example. Ostinato transcribed from table 2 in paper. Performance is really slow.

    resolves #277, resolves #278

    Pull Request Checklist

    Below is a simple checklist but please do not hesitate to ask for assistance!

    • [x] Fork, clone, and checkout the newest version of the code
    • [x] Create a new branch
    • [x] Make necessary code changes
    • [x] Install black (i.e., python -m pip install black or conda install black)
    • [x] Install flake8 (i.e., python -m pip install flake8 or conda install flake8)
    • [x] Install pytest-cov (i.e., python -m pip install pytest-cov or conda install pytest-cov)
    • [x] Run black . in the root stumpy directory
    • [x] Run flake8 . in the root stumpy directory
    • [x] Run ./setup.sh && ./test.sh in the root stumpy directory
    • [x] Reference a Github issue (and create one if one doesn't already exist)
    opened by DanBenHa 58
  • Add M-dimensional Motif Discovery

    Add M-dimensional Motif Discovery

    Given that there is interest for 1-D discord/motif search, it may be useful to have M-dimensional motif/discord search capabilities.

    According to the last paragraph in Section IV E of the mSTAMP paper:

    In the case where multiple semantically meaningful k-dimensional motifs are presented in the multidimensional time series (e.g., Fig. 5), we can just interactively apply the MDL-based method to discover the motif. There are two steps in each iteration: 1) apply the MDL-based method to find the k-dimensional motif with the minimum bit size and 2) remove the found k-dimensional motif by replacing the matrix profile values of the found motif (and its trivial match) to infinity. If we apply the two steps above to the time series shown in Fig. 5, the 3-dimensional motif would be discovered in the first iteration, and the 2-dimensional motif would be discovered in the second iteration. In terms of the terminal condition for the iterative method, it can be either be an input for the user or a more advanced technique could be applied. Due to space limitations, we will have to leave the discussion on termination condition to future works. An example of applying such iterative algorithm on real-world physical activity monitoring time series is shown in Section V.E.

    So, this means that it is possible to find different motifs at the same index location but with a different subset of dimensions!

    enhancement help wanted 
    opened by seanlaw 52
  • Unsigned Integer Indexing Optimizations for STUMP & AAMP (#658)

    Unsigned Integer Indexing Optimizations for STUMP & AAMP (#658)

    Added my first attempts at optimizing stump using unsigned integer indexing. I added a temporarity stumpy.stump_uint module, which (if successfully optimized) may replace stump. But I haven't had too much luck, maybe someone could help me out here. Here's what I've done so far and its results:

    Time series length | window size | stump mean execution time | stump_uint mean execution time | percentage improvement --- | --- | --- | --- | --- 1000 | 10 | 0.00966 | 0.01066 | -10.35% 2500 | 10 | 0.02866 | 0.02933 | -2.323% 5000 | 10 | 0.079 | 0.095 | -20.252% 10000 | 100 | 0.27566 | 0.30233 | -9.674% 100000 | 100 | 26.511 | 27.163 | -2.458% 100000 | 5000 | 25.706 | 27.825 | -8.245% 200000 | 100 | 112.324 | 108.871 | 3.074% 200000 | 5000 | 105.614 | 104.584 | 0.976% 250000 | 100 | 169.058 | 169.176 | -0.07%

    Doesn't look like there's much of a difference just yet, but I'm nearly certain this is just me optimizing the wrong parts. Let me know if you have feedback, feel free to give this a shot yourself.

    opened by alvii147 50
  • Add (Experimental) Ray Distributed Support

    Add (Experimental) Ray Distributed Support

    See this discussion

    Currently, STUMPY is poised to accept/handle a ray distributed cluster to compute a matrix profile. This would be purely experimental but it should be possible with a little work.

    • [ ] stumped/aamped
    • [ ] mstumped/maamped
    • [ ] stimped/aamp_stimped
    • [ ] mpdisted/aampdisted
    • [ ] Add ray example to docstrings
    enhancement 
    opened by seanlaw 0
  • Enhance consistency of the code regarding `T_A` and `T_B`

    Enhance consistency of the code regarding `T_A` and `T_B`

    It seems there are a few inconsistencies in the naming of variables and the way they are being passed to functions.

    (i) In stump, we have this: https://github.com/TDAmeritrade/stumpy/blob/f078424350ab97d02a517da9e29b254309b27574/stumpy/stump.py#L634-L650

    So, T_A corresponds to Q-related variables, and T_B corresponds to T-related variables. However, we see something different in gpu_stump: https://github.com/TDAmeritrade/stumpy/blob/f078424350ab97d02a517da9e29b254309b27574/stumpy/gpu_stump.py#L577-L578

    (ii) Also, the module stump itself shows some sort of inconsistency: https://github.com/TDAmeritrade/stumpy/blob/f078424350ab97d02a517da9e29b254309b27574/stumpy/stump.py#L678-L695

    Since we pass the arguments as _stump(T_A, T_B, ...), we should expect to see the same order in the rest of the arguments. However, this is not true here. As you may have noticed already, M_T (which corresponds to T_B) is located before μ_Q (which corresponds to T_A).


    In my opinion, these inconsistencies occur because we, unintentionally, confuse ourselves by using the T_A, T_B naming and Q and T naming. I think we should usually consider T_A as the sequence that contains queries (hence Q), and T_B is T.

    So, if we do:

    Q, μ_Q, σ_Q = core.preprocess(T_A, m)
    T, M_T, Σ_T = core.preprocess(T_B, m) 
    

    We will be consistent and we will not be confused when we try to be consistent regarding the order of arguments in a function. (Btw, I just provided two examples. I haven't checked all modules yet)

    opened by NimaSarajpoor 2
  • Handle constant subseqs

    Handle constant subseqs

    This PR is an attempt to handle constant subsequences in different modules by using the outcome of core.rolling_isconstant(T, m).

    • [ ] check docstrings
    • [ ] check order of arguments (in private / public APIs)
    • [ ] make sure GPU modules pass all tests when CUDA is enabled
    • [ ] make sure all notebooks are not broken
    opened by NimaSarajpoor 13
  •  if-continue block in `scrump` and `scraamp`

    if-continue block in `scrump` and `scraamp`

    It seems that this

    https://github.com/TDAmeritrade/stumpy/blob/8da71ecec45e947cf448eb3dba8a75c98f5dbfe2/stumpy/scrump.py#L209-L211

    is never executed, and even if it is executed, there will be no change!

    The reason is that: (1) all elements of P_squared are initially set to np.inf and their corresponding indices in I are initially set to -1. (2) P_squared is sorted ascendingly. Thus, after finding at least one finite distance, the value P_squared[thread_idx, i, 0] becomes finite. This is because the smallest distance will be at index 0.

    Therefore, after finding the first finite distance between subseq i and one of its neighbor, the value at P_squared[thread_idx, i, 0] becomes finite. Note that if we never find a finite distance for subseq i, then all values in P_squared[thread_idx, i, :] remain np.inf and their corresponding indices remain -1. Hence, if-block results in no change.

    We have a similar situation in scraamp. see Lines 194-197


    The only drawback is that P_squared is a variable that is passed to the function _prescrump. Hence, we may need to improve the docstring to let user know that the default value in P_squared is np.inf, and its corresponding index in I is -1.

    opened by NimaSarajpoor 5
  • Swamp discussion

    Swamp discussion

    SWAMP/ DTW MP discussion

    This is a pull-request for information exchange for #466. About SWAMP, DTW MP, LB MP and related algorithm to reduce calculation cost.

    Pull Request Checklist

    Below is a simple checklist but please do not hesitate to ask for assistance!

    • [ ] Fork, clone, and checkout the newest version of the code
    • [ ] Create a new branch
    • [ ] Make necessary code changes
    • [ ] Install black (i.e., python -m pip install black or conda install -c conda-forge black)
    • [ ] Install flake8 (i.e., python -m pip install flake8 or conda install -c conda-forge flake8)
    • [ ] Install pytest-cov (i.e., python -m pip install pytest-cov or conda install -c conda-forge pytest-cov)
    • [ ] Run black . in the root stumpy directory
    • [ ] Run flake8 . in the root stumpy directory
    • [ ] Run ./setup.sh && ./test.sh in the root stumpy directory
    • [ ] Reference a Github issue (and create one if one doesn't already exist)
    opened by ken-maeda 9
Releases(v1.11.1)
Owner
TD Ameritrade
Open source by TD Ameritrade
TD Ameritrade
A fast, scalable, high performance Gradient Boosting on Decision Trees library, used for ranking, classification, regression and other machine learning tasks for Python, R, Java, C++. Supports computation on CPU and GPU.

Website | Documentation | Tutorials | Installation | Release Notes CatBoost is a machine learning method based on gradient boosting over decision tree

CatBoost 6.9k Jan 5, 2023
PyPOTS - A Python Toolbox for Data Mining on Partially-Observed Time Series

A python toolbox/library for data mining on partially-observed time series, supporting tasks of forecasting/imputation/classification/clustering on incomplete multivariate time series with missing values.

Wenjie Du 179 Dec 31, 2022
Kats is a toolkit to analyze time series data, a lightweight, easy-to-use, and generalizable framework to perform time series analysis.

Kats, a kit to analyze time series data, a lightweight, easy-to-use, generalizable, and extendable framework to perform time series analysis, from understanding the key statistics and characteristics, detecting change points and anomalies, to forecasting future trends.

Facebook Research 4.1k Dec 29, 2022
An open source framework that provides a simple, universal API for building distributed applications. Ray is packaged with RLlib, a scalable reinforcement learning library, and Tune, a scalable hyperparameter tuning library.

Ray provides a simple, universal API for building distributed applications. Ray is packaged with the following libraries for accelerating machine lear

null 23.3k Dec 31, 2022
K-means clustering is a method used for clustering analysis, especially in data mining and statistics.

K Means Algorithm What is K Means This algorithm is an iterative algorithm that partitions the dataset according to their features into K number of pr

null 1 Nov 1, 2021
A data preprocessing package for time series data. Design for machine learning and deep learning.

A data preprocessing package for time series data. Design for machine learning and deep learning.

Allen Chiang 152 Jan 7, 2023
A python library for easy manipulation and forecasting of time series.

Time Series Made Easy in Python darts is a python library for easy manipulation and forecasting of time series. It contains a variety of models, from

Unit8 5.2k Jan 4, 2023
Open source time series library for Python

PyFlux PyFlux is an open source time series library for Python. The library has a good array of modern time series models, as well as a flexible array

Ross Taylor 2k Jan 2, 2023
A statistical library designed to fill the void in Python's time series analysis capabilities, including the equivalent of R's auto.arima function.

pmdarima Pmdarima (originally pyramid-arima, for the anagram of 'py' + 'arima') is a statistical library designed to fill the void in Python's time se

alkaline-ml 1.3k Dec 22, 2022
A python library for Bayesian time series modeling

PyDLM Welcome to pydlm, a flexible time series modeling library for python. This library is based on the Bayesian dynamic linear model (Harrison and W

Sam 438 Dec 17, 2022
An open-source library of algorithms to analyse time series in GPU and CPU.

An open-source library of algorithms to analyse time series in GPU and CPU.

Shapelets 216 Dec 30, 2022
Automatically build ARIMA, SARIMAX, VAR, FB Prophet and XGBoost Models on Time Series data sets with a Single Line of Code. Now updated with Dask to handle millions of rows.

Auto_TS: Auto_TimeSeries Automatically build multiple Time Series models using a Single Line of Code. Now updated with Dask. Auto_timeseries is a comp

AutoViz and Auto_ViML 519 Jan 3, 2023
MaD GUI is a basis for graphical annotation and computational analysis of time series data.

MaD GUI Machine Learning and Data Analytics Graphical User Interface MaD GUI is a basis for graphical annotation and computational analysis of time se

Machine Learning and Data Analytics Lab FAU 10 Dec 19, 2022
Uber Open Source 1.6k Dec 31, 2022
Nixtla is an open-source time series forecasting library.

Nixtla Nixtla is an open-source time series forecasting library. We are helping data scientists and developers to have access to open source state-of-

Nixtla 401 Jan 8, 2023
Python Extreme Learning Machine (ELM) is a machine learning technique used for classification/regression tasks.

Python Extreme Learning Machine (ELM) Python Extreme Learning Machine (ELM) is a machine learning technique used for classification/regression tasks.

Augusto Almeida 84 Nov 25, 2022
A fast, distributed, high performance gradient boosting (GBT, GBDT, GBRT, GBM or MART) framework based on decision tree algorithms, used for ranking, classification and many other machine learning tasks.

Light Gradient Boosting Machine LightGBM is a gradient boosting framework that uses tree based learning algorithms. It is designed to be distributed a

Microsoft 14.5k Jan 7, 2023
A machine learning toolkit dedicated to time-series data

tslearn The machine learning toolkit for time series analysis in Python Section Description Installation Installing the dependencies and tslearn Getti

null 2.3k Jan 5, 2023
Tool for producing high quality forecasts for time series data that has multiple seasonality with linear or non-linear growth.

Prophet: Automatic Forecasting Procedure Prophet is a procedure for forecasting time series data based on an additive model where non-linear trends ar

Facebook 15.4k Jan 7, 2023