Jupyter Notebook extension leveraging pandas DataFrames by integrating DataTables and ChartJS.

Overview

Jupyter DataTables

Jupyter Notebook extension to leverage pandas DataFrames by integrating DataTables JS.


About

Data scientists and in fact many developers work with pd.DataFrame on daily basis to interpret data to process them. In my typical workflow. The common workflow is to display the dataframe, take a look at the data schema and then produce multiple plots to check the distribution of the data to have a clearer picture, perhaps search some data in the table, etc...

What if those distribution plots were part of the standard DataFrame and we had the ability to quickly search through the table with minimal effort? What if it was the default representation?

The jupyter-datatables uses jupyter-require to draw the table.


Installation

pip install jupyter-datatables

Usage

import numpy as np
import pandas as pd

from jupyter_datatables import init_datatables_mode

init_datatables_mode()

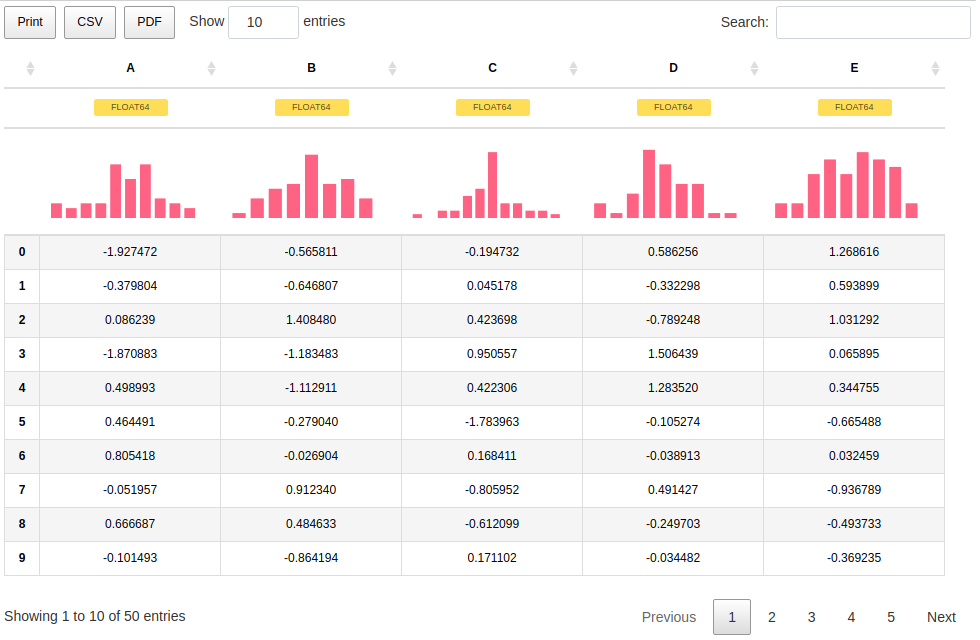
That's it, your default pandas representation will now use Jupyter DataTables!

df = pd.DataFrame(np.abs(np.random.randn(50, 5)), columns=list(string.ascii_uppercase[:5]))

Jupyter Datatables table representation


In most cases, you don't need to worry too much about the size of your data. Jupyter DataTables calculates required sample size based on a confidence interval (by default this would be 0.95) and margin of error and ceils it to the highest 'smart' value.

For example, for a data containing 100,000 samples, given 0.975 confidence interval and 0.02 margin of error, the Jupyter DataTables would calculate that 3044 samples are required and it would round it up to 4000.

Jupyter Datatables long table sample size

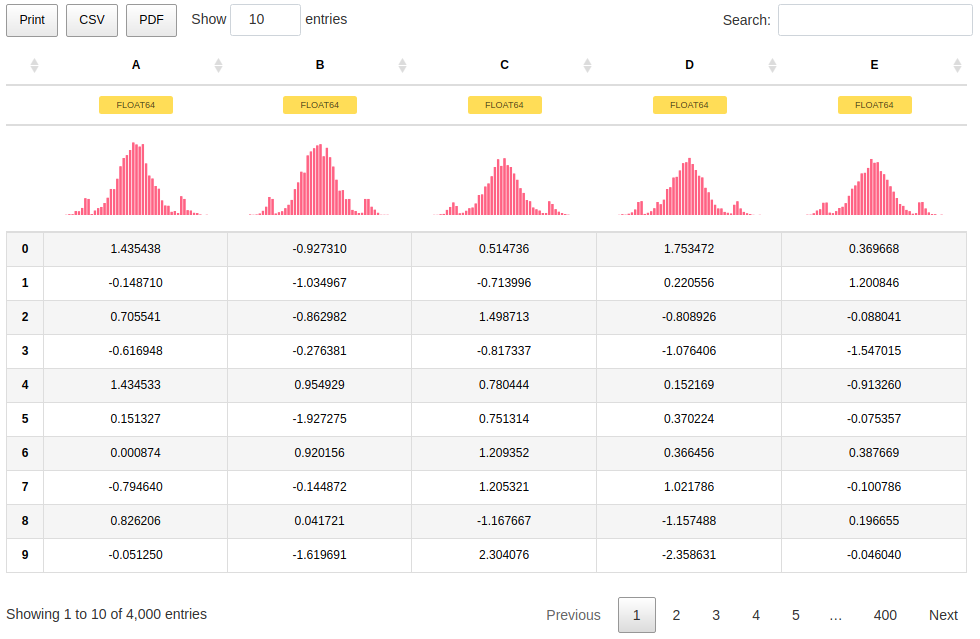
With additional note:

Sample size: 4,000 out of 100,000


We can also handle wide tables with ease.

df = pd.DataFrame(np.abs(np.random.randn(50, 20)), columns=list(string.ascii_uppercase[:20]))

Jupyter Datatables wide table representation


As per 0.3.0, there is a support for interactive tooltips:

Jupyter Datatables wide table representation

And also support for custom indices including Date type:

dft = pd.DataFrame({'A': np.random.rand(5),
                    'B': [1, 1, 3, 2, 1],
                    'C': 'This is a very long sentence that should automatically be trimmed',
                    'D': [pd.Timestamp('20010101'), pd.Timestamp('20010102'), pd.Timestamp('20010103'), pd.Timestamp('20010104'), pd.Timestamp('20010105')],
                    'E': pd.Series([1.0] * 5).astype('float32'),
                    'F': [False, True, False, False, True],
                   })

dft.D = dft.D.apply(pd.to_datetime)
dft.set_index('D', inplace=True)

Jupyter Datatables wide table representation


Current status and future plans:

Check out the Project Board where we track issues and TODOs for our Jupyter tooling!


Author: Marek Cermak [email protected], @AICoE

Comments
  • Extension fails in Anaconda

    Extension fails in Anaconda

    Describe the bug On executing the command init_datatables_mode() on kaggle kernel I get the error as mentioned.

    To Reproduce Steps to reproduce the behavior:

    1. Go to 'Kaggle' and create a 'Notebook'
    2. Install & Import the following in order with Internet access enabled:
    !pip install jupyter-datatables
    !jupyter nbextension install --sys-prefix --py jupyter_require
    !jupyter nbextension enable jupyter-require/extension
    # This Python 3 environment comes with many helpful analytics libraries installed
    # It is defined by the kaggle/python docker image: https://github.com/kaggle/docker-python
    # For example, here's several helpful packages to load in 
    
    import numpy as np # linear algebra
    import pandas as pd # data processing, CSV file I/O (e.g. pd.read_csv)
    # Options for pandas
    pd.options.display.max_columns = 50
    pd.options.display.max_rows = 30
    # Display all cell outputs
    from IPython.core.interactiveshell import InteractiveShell
    InteractiveShell.ast_node_interactivity = 'all'
    from IPython import get_ipython
    ipython = get_ipython()
    # autoreload extension
    if 'autoreload' not in ipython.extension_manager.loaded:
        %load_ext autoreload
    %autoreload 2
    import pandas_profiling as pp
    from jupyter_datatables import init_datatables_mode
    from scipy.stats import boxcox
    
    !pip install fastai==0.7
    
    import sys, fastai
    print(sys.modules['fastai'])
    from fastai.imports import *
    from fastai.structured import *
    
    from sklearn.ensemble import RandomForestClassifier
    from IPython.display import display
    from sklearn import metrics
    import featuretools as ft
    # Input data files are available in the "../input/" directory.
    # For example, running this (by clicking run or pressing Shift+Enter) will list all files under the input directory
    # Any results you write to the current directory are saved as output.
    PATH = "../input/"
    !ls {PATH}
    
    init_datatables_mode()
    
    1. See error
    AttributeError                            Traceback (most recent call last)
    <ipython-input-17-3a17ff6fea07> in <module>
    ----> 1 init_datatables_mode()
    
    /opt/conda/lib/python3.6/site-packages/jupyter_datatables/__init__.py in init_datatables_mode(options, classes)
         60     extensions = config.defaults.extensions
         61 
    ---> 62     require("d3", "https://d3js.org/d3.v5.min")
         63     require("d3-array", "https://d3js.org/d3-array.v2.min")
         64 
    
    /opt/conda/lib/python3.6/site-packages/jupyter_require/core.py in __call__(self, library, path, *args, **kwargs)
         89         :param path: str, path (url) to the library without .js suffix
         90         """
    ---> 91         self.config({library: path}, shim=kwargs.pop('shim', {}))
         92 
         93     @property
    
    /opt/conda/lib/python3.6/site-packages/jupyter_require/core.py in config(self, paths, shim)
        141         self._msg = {'paths': self.__LIBS, 'shim': self.__SHIM}
        142 
    --> 143         self._config_comm.send(data=self._msg)
        144 
        145     def pop(self, lib: str):
    
    AttributeError: 'NoneType' object has no attribute 'send'
    

    Expected behavior Should run successfully

    Desktop (please complete the following information):

    • Kaggle Kernel
    • Mozilla Firefox/Chrome
    • Any version
    enhancement help wanted good first issue question not-a-bug 
    opened by ganesh3 35
  • how to convert datatables to static html successfully

    how to convert datatables to static html successfully

    Thank you for working on this package.

    I could successfully render the iris data frame on jupyter notebook. However, after convert to static html, the data table doesn't appear. Here are my print screens.

    Screen Shot 2019-06-03 at 11 16 32

    Save Notebook Widget State Screen Shot 2019-06-03 at 11 18 25

    Download as HTML(.html) Screen Shot 2019-06-03 at 11 18 35

    It's gone Screen Shot 2019-06-03 at 11 18 07

    good first issue awaits approval 
    opened by orcahmlee 7
  • Usage example fails

    Usage example fails

    Hi I have installed the package according to the recommendations. But the Usage example fails in two places:

    import numpy as np
    import pandas as pd
    
    from jupyter-datatables import init_datatables_mode  #  1) fails here unless I change to underscore: jupyter_datatables
    
    init_datatables_mode()  # fails here with ModuleNotFoundError: No module named 'jupyter_tools'
    

    Full error listing :

    ModuleNotFoundError                       Traceback (most recent call last)
    <ipython-input-2-5555e4cbac8b> in <module>
          2 import pandas as pd
          3 
    ----> 4 from jupyter_datatables import init_datatables_mode
          5 
          6 init_datatables_mode()
    
    /opt/anaconda/envs/py36/lib/python3.6/site-packages/jupyter_datatables/__init__.py in <module>
         36 from pathlib import Path
         37 
    ---> 38 from jupyter_require import require
         39 
         40 from jupyter_require import link_css
    
    /opt/anaconda/envs/py36/lib/python3.6/site-packages/jupyter_require/__init__.py in <module>
        127 
        128 
    --> 129 _handle_ipython()
    
    /opt/anaconda/envs/py36/lib/python3.6/site-packages/jupyter_require/__init__.py in _handle_ipython()
        115         return
        116 
    --> 117     load_ipython_extension(ipython)
        118 
        119 
    
    /opt/anaconda/envs/py36/lib/python3.6/site-packages/jupyter_require/__init__.py in load_ipython_extension(ipython)
         73 def load_ipython_extension(ipython):
         74     """Load the IPython Jupyter Require extension."""
    ---> 75     from .magic import RequireJSMagic
         76 
         77     logger.debug("Loading Jupyter Require extension.")
    
    /opt/anaconda/envs/py36/lib/python3.6/site-packages/jupyter_require/magic.py in <module>
         32 from IPython.core.magic import needs_local_scope
         33 
    ---> 34 from jupyter_tools.utils import sanitize_namespace
         35 
         36 from .core import execute_with_requirements
    
    ModuleNotFoundError: No module named 'jupyter_tools'
    
    bug 
    opened by ipcoder 4
  • extension enabling failed

    extension enabling failed

    Describe the bug when executing the jupyter nbextension install --sys-prefix -py_ jupyter_require got an invalid

    To Reproduce just execute the comand in command line

    Expected behavior A clear and concise description of what you expected to happen.

    text copy C:\Users\xyz>jupyter nbextension install --sys-prefix --py jupyter_require Traceback (most recent call last): File "c:\anaconda3\lib\runpy.py", line 184, in _run_module_as_main "main", mod_spec) File "c:\anaconda3\lib\runpy.py", line 85, in run_code exec(code, run_globals) File "C:\Anaconda3\Scripts\jupyter-nbextension.EXE_main.py", line 9, in File "c:\anaconda3\lib\site-packages\jupyter_core\application.py", line 266, in launch_instance return super(JupyterApp, cls).launch_instance(argv=argv, **kwargs) File "c:\anaconda3\lib\site-packages\traitlets\config\application.py", line 658, in launch_instance app.start() File "c:\anaconda3\lib\site-packages\notebook\nbextensions.py", line 988, in start super(NBExtensionApp, self).start() File "c:\anaconda3\lib\site-packages\jupyter_core\application.py", line 255, in start self.subapp.start() File "c:\anaconda3\lib\site-packages\notebook\nbextensions.py", line 716, in start self.install_extensions() File "c:\anaconda3\lib\site-packages\notebook\nbextensions.py", line 695, in install_extensions **kwargs File "c:\anaconda3\lib\site-packages\notebook\nbextensions.py", line 211, in install_nbextension_python m, nbexts = _get_nbextension_metadata(module) File "c:\anaconda3\lib\site-packages\notebook\nbextensions.py", line 1122, in get_nbextension_metadata m = import_item(module) File "c:\anaconda3\lib\site-packages\traitlets\utils\importstring.py", line 42, in import_item return import(parts[0]) File "c:\anaconda3\lib\site-packages\jupyter_require_init.py", line 34, in from .notebook import link_css File "c:\anaconda3\lib\site-packages\jupyter_require\notebook.py", line 30, in from .core import execute_with_requirements File "c:\anaconda3\lib\site-packages\jupyter_require\core.py", line 178 comm_id=f'config.JupyterRequire#{datetime.timestamp(now)}', ^ SyntaxError: invalid syntax

    Desktop (please complete the following information):

    • OS: win 7 64 bits
    • Browser [e.g. chrome, safari]
    • Version python 3.5.2

    Additional context if i try to continue the other steps and using the function in jupyter notebook got alos an error Traceback (most recent call last):

    File "c:\anaconda3\lib\site-packages\IPython\core\interactiveshell.py", line 3267, in run_code exec(code_obj, self.user_global_ns, self.user_ns)

    File "", line 4, in from jupyter_datatables import init_datatables_mode

    File "c:\anaconda3\lib\site-packages\jupyter_datatables_init_.py", line 202 f"Sample size cannot be larger than length of the table: {sample_size} > {len(df)}" ^ SyntaxError: invalid syntax

    awaits approval not-a-bug technical depth 
    opened by alain2208 3
  • Add a method or ability to deactivate the jupyter-datatable view

    Add a method or ability to deactivate the jupyter-datatable view

    Is your feature request related to a problem? Please describe. The table views are terrific! I have found times, however, where I need to revert back to the old view without all of the graphs/sampling.

    Describe the solution you'd like It would be terrific if there could be a method that reverses init_datatables_mode(). Perhaps a method such as jupyter_datatables.enable_datatables(True)

    enhancement 
    opened by ZachariahRosenberg 2
  • graphs don't automatically change to line-graphs when index is a datetime object

    graphs don't automatically change to line-graphs when index is a datetime object

    Describe the bug graphs don't automatically change to line-graphs when index is a datetime object

    To Reproduce Steps to reproduce the behavior:

    Run the following code in a notebook cell

    import pandas as pd
    import datetime
    # sample time-series data
    my_data = [[datetime.datetime(2019, 8, 12, 18, 22, 10, 542999), 8.55206], [datetime.datetime(2019, 8, 12, 18, 23, 10, 542999), 8.552038], [datetime.datetime(2019, 8, 12, 18, 24, 10, 542999), 8.552016], [datetime.datetime(2019, 8, 12, 18, 25, 10, 542999), 8.551991], [datetime.datetime(2019, 8, 12, 18, 26, 10, 542999), 8.551966], [datetime.datetime(2019, 8, 12, 18, 27, 10, 543999), 8.551938], [datetime.datetime(2019, 8, 12, 18, 28, 10, 542999), 8.551909], [datetime.datetime(2019, 8, 12, 18, 29, 10, 542999), 8.551879], [datetime.datetime(2019, 8, 12, 18, 30, 10, 542999), 8.551847]]
    print(my_data)
    
    # create dataframe with datetime index
    my_df = pd.DataFrame(my_data, columns=["ds","y"]).set_index("ds")
    my_df
    

    Expected behavior The plotted graphs to be line graphs instead of bar graphs

    Version info: jupyter_datatables.__version__=0.3.1

    bug 
    opened by 4n4nd 2
  • Release of version 0.4.0

    Release of version 0.4.0

    Related: #12

    Changelog:

    • Save v0.3.0 notebook in finalized state
    • Optimize GIF
    • Update README.md
    • Add v0.3.0 example notebook
    • Sample size is not deterministic
    • Fallback to other chart kinds
    • [0.3.0-rc0] New minor release candidate
    • Make the datatable static after finalization
    • Create closure around sample size output
    • Change naming schema of the tooltip event
    • Optimize width of the chart canvas
    • [0.3.0-dev2] New dev release
    • Fix incorrect sample size log
    • Histogram data point mapping
    • Fix histogram not returning a chart
    • Get rid of unnecessary console logs
    • [0.3.0-dev1] New dev release
    • Intercative tooltips on DataTable cell hover
    • New graph object: Scatter
    • New graph object: Line
    • [0.3.0-dev0] New minor release
    • Handle datetime index dtype
    • Implicitly format date index
    • Refactor DataTables configuration
    • Pass df index to the chart factory
    • Handle dates if used as values the same way as strings
    • Fix error message
    • New graph object: Histogram
    • New graph object: CategoricalBar
    • Refactor createDataPreview method to be modular
    • Create Bar graph object using chartjs
    • Do not use nlargest and nsmallest for Object dtype
    • Load chartjs library on initialization
    • Bump version
    • Update issue templates
    • Account for outliers in the sample
    • Add issue templates
    • Bump version
    • Handle focus on search field correctly
    • Sort the data before plotting
    • Update module level docstrings
    • Fix typo in README
    • Bump version
    • Include setup files in the sdist
    • Include css and js files in sdist
    • Add banner png and svg images
    • Add image of Jupyter toolbar w/ Finalization button
    • Bump version
    • Re-upload clean jupyter-datatables.png
    • Update README with 0.2.0 features and re-run notebook
    • Update assets and add new GIFs
    • Add notebook demonstrating new features for 0.2.0
    • Bump version
    • Fix sample size computation
    • Bump version
    • Include JavaScript content in package data
    • Refactor and conform to the StandardJS style
    • Optimize the svg-container size for 6 data columns
    • Bump version
    • Add margins to data previews
    • Set fixed size to svg containers
    • Implement data preview for time series data
    • Get rid of the leftover raw url argument in README
    • Add scipy to requirements
    • Bump version
    • Calculate sample size in a more intelligent way
    • Implement data preview for non-numeric dtypes
    • Bump version
    • Fix boolean mapping
    • Map pandas dtypes to DataTables and native JS types
    • Register boolean type detector
    • Bar plot preview for columns with string dtype
    • Refactor previews to work on per-column basis
    • Bump version
    • Update README.md
    • Introduce basic data type inference
    • Do not use dots in class names
    • Update README.md
    • Bump version
    • Remove duplicate notebook and update POC notebook
    • Histogram preview
    • [WIP] Plot histogram preview instead of bar chart
    • Bump version
    • Move JS code to separate script file
    • Require jupyter-require>=0.2.1 for fixed fas icons
    • Fix typos in README installation section
    • Use raw links to images
    • Add MANIFEST.in
    • Rename main.css and move it to the python package
    • Update README.md
    • Require jupyter-require >= 0.2.0
    • Setuptools
    • Add example of wide table
    • Add jupyter-require example image
    • Add POC notebook
    • Update README.md
    • Update README.md
    • Add padding to tables to hide scrollbar in Firefox
    • Fix non-responsive headers and styling issues
    • Add persistent linked scroll event handler
    • [WIP] More fine-grained control over data preview generation
    • Fix CSS not selector
    • Preserve scrolling ability for data preview
    • [XL] Refactor the whole datatable generation process
    • Fix 2-space indentation and add style for dt-buttons
    • Add d3 to required libraries and requirejs config
    • [WIP] Preview for each data column
    • Customizable alignment of body and header cells
    • Fix missing length field and prepend buttons to table
    • [WIP] Buttons
    • Add .gitignore
    • Migrate from jupyter-tools
    opened by CermakM 1
  • Cannot install, `requirements.txt` missing from sdist

    Cannot install, `requirements.txt` missing from sdist

    I am trying to install from the sdist, and I get the following error:

    Traceback (most recent call last):
      File "setup.py", line 17, in <module>
        REQUIREMENTS: list = Path(HERE, 'requirements.txt').read_text().splitlines()
      File "/usr/lib64/python3.7/pathlib.py", line 1189, in read_text
        with self.open(mode='r', encoding=encoding, errors=errors) as f:
      File "/usr/lib64/python3.7/pathlib.py", line 1176, in open
        opener=self._opener)
      File "/usr/lib64/python3.7/pathlib.py", line 1030, in _opener
        return self._accessor.open(self, flags, mode)
    FileNotFoundError: [Errno 2] No such file or directory: 'requirements.txt'
    

    Looking at the archive, I notice that setup.py tries to load the requirements.txt file, but this file is missing from the archive.

    awaits approval 
    opened by toddrme2178 1
  • Interactively select graph kind per column

    Interactively select graph kind per column

    User story As a Jupyter DataTables user, I want to be able to dynamically select a chart type for a certain column so that I have more control over the data and can explore it easily.

    technical: @CermakM

    Acceptance Criteria

    • [x] There is a button which allows users to interactively select kind of the graph to plot per each column of a DataTable
    • [x] The choice only allows to select chart kinds which are valid for the specific column
    • [x] The current graph is marked as active and cannot be selected again to avoid unncecessary redraws
    enhancement task 
    opened by CermakM 0
  • Introduce modular architecture

    Introduce modular architecture

    User Story As a developer and a user, I want to be able to easily configure the plots and eventually even add custom ones so that my DataTable matches my needs and the needs of my audience.

    technical: @CermakM

    Acceptance Criteria

    • [x] it is possible to add custom data type mapping form Jupyter Notebook
    • [x] it is possible to map data types to custom plotting function directly from Jupyter Notebook
    enhancement task 
    opened by CermakM 0
  • Introduce interactive plots with Chart.js

    Introduce interactive plots with Chart.js

    User Story As a developer and a maintainer, I want to be sure that the code is stable and not error-prone. As such, making use of an existing solution which is wildly supported, popular and actively used and accepted by JS community seems like a much better solution.

    Acceptance Criteria

    • [x] Create Bar graph object
    • [x] Create CategoricalBar graph object
    • [x] [optional] Create Line graph object
    • [x] [optional] Create Scatter graph object
    • [x] Create Histogram graph object
    • [x] Create TimeSeries graph object Implemented via Linear with timeseries index
    • [x] ChartJS graphs are persistent
    • [x] [stretch] There is a link between the table and ChartJS tooltip

    References Chart.js is a simple, clean, highly customizable and well documented library. Due to those reasons and its popularity, it was a suitable choice from my perspective.

    enhancement task 
    opened by CermakM 0
  • per dataframe activation

    per dataframe activation

    Datatables extension is fantastic, but for very small dataframe it is not useful and clutter output. It would be very handy, in the same notebook, to use jupyter datatables for some dataframe and not for other instead of globally on or off for every dataframe. It could be a flag per dataframe and a global default value. Thanks.

    enhancement 
    opened by digitalfox 0
  • Error on init_datatables_mode() - Comms haven't been initialized properly

    Error on init_datatables_mode() - Comms haven't been initialized properly

    Trying an install from pip and direct from the repo, I get an error trying to iniitialise the package as per the docs:

    from jupyter_datatables import init_datatables_mode
    
    init_datatables_mode()
    
    ---------------------------------------------------------------------------
    CommError                                 Traceback (most recent call last)
    <ipython-input-1-4bdde0100650> in <module>
          5 from jupyter_datatables import init_datatables_mode
          6 
    ----> 7 init_datatables_mode()
    
    /usr/local/lib/python3.7/site-packages/jupyter_datatables/__init__.py in init_datatables_mode(options, classes)
         94     extensions = config.defaults.extensions
         95 
    ---> 96     require("d3", "https://d3js.org/d3.v5.min")
         97     require("d3-array", "https://d3js.org/d3-array.v2.min")
         98 
    
    /usr/local/lib/python3.7/site-packages/jupyter_require/core.py in __call__(self, library, path, *args, **kwargs)
        111         :param path: str, path (url) to the library without .js suffix
        112         """
    --> 113         self.config({library: path}, shim=kwargs.pop('shim', {}))
        114 
        115     @property
    
    /usr/local/lib/python3.7/site-packages/jupyter_require/core.py in config(self, paths, shim)
        158         """
        159         if not require._is_initialized:
    --> 160             raise CommError("Comms haven't been initialized properly.")
        161 
        162         self.__LIBS.update(paths)
    
    CommError: Comms haven't been initialized properly.. HINT: Try reloading <F5> the window.
    
    bug help wanted awaits approval 
    opened by psychemedia 15
  • [Task] Integration with ipywidgets to reflect dynamic changes

    [Task] Integration with ipywidgets to reflect dynamic changes

    User story As a user, I want to be able to use ipywidgets together with DataTables so that I could dynamically change the content of the table and display it.

    technical: @CermakM

    Acceptance Criteria

    • [ ] DataTables can be used together with ipywidgets to reflect dynamic changes (i.e., using interact to change a parameter)
    • [ ] Demonstrate the usage using interact in an example notebook.

    References #24

    enhancement help wanted task priority 
    opened by CermakM 0
  • Integration with ipywidgets

    Integration with ipywidgets

    Is your feature request related to a problem? Please describe. I am dynamically changing DataFrame with function in ipywidgets, and i really loved your datatables. But it could't work together. Is it possible to do something that it could work together?

    enhancement 
    opened by parallelko 3
  • [Task] Server side processing

    [Task] Server side processing

    User story As a user, I want a quicker response and more efficient data handling so that I could use this extension with bigger data sets.

    technical: @CermakM

    Acceptance Criteria

    • [ ] Data is processed server-side and loaded lazily.
    task 
    opened by CermakM 2
Owner
Marek Čermák
DevOps Engineer @ LivesportTV
Marek Čermák
A GUI for Pandas DataFrames

PandasGUI A GUI for analyzing Pandas DataFrames. Demo Installation Install latest release from PyPi: pip install pandasgui Install directly from Githu

Adam 2.8k Jan 3, 2023
A GUI for Pandas DataFrames

PandasGUI A GUI for analyzing Pandas DataFrames. Demo Installation Install latest release from PyPi: pip install pandasgui Install directly from Githu

Adam 2k Feb 17, 2021
IPython/Jupyter notebook module for Vega and Vega-Lite

IPython Vega IPython/Jupyter notebook module for Vega 5, and Vega-Lite 4. Notebooks with embedded visualizations can be viewed on GitHub and nbviewer.

Vega 335 Nov 29, 2022
Drag’n’drop Pivot Tables and Charts for Jupyter/IPython Notebook, care of PivotTable.js

pivottablejs: the Python module Drag’n’drop Pivot Tables and Charts for Jupyter/IPython Notebook, care of PivotTable.js Installation pip install pivot

Nicolas Kruchten 512 Dec 26, 2022
IPython/Jupyter notebook module for Vega and Vega-Lite

IPython Vega IPython/Jupyter notebook module for Vega 5, and Vega-Lite 4. Notebooks with embedded visualizations can be viewed on GitHub and nbviewer.

Vega 294 Feb 12, 2021
Drag’n’drop Pivot Tables and Charts for Jupyter/IPython Notebook, care of PivotTable.js

pivottablejs: the Python module Drag’n’drop Pivot Tables and Charts for Jupyter/IPython Notebook, care of PivotTable.js Installation pip install pivot

Nicolas Kruchten 419 Feb 11, 2021
Render Jupyter notebook in the terminal

jut - JUpyter notebook Terminal viewer. The command line tool view the IPython/Jupyter notebook in the terminal. Install pip install jut Usage $jut --

Kracekumar 169 Dec 27, 2022
ipyvizzu - Jupyter notebook integration of Vizzu

ipyvizzu - Jupyter notebook integration of Vizzu. Tutorial · Examples · Repository About The Project ipyvizzu is the Jupyter Notebook integration of V

Vizzu 729 Jan 8, 2023
NumPy and Pandas interface to Big Data

Blaze translates a subset of modified NumPy and Pandas-like syntax to databases and other computing systems. Blaze allows Python users a familiar inte

Blaze 3.1k Jan 1, 2023
A high-level plotting API for pandas, dask, xarray, and networkx built on HoloViews

hvPlot A high-level plotting API for the PyData ecosystem built on HoloViews. Build Status Coverage Latest dev release Latest release Docs What is it?

HoloViz 697 Jan 6, 2023
Bokeh Plotting Backend for Pandas and GeoPandas

Pandas-Bokeh provides a Bokeh plotting backend for Pandas, GeoPandas and Pyspark DataFrames, similar to the already existing Visualization feature of

Patrik Hlobil 822 Jan 7, 2023
A high-level plotting API for pandas, dask, xarray, and networkx built on HoloViews

hvPlot A high-level plotting API for the PyData ecosystem built on HoloViews. Build Status Coverage Latest dev release Latest release Docs What is it?

HoloViz 349 Feb 15, 2021
Bokeh Plotting Backend for Pandas and GeoPandas

Pandas-Bokeh provides a Bokeh plotting backend for Pandas, GeoPandas and Pyspark DataFrames, similar to the already existing Visualization feature of

Patrik Hlobil 614 Feb 17, 2021
In-memory Graph Database and Knowledge Graph with Natural Language Interface, compatible with Pandas

CogniPy for Pandas - In-memory Graph Database and Knowledge Graph with Natural Language Interface Whats in the box Reasoning, exploration of RDF/OWL,

Cognitum Octopus 34 Dec 13, 2022
Using SQLite within Python to create database and analyze Starcraft 2 units data (Pandas also used)

SQLite python Starcraft 2 English This project shows the usage of SQLite with python. To create, modify and communicate with the SQLite database from

null 1 Dec 30, 2021
Analytical Web Apps for Python, R, Julia, and Jupyter. No JavaScript Required.

Dash Dash is the most downloaded, trusted Python framework for building ML & data science web apps. Built on top of Plotly.js, React and Flask, Dash t

Plotly 17.9k Dec 31, 2022
Analytical Web Apps for Python, R, Julia, and Jupyter. No JavaScript Required.

Dash Dash is the most downloaded, trusted Python framework for building ML & data science web apps. Built on top of Plotly.js, React and Flask, Dash t

Plotly 13.9k Feb 13, 2021
Analytical Web Apps for Python, R, Julia, and Jupyter. No JavaScript Required.

Dash Dash is the most downloaded, trusted Python framework for building ML & data science web apps. Built on top of Plotly.js, React and Flask, Dash t

Plotly 14k Feb 18, 2021
High performance, editable, stylable datagrids in jupyter and jupyterlab

An ipywidgets wrapper of regular-table for Jupyter. Examples Two Billion Rows Notebook Click Events Notebook Edit Events Notebook Styling Notebook Pan

J.P. Morgan Chase 75 Dec 15, 2022