Twitter COVID-19 Sentiment Analysis
Members: Christopher Bach | Khalid Hamid Fallous | Jay Hirpara | Jing Tang | Graham Thomas | David Wetherhold
Project Overview
This project seeks to identify any correlation between ∆ daily inoculation rates and ∆ twitter sentiment surrounding COVID-19. We chose the pandemic as our topic because of it's societal relevance and implications as an ongoing event.
Analysis Methods
Integrated Database
Extract CSV datasets from data sources (referenced above), transforming and cleaning them with Python, and loading the datasets using Amazon Web Services and PostgreSQL (server/database). This allows us to establish connection with our model, and store static data for use during the project.
- Constructed as an Amazon RDS instance:
- Connection Parameter: (covidsentiment.cqciwtn1qpki.us-east-2.rds.amazonaws.com)
- Accessed with a password upon request
Further transformations:
Machine Learning Model
Next, implementing a natural language processing algorithm allows us to gather our sentiment analysis
- Machine Learning Libraries: nltk, sklearn
- Description of preliminary data preprocessing
-
Load historical twitter covid vaccine data from kaggle.
-
Clean tweets with clean_tweet function(regex), tokenize and get ready for text classification. Also, clean up function for removing hashtags, URL's, mentions, and retweets.
-
Apply Textblob.sentiment.polarity and Textblob.sentiment.subjectivity, ready for sentiment analysis.

-
Apply analyze_sentiment function on tweet texts to label texts with sentiment range from -1 (negative) to 1(positve).

-
Plot top 10 words from postivie and negative-resulted words.
- Description of preliminary feature engineering and preliminary feature selection, including their decision-making process
- Import CountVectorizerfrom sklearn.feature_extraction.text. CountVectorizer is a tool provided by the scikit-learn library in Python. It is used to transform a given text into a vector on the basis of the frequency (count) of each word that occurs in the entire text. The value of each cell is nothing but the count of the word in that particular text sample.
- Fit sentiment texts features with vectorizer, and target sentiment column.
-
Description of how data was split into training and testing sets Splitting into training and testing set so as to evaluate the classifier. The aim is to get an industry standard sample split of 80% train and 20% test.
-
Explanation of model choice, including limitations and benefits
- Naive Bayes classifier is a collection of many algorithms where all the algorithms share one common principle, and that is each feature being classified is not related to any other feature. The algorithm is based on the Bayes theorem and predicts the tag of a text such as a piece of email or newspaper article. It calculates the probability of each tag for a given sample and then gives the tag with the highest probability as output. The multinomial Naive Bayes classifier is suitable for classification with discrete features (e.g., word counts for text classification).Multinomial Naive Bayes algorithm is a probabilistic learning method that is mostly used in Natural Language Processing (NLP).
- Multinomial Naive Bayes classification algorithm tends to be a baseline solution for sentiment analysis task. The basic idea of Naive Bayes technique is to find the probabilities of classes assigned to texts by using the joint probabilities of words and classes.
- Naive Bayes algorithm is only used for textual data classification and cannot be used to predict numeric values. The result of naive bayes model provide statistical sense by predicting how often that certain words with the sentimental labels appear, which does not necessarily indicate the factual attitudes/sentiments towards covid vaccine, and it does not work with regression because it is not numerical data. One of the benefits of Naive Bayes is that if its assumption of the independence of features holds true, it can perform better than other models and requires much less training data.
- Changes of model choice from segment 2 to segment 3
-
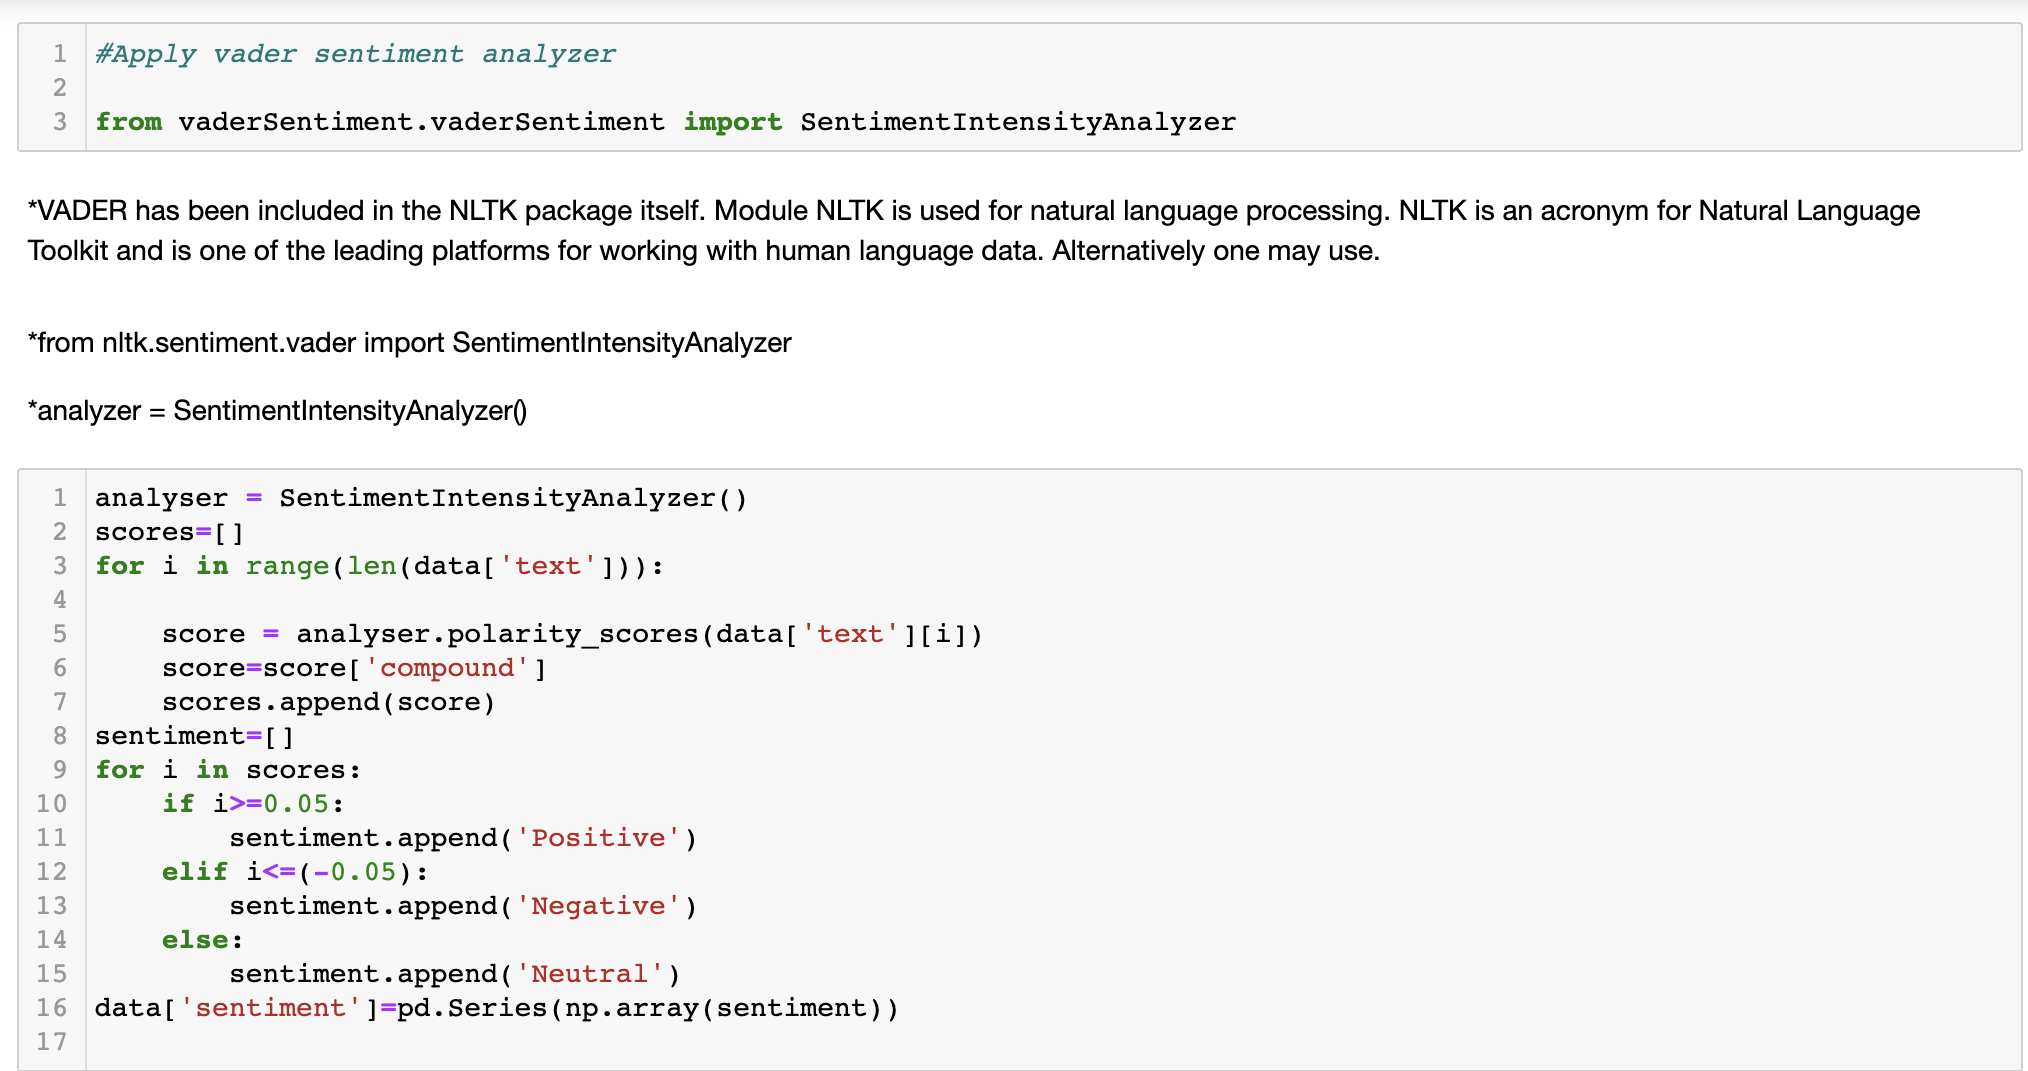
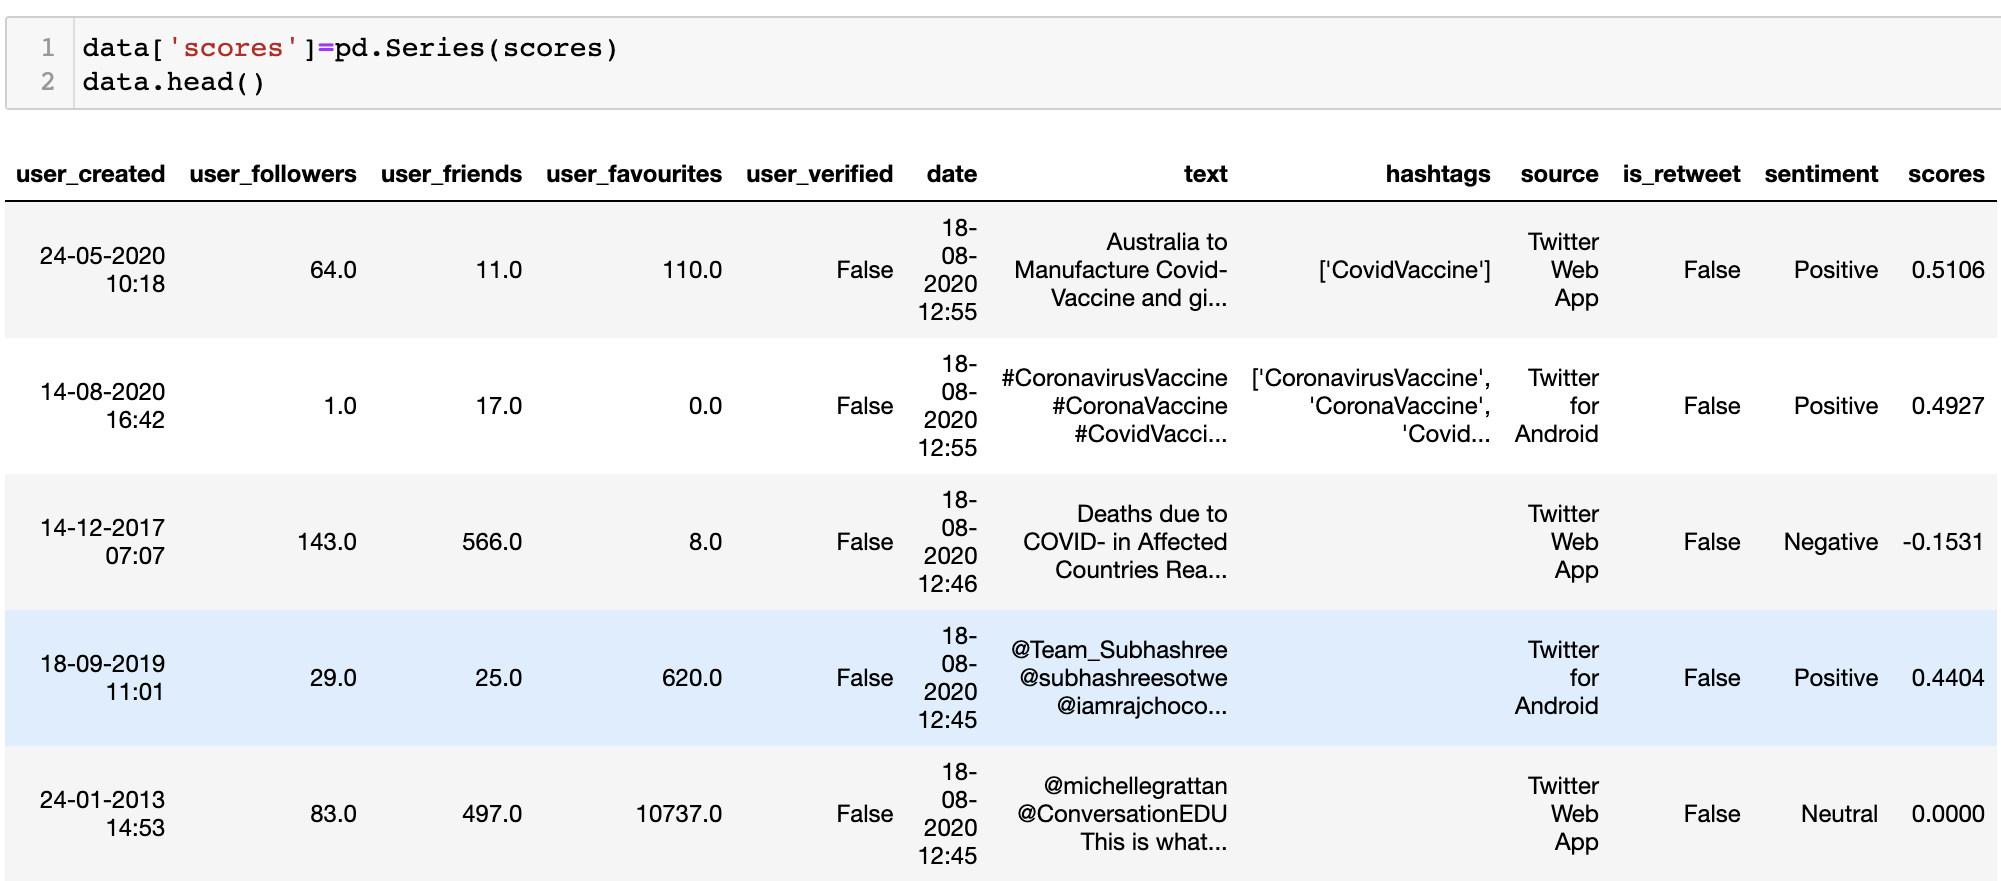
Vader Analysis: VADER (Valence Aware Dictionary and sEntiment Reasoner) is a lexicon and rule-based sentiment analysis tool that is specifically attuned to sentiments expressed in social media. It uses a list of lexical features (e.g. word) which are labeled as positive or negative according to their semantic orientation to calculate the text sentiment. VADER not only tells about the Positivity and Negativity score but also tells us about how positive or negative a sentiment is. VADER Sentiment Analyzer:
-
Solution to limitations: We discovered the most common words appeared in our twitter dataset are associated with covid vaccines because we retrieved the data with covid vaccine as search terms. Textblob Polarity is float which lies in the range of [-1,1] where 1 means positive statement and -1 means a negative statement. Subjective sentences generally refer to personal opinion, emotion or judgment whereas objective refers to factual information. Subjectivity is also a float which lies in the range of [0,1]. We are trying to process text classification with another function to get more accurate sentiment labels on the tweet texts.
- Changes from segment 3 to segment 4
- Added sentiment "NLTK" which is a votes based combined algorithm encompassing multiple natural language processing techniques.
Regression Results

- Initial regressions were positive, with an r^2 value of .29
However, the p value for Textblob was very high, so we removed it:

- with one factor removed, the r^2 was still .29, but the p value was 0.000, indicating excellent results.
However, these correlations were against cumulative administration rates. We disaggregated the cumulation and re-ran the regression with 2 factors:
 2 Factor Regression - Marginal
and the R^2 dropped to close to zero. p-values are corresondingly high.
Dashboard COVID-19 DASHBOARD
- A blueprint for the dashboard is created and includes all of the following:
- Storyboard on Google Slide(s)
- Description of the tool(s) that will be used to create final dashboard
- Description of interactive element(s)
- Selected topic
- Why we selected our topic
- Description of our source of data
- Questions we hope to answer with the data
- Description of the data exploration phase of the project
- Description of the analysis phase of the project
- Limitations and solutions
Challenges and Limitations
Problems
- Facebook, Instagram and TikTok were all considered initially, but did not have the necessary data readily available.
- Some members ran into issues with gaining Academic Twitter accounts to be able to access the Twitter API.
- After gaining access to tweets our original goal of using the location of tweets was not possible due to most tweets not having geotag data
- The Twitter API was very limited to the amount of data we could pull. Alternative dataset will be needed.
- Group ran into a machine learning natural language paradox, where we noticed an issue within our sentiment analysis. When analyzing tweets for Covid-19 Vaccination sentiment (pro/anti-vaccine) when running into a tweet such as “I hate anti-vaxxers”, this would return a negative sentiment when this person is actually pro-vaccine.
- Using academic accounts only allows access back to 7 days of tweets. We could not get twitter's full archive search without having a twitter scholar account.
Solutions
- The group decided to use Twitter since it's API was available after submitting applications.
- Members had to submit extra information to the Twitter developers platform to qualify for academic research accounts
- Due to lack of geodata, the team decided to switch to using twitter sentiment over time, rather than region
- The group decided to use a Kaggle Dataset, which provided us with tweets from December 21, 2020.

 1k Nov 17, 2022

 0 Aug 4, 2021
 1 Apr 3, 2022
 0 Mar 28, 2022
 5 Oct 21, 2022
 148 Dec 26, 2022
 50 Dec 31, 2022
 2.3k Jan 7, 2023

 3.8k Dec 30, 2022
 1 Jan 27, 2022
 12 Oct 15, 2022
 10 Apr 30, 2022
 14 Jan 3, 2023
 20 Dec 12, 2022
 26 Dec 25, 2022
 0 Dec 27, 2021
 7 Mar 12, 2022