Titanic data analysis for python

Overview

Titanic-data-analysis

This Repo is an analysis on Titanic_mod.csv This csv file contains some assumed data of the Titanic ship after sinking This full is done in Python using Numpy

Functionalities we have done:-

  1. Reading a file without numpy
  2. Reading a file using numpy and storing it in numpy array
  3. Finding the occurences and top occurences in the file according to the condition
  4. fare comparisons with the survivors and non survivors
  5. Relation in:- i) Highest value of number of siblings and/or spouses onboard ii) Mean value of parents and/or children onboard iii) 50th-percentile value of fare paid iv) Cheapest non-zero fare paid
  6. Menu driven for Research analysis i. Compute Correlation ii. Ranked List of 20 Oldest Survivors by Passenger Cabin Class Number iii. Ranked List of 20 Female Survivors by Highest Non-Self Family Member Onboard Count and then by Highest fare
You might also like...
Python Project on Pro Data Analysis Track

Udacity-BikeShare-Project: Python Project on Pro Data Analysis Track Basic Data Exploration with pandas on Bikeshare Data Basic Udacity project using

Sentiment analysis on streaming twitter data using Spark Structured Streaming & Python

Sentiment analysis on streaming twitter data using Spark Structured Streaming & Python This project is a good starting point for those who have little

 Project under the certification
Project under the certification "Data Analysis with Python" on FreeCodeCamp

Sea Level Predictor Assignment You will anaylize a dataset of the global average sea level change since 1880. You will use the data to predict the sea

Larch: Applications and Python Library for Data Analysis of X-ray Absorption Spectroscopy (XAS, XANES, XAFS, EXAFS), X-ray Fluorescence (XRF) Spectroscopy and Imaging

Larch: Data Analysis Tools for X-ray Spectroscopy and More Documentation: http://xraypy.github.io/xraylarch Code: http://github.com/xraypy/xraylarch L

Spaghetti: an open-source Python library for the analysis of network-based spatial data

pysal/spaghetti SPAtial GrapHs: nETworks, Topology, & Inference Spaghetti is an open-source Python library for the analysis of network-based spatial d

TE-dependent analysis (tedana) is a Python library for denoising multi-echo functional magnetic resonance imaging (fMRI) data

tedana: TE Dependent ANAlysis TE-dependent analysis (tedana) is a Python library for denoising multi-echo functional magnetic resonance imaging (fMRI)

Driver Analysis with Factors and Forests: An Automated Data Science Tool using Python

Driver Analysis with Factors and Forests: An Automated Data Science Tool using Python 📊

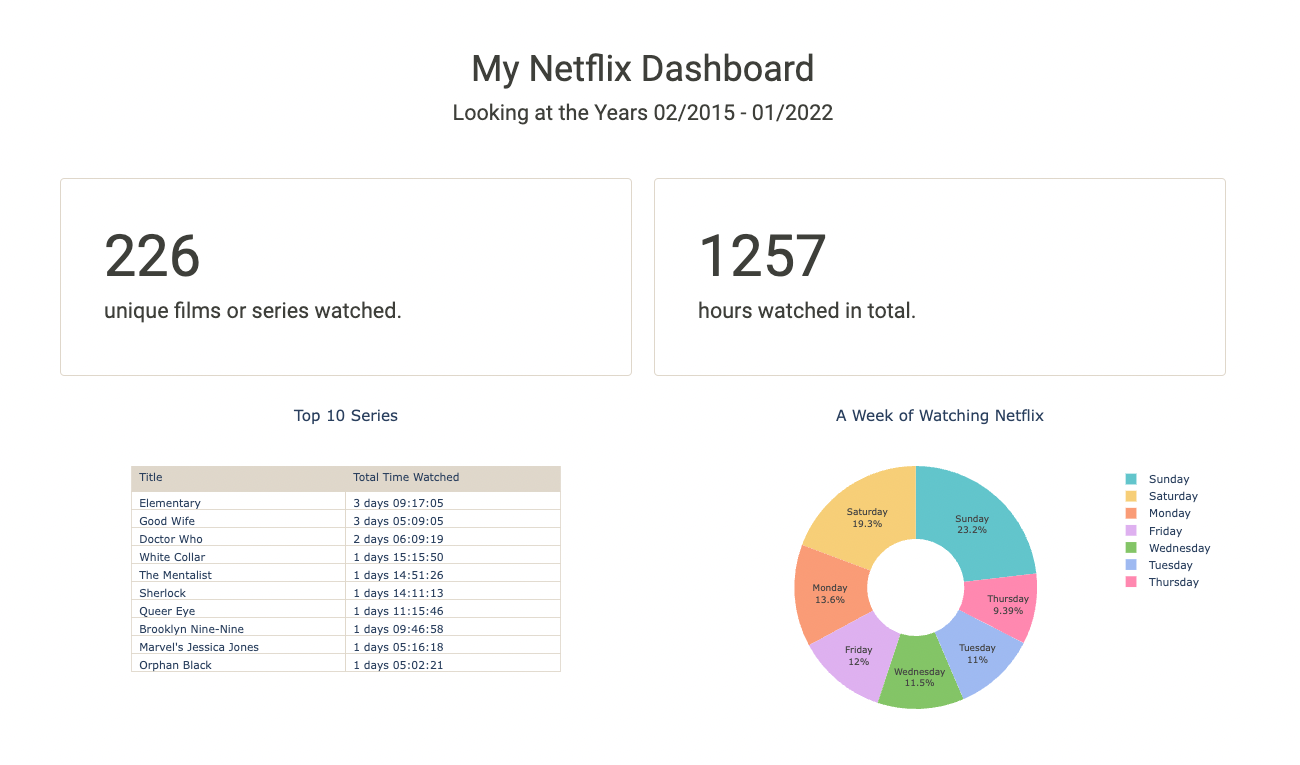
Project: Netflix Data Analysis and Visualization with Python

Project: Netflix Data Analysis and Visualization with Python Table of Contents General Info Installation Demo Usage and Main Functionalities Contribut

Flenser is a simple, minimal, automated exploratory data analysis tool.

Flenser Have you ever been handed a dataset you've never seen before? Flenser is a simple, minimal, automated exploratory data analysis tool. It runs

Owner
Hardik Bhanot
Hardik Bhanot
🧪 Panel-Chemistry - exploratory data analysis and build powerful data and viz tools within the domain of Chemistry using Python and HoloViz Panel.

???? ??. The purpose of the panel-chemistry project is to make it really easy for you to do DATA ANALYSIS and build powerful DATA AND VIZ APPLICATIONS within the domain of Chemistry using using Python and HoloViz Panel.

Marc Skov Madsen 97 Dec 8, 2022
Python data processing, analysis, visualization, and data operations

Python This is a Python data processing, analysis, visualization and data operations of the source code warehouse, book ISBN: 9787115527592 Descriptio

FangWei 1 Jan 16, 2022
A set of functions and analysis classes for solvation structure analysis

SolvationAnalysis The macroscopic behavior of a liquid is determined by its microscopic structure. For ionic systems, like batteries and many enzymes,

MDAnalysis 19 Nov 24, 2022
Tablexplore is an application for data analysis and plotting built in Python using the PySide2/Qt toolkit.

Tablexplore is an application for data analysis and plotting built in Python using the PySide2/Qt toolkit.

Damien Farrell 81 Dec 26, 2022
Repositori untuk menyimpan material Long Course STMKGxHMGI tentang Geophysical Python for Seismic Data Analysis

Long Course "Geophysical Python for Seismic Data Analysis" Instruktur: Dr.rer.nat. Wiwit Suryanto, M.Si Dipersiapkan oleh: Anang Sahroni Waktu: Sesi 1

Anang Sahroni 0 Dec 4, 2021
A data analysis using python and pandas to showcase trends in school performance.

A data analysis using python and pandas to showcase trends in school performance. A data analysis to showcase trends in school performance using Panda

Jimmy Faccioli 0 Sep 7, 2021
A collection of learning outcomes data analysis using Python and SQL, from DQLab.

Data Analyst with PYTHON Data Analyst berperan dalam menghasilkan analisa data serta mempresentasikan insight untuk membantu proses pengambilan keputu

null 6 Oct 11, 2022
DaDRA (day-druh) is a Python library for Data-Driven Reachability Analysis.

DaDRA (day-druh) is a Python library for Data-Driven Reachability Analysis. The main goal of the package is to accelerate the process of computing estimates of forward reachable sets for nonlinear dynamical systems.

null 2 Nov 8, 2021
Python-based Space Physics Environment Data Analysis Software

pySPEDAS pySPEDAS is an implementation of the SPEDAS framework for Python. The Space Physics Environment Data Analysis Software (SPEDAS) framework is

SPEDAS 98 Dec 22, 2022