Driver Analysis with Factors and Forests: An Automated Data Science Tool using Python
📊
Last updated on January 30, 2022 by Thomas J. Nicoletti
I would like to preface this document by stating this is my second major project using Python. From my first project to now, I certainly improved upon my understanding of and proficiency with Python, though I still have a long journey ahead of me. I aim to keep learning more and more everyday, and hope this project provides some benefit to the greater applied social science community.
The purpose of this data mining script is to use random forest classification, in conjunction with factor analysis and other analytic techniques, to automatically yield feature importance metrics and related output for a driver analysis. Driver analysis quantifies the importance of independent variables (i.e., drivers) in predicting some outcome variable. Within this repository is a basic, simulated dataset created by me, containing five independent variables and one outcome variable. I am by no means an expert in simulating datasets, so I encourage everyone to use real-world data as a stress test for this statistical tool.
This tool will communicate with users using simple inputs via the Command Prompt. Once all mandatory and optional inputs are received, the analysis will run and send relevant information to the source folder; this potentially includes text files, images, and data files useful for model comprehension and validation, as well as statistically- and conceptually-informed decision-making. The most useful outputs will include the automatically generated feature importance plot and feature quadrant chart.
💻
Installation and Preparation
Please note that excerpts of code provided below are examples based on the driver.py script. As a self-taught programmer, I suggest reading through my insights, mixing them with a quick Google search and your own experiences, and then delving into the script itself.
For this project, I used Python 3.9, the Microsoft Windows operating system, and Microsoft Excel. As such, these act as the prerequisites for utilizing this repository successfully without any additional troubleshooting. Going forward, please ensure everything you download or install for this project ends up in the correct location (e.g., the same source folder).
Use pip to install relevant packages to the proper source folder using the Command Prompt and correct PATH. For example:
pip install numpy
pip install pandas
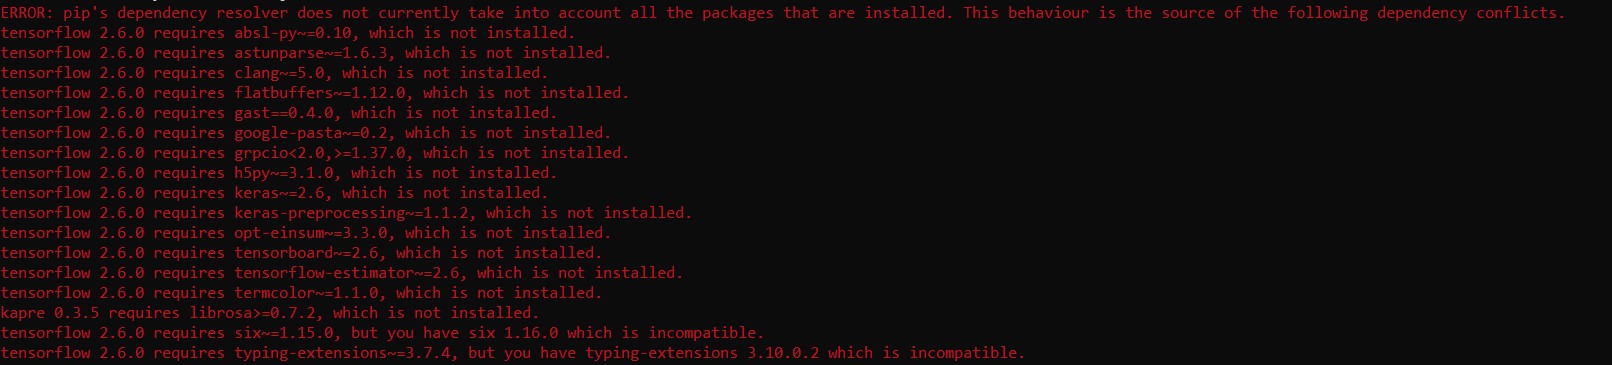
Please be sure to install each of the following packages: easygui, matplotlib, numpy, pandas, seaborn, string, factor_analyzer, scipy, sklearn, and statsmodels. If required, use the first section of the script to determine lacking dependencies, and proceed accordingly.
📑
Script Breakdown
The script begins by calling relevant libraries in Python, as well as defining Mahalanobis distance, which is used to identify multivariate outliers in a later step of this project. Additionally, the Command Prompt will read a simple set of instructions for the user, including important information regarding categorical features, the location of the outcome variable within the dataset, and a required revision for missing data. Furthermore, the script will allow the user to specify a random seed for easy replication of this driver analysis at a later date:
import easygui
import matplotlib.pyplot as plt
import numpy as np
import pandas as pd
...
def mahalanobis(x = None, data = None, cov = None):
	mu = x - np.mean(data)
    ...
	return mah.diagonal()
...
seed = int(input('Please enter your numerical random seed for replication purposes: '))
np.random.seed(seed)
text = open('random_seed.txt', 'w')
The script has an entire section dedicated to understanding your dataset, including a quick process for uploading your data file, removing missing data, adding an outlier status variable, determining the final sample size, classifying variables, and so on:
df = pd.read_csv(easygui.fileopenbox())
df.dropna(inplace = True)
df['Mahalanobis'] = mahalanobis(x = df, data = df.iloc[:, :len(df.columns)], cov = None)
df['PValue'] = 1 - chi2.cdf(df['Mahalanobis'], len(df.columns) - 1)
...
n = df.shape[0]
text = open('sample_size.txt', 'w')
...
x = df.iloc[:, :-1]
y = np.ravel(df.iloc[:, -1])
feat = df.columns[:-1]
mean = np.array(df.describe().loc['mean'][:-1])
The script then checks for relevant statistical assumptions needed before determining if your dataset is appropriate for factor analysis. This includes Bartlett's Test of Sphericity and the Kaiser-Meyer-Olkin Test. Additionally, a scree plot is produced using principal components analysis to assist in factor analysis decision-making. Once all of this is reviewed, the user will provide relevant inputs regarding their driver analysis model:
bart = calculate_bartlett_sphericity(x)
bart = (str(round(bart[1], 2)))
text = open('sphericity.txt', 'w')
...
kmo = calculate_kmo(x)
kmo = (str(round(kmo[1], 2)))
text = open('factorability.txt', 'w')
...
pca = PCA()
pca.fit(x)
comp = np.arange(pca.n_components_)
plt.figure()
When it comes to choosing whether to run random forest classification on the original variables or transformed factors, the above information is critical. The user will be able to decide both A) whether or not to use factor analysis, and B) how many factors should be used in extraction if applicable. Additionally, if the user opts for the factor analysis route, they will also be able to determine whether all the factors or just the highest loading variable per factor should be used (please see lines 139-150 in the script). The following optional factor analysis and mandatory core analyses will run based on user specifications from the previous step:
fa = FactorAnalysis(n_components = factor, max_iter = 3000, rotation = 'varimax')
...
x = fa.transform(x)
...
load = pd.DataFrame(fa.components_.T.round(2), columns = cols, index = feat)
load.to_csv('factor_loadings.csv')
...
vif = pd.Series(variance_inflation_factor(x.values, i) for i in range(x.shape[1]))
vif = pd.DataFrame(np.array(vif.round(2)), columns = ['Variable Inflation Factor'], index = feat)
vif.T.to_csv('variable_inflation_factors.csv')
clf = RandomForestClassifier(n_estimators = 100, criterion = 'gini', max_features = 'auto', bootstrap = True, oob_score = True, class_weight = 'balanced').fit(x, y)
oob = str(round(clf.oob_score_, 2)).ljust(4, '0')
pred = clf.predict_proba(x)
loss = str(round(log_loss(y, pred), 2)).ljust(4, '0')
perf = pd.DataFrame({'Out-of-Bag Score': oob, 'Log Loss': loss}, index = ['Estimate'])
perf.to_csv('model_performance.csv')
Please note, the only current rotation method available in Python for factor analysis is varimax, as far as I know. If another rotation method is preferred, I would opt out of the factor analysis route, or try implementing your own solution from scratch. From these results, the feature importance plot and its respective feature quadrant chart can be graphed and saved automatically to the source folder. This is an especially useful and efficient data visualization tool to help express which variable(s) are most important in predicting your outcome. It also saves you quite a bit of time compared to graphing it yourself!
imp = clf.feature_importances_
sort = np.argsort(imp)
plt.figure()
plt.barh(range(len(sort)), imp[sort], color = 'mediumaquamarine', align = 'center')
plt.title('Feature Importance Plot')
plt.xlabel('Derived Importance →')
...
imps = []
score = []
for i, feat in enumerate(imp[sort]):
  imps.append(round(feat / imp[sort].mean() * 100, 0))
for i, feat in enumerate(mean[sort]):
  score.append(round(feat / mean[sort].mean() * 100, 0))
quad = pd.DataFrame({'Rescaled Observed Score →': score, 'Rescaled Derived Importance →': imps,
  'Feature': x.columns[sort]})
To run the script, I suggest using a batch file located in the source folder as follows:
python driver.py
PAUSE
Although the entire script is not reflected in the above breakdown, this information should prove helpful in getting the user accustomed to what this script aims to achieve. If any additional information and/or explanations are desired, please do not hesitate in reaching out!
📋
Next Steps
Although I feel this project is solid in its current state, I think one area of improvement would fall in the realm of optimizing the script and making it more pythonic. I am also quite interested in hearing feedback from users, including their field of practice, which variables they used for their analyses, and how satisfied they were with this statistical tool overall.
💡
Community Contribution
I am always happy to receive feedback, recommendations, and/or requests from anyone, especially new learners. Please click here for information about the license for this project.
❔
Project Support
Please let me know if you plan to make changes to this project, or adapt the script to a project of your own interest. We can certainly collaborate to make this process as painless as possible!
📚
Additional Resources
- My current work in market research introduced me to the idea of driver analysis and its usefulness; this statistical tool was created with that space in mind, though it is certainly applicable to all applied areas of business and social science
- To learn more about calculating random forest classification in Python, click here to access scikit-learn
- To learn more about calculating factor analysis in Python, click here to access scikit-learn
- For easy-to-use text editing software, check out Sublime Text for Python and Atom for Markdown
 1 Nov 21, 2021
 3.6k Jan 9, 2023
 55 Dec 16, 2022
 18 Dec 23, 2022
 6 Aug 10, 2021

 1 Dec 9, 2021
 1 Dec 17, 2021

 1 Jan 1, 2022
 1 Jan 16, 2022

 293 Dec 29, 2022
 79 Sep 20, 2022
 102 Nov 10, 2022
 49 Nov 28, 2022
 791 Jan 4, 2023
 27 Nov 1, 2022
 1 Feb 11, 2022
 97 Dec 8, 2022
 1 Sep 3, 2022
 3 Oct 30, 2021