PyPassword is a simple follow up to PyPassphrase

Overview

PyPassword

PyPassword is a simple follow up to PyPassphrase. After finishing that project it occured to me that while some may wish to use that option, may not be able to do so due to pre-defined password requirements (for example, spaces not allowed or an arbitrary limit on the number of characters). Therefore, it seemed reasonable to create a more traditional password generator but wrap it also in a GUI frontend with PySimpleGUI.

There is nothing particularly special about this application past its compliment to PyPassphrase. In fact, I will likely merge the two applications so that both options exist in one.

Stay Tuned!

In the meantime, if you choose to use this as a stand-alone password generator keep in mind no attempts are made to make the resulting passwords easier to remember and it is highly recommended that you use a trusted and secure password manager such as Keepass or Linux Pass to store and manage the passwords.

The passwords are generated using the Python string library using lowercase, uppercase, digits and punctuation characters. Which group is used is chosen at random using the Python secrets library. A loop is used to randomize the list of characters and then from that list a random sample is taken that is the length of the password specified.

The result is some truly cyrptic passwords that, if using sufficient length (generally 15 characters or more), will be strong enough for most applications.

Currently only the command line option exists to launch the application and that for only Linux at the moment. To use the application simply download the binary and from the location where it is saved launch a terminal session and run the command ./pypassword. This will launch the GUI frontend.

Screenshots

You might also like...
A simple script that displays pixel-based animation on GitHub Activity

GitHub Activity Animator This project contains a simple Javascript snippet that produces an animation on your GitHub activity tracker. The project als

A simple python tool for explore your object detection dataset

A simple tool for explore your object detection dataset. The goal of this library is to provide simple and intuitive visualizations from your dataset and automatically find the best parameters for generating a specific grid of anchors that can fit you data characteristics

A deceptively simple plotting library for Streamlit

🍅 Plost A deceptively simple plotting library for Streamlit. Because you've been writing plots wrong all this time. Getting started pip install plost

Simple spectra visualization tool for astronomers

SpecViewer A simple visualization tool for astronomers. Dependencies Python = 3.7.4 PyQt5 = 5.15.4 pyqtgraph == 0.10.0 numpy = 1.19.4 How to use py

Simple CLI python app to show a stocks graph performance. Made with Matplotlib and Tiingo.

stock-graph-python Simple CLI python app to show a stocks graph performance. Made with Matplotlib and Tiingo. Tiingo API Key You will need to add your

Simple Inkscape Scripting

Simple Inkscape Scripting Description In the Inkscape vector-drawing program, how would you go about drawing 100 diamonds, each with a random color an

eoplatform is a Python package that aims to simplify Remote Sensing Earth Observation by providing actionable information on a wide swath of RS platforms and provide a simple API for downloading and visualizing RS imagery

An Earth Observation Platform Earth Observation made easy. Report Bug | Request Feature About eoplatform is a Python package that aims to simplify Rem

simple tool to paint axis x and y

simple tool to paint axis x and y

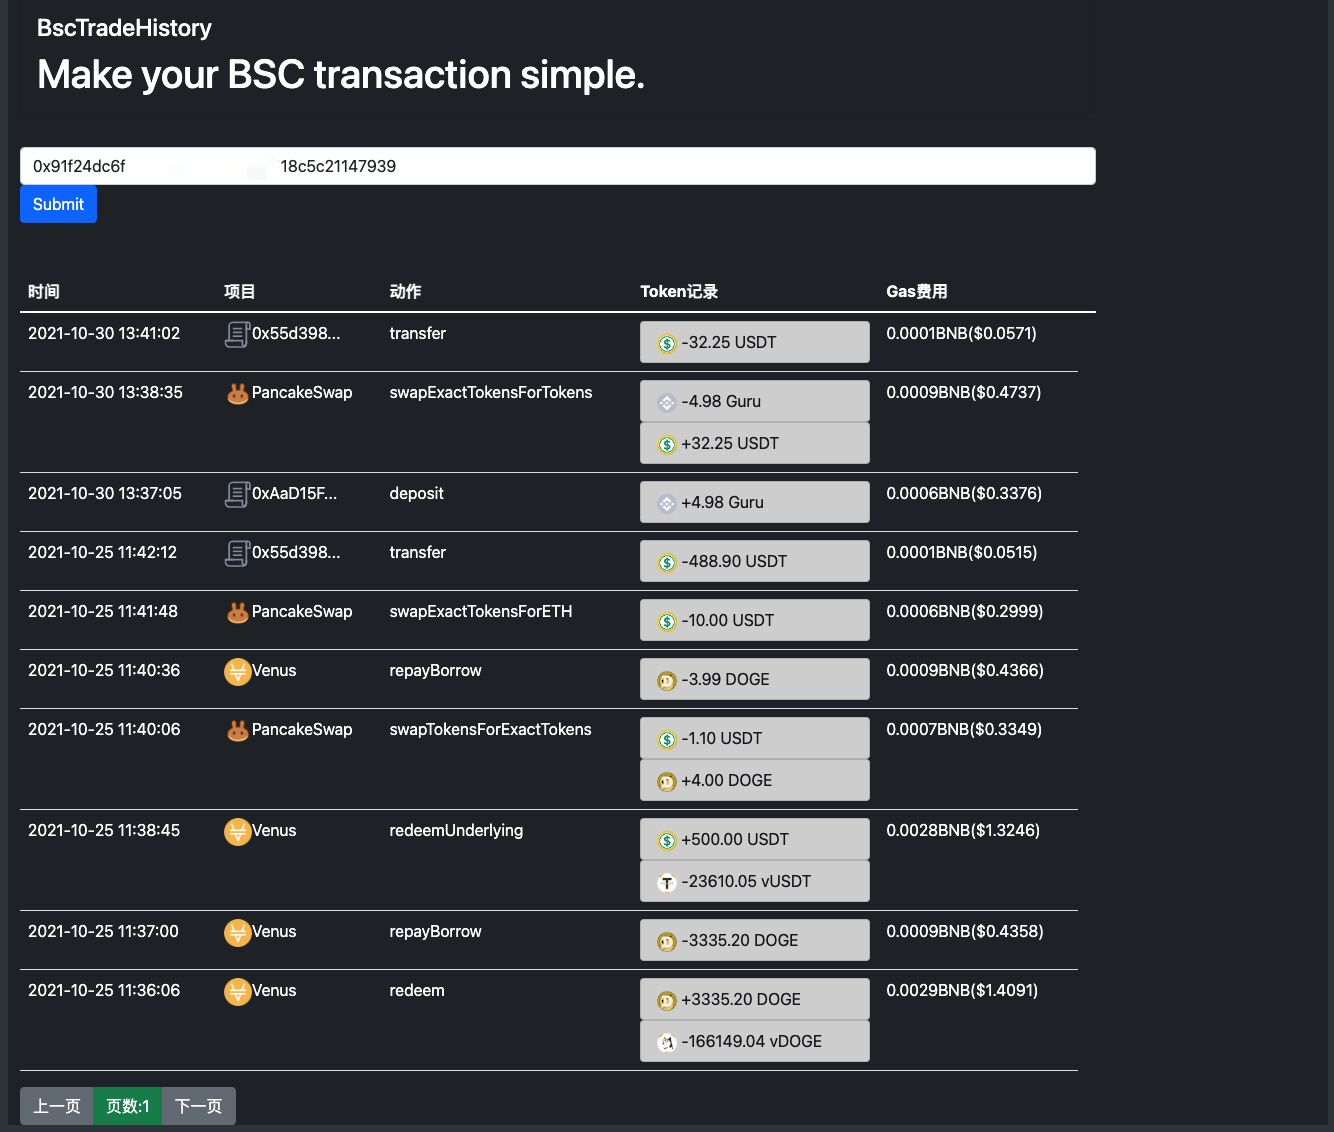
Make your BSC transaction simple.

bsc_trade_history Make your BSC transaction simple. 中文ReadMe Background: inspired by debank ,Practice my hands on this small project Blog:Crypto-BscTr

Comments
Releases(v1.1.0)
Owner
Scotty
Scotty
Simple, realtime visualization of neural network training performance.

pastalog Simple, realtime visualization server for training neural networks. Use with Lasagne, Keras, Tensorflow, Torch, Theano, and basically everyth

Rewon Child 416 Dec 29, 2022
Simple Python interface for Graphviz

Graphviz This package facilitates the creation and rendering of graph descriptions in the DOT language of the Graphviz graph drawing software (master

Sebastian Bank 1.3k Dec 26, 2022
Simple Python interface for Graphviz

Graphviz This package facilitates the creation and rendering of graph descriptions in the DOT language of the Graphviz graph drawing software (master

Sebastian Bank 919 Feb 17, 2021
Simple and lightweight Spotify Overlay written in Python.

Simple Spotify Overlay This is a simple yet powerful Spotify Overlay. About I have been looking for something like this ever since I got Spotify. I th

null 27 Sep 3, 2022
This is a Cross-Platform Plot Manager for Chia Plotting that is simple, easy-to-use, and reliable.

Swar's Chia Plot Manager A plot manager for Chia plotting: https://www.chia.net/ Development Version: v0.0.1 This is a cross-platform Chia Plot Manage

Swar Patel 1.3k Dec 13, 2022
erdantic is a simple tool for drawing entity relationship diagrams (ERDs) for Python data model classes

erdantic is a simple tool for drawing entity relationship diagrams (ERDs) for Python data model classes. Diagrams are rendered using the venerable Graphviz library.

DrivenData 129 Jan 4, 2023
Lumen provides a framework for visual analytics, which allows users to build data-driven dashboards from a simple yaml specification

Lumen project provides a framework for visual analytics, which allows users to build data-driven dashboards from a simple yaml specification

HoloViz 120 Jan 4, 2023
Simple Python interface for Graphviz

Simple Python interface for Graphviz

Sebastian Bank 1000 Jun 3, 2021
Simple python implementation with matplotlib to manually fit MIST isochrones to Gaia DR2 color-magnitude diagrams

Simple python implementation with matplotlib to manually fit MIST isochrones to Gaia DR2 color-magnitude diagrams

Karl Jaehnig 7 Oct 22, 2022
Yata is a fast, simple and easy Data Visulaization tool, running on python dash

Yata is a fast, simple and easy Data Visulaization tool, running on python dash. The main goal of Yata is to provide a easy way for persons with little programming knowledge to visualize their data easily.

Cybercreek 3 Jun 28, 2021