Simple Python interface for Graphviz

Overview

Graphviz

Latest PyPI Version License Supported Python Versions Format

Travis Codecov Readthedocs stable Readthedocs latest

This package facilitates the creation and rendering of graph descriptions in the DOT language of the Graphviz graph drawing software (master repo) from Python.

Create a graph object, assemble the graph by adding nodes and edges, and retrieve its DOT source code string. Save the source code to a file and render it with the Graphviz installation of your system.

Use the view option/method to directly inspect the resulting (PDF, PNG, SVG, etc.) file with its default application. Graphs can also be rendered and displayed within Jupyter notebooks (formerly known as IPython notebooks, example, nbviewer) as well as the Jupyter Qt Console.

Links

Installation

This package runs under Python 3.6+, use pip to install:

$ pip install graphviz

To render the generated DOT source code, you also need to install Graphviz (download page, installation procedure for Windows, archived versions).

Make sure that the directory containing the dot executable is on your systems' path.

Quickstart

Create a graph object:

>>> from graphviz import Digraph

>>> dot = Digraph(comment='The Round Table')

>>> dot  #doctest: +ELLIPSIS
<graphviz.dot.Digraph object at 0x...>

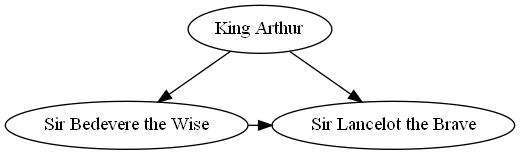
Add nodes and edges:

>>> dot.node('A', 'King Arthur')
>>> dot.node('B', 'Sir Bedevere the Wise')
>>> dot.node('L', 'Sir Lancelot the Brave')

>>> dot.edges(['AB', 'AL'])
>>> dot.edge('B', 'L', constraint='false')

Check the generated source code:

>>> print(dot.source)  # doctest: +NORMALIZE_WHITESPACE
// The Round Table
digraph {
    A [label="King Arthur"]
    B [label="Sir Bedevere the Wise"]
    L [label="Sir Lancelot the Brave"]
    A -> B
    A -> L
    B -> L [constraint=false]
}

Save and render the source code, optionally view the result:

>>> dot.render('test-output/round-table.gv', view=True)  # doctest: +SKIP
'test-output/round-table.gv.pdf'

https://raw.github.com/xflr6/graphviz/master/docs/round-table.png

See also

License

This package is distributed under the MIT license.

Comments
  • Add rendered_filename argument to derive format from result file suffix

    Add rendered_filename argument to derive format from result file suffix

    In the examples, we see that graphviz adds a suffix to the filename provided based on the format:

    >>> dot.render('test-output/round-table.gv', view=True)  # doctest: +SKIP
    'test-output/round-table.gv.pdf'
    

    Would it not be better to just chose the format based on the filename suffix?

    Currently, I have a workaround where I write:

    p = Path(filename)
    if p.suffix == '.svg':
        dot.format = 'svg'
    
    ...
    
    dot.render(p.stem)
    

    or else the suffix is appended to the filename twice.

    enhancement 
    opened by NAThompson 20
  • Testing fails under tox with 'Fontconfig error: No writable cache directories'

    Testing fails under tox with 'Fontconfig error: No writable cache directories'

    I'm trying to package graphviz version 0.20.1 for OpenIndiana but some tests are failing. Here is an example of failure (all tests fails with the same error):

    ______________________ test_render[dot-pdf-None-None-pdf] ______________________
    
    capsys = <_pytest.capture.CaptureFixture object at 0x7fffa964c600>
    tmp_path = PosixPath('/tmp/pytest-of-marcel/pytest-16/test_render_dot_pdf_None_None_0')
    engine = 'dot', format_ = 'pdf', renderer = None, formatter = None
    expected_suffix = 'pdf', filename = 'hello.gv'
    data = b'digraph { hello -> world }'
    
        @pytest.mark.exe
        @pytest.mark.parametrize(
            'format_, renderer, formatter, expected_suffix',
            [('pdf', None, None, 'pdf'),
             ('plain', 'dot', 'core', 'core.dot.plain')])
        @pytest.mark.parametrize('engine', ['dot'])
        def test_render(capsys, tmp_path, engine, format_, renderer, formatter,
                        expected_suffix, filename='hello.gv',
                        data=b'digraph { hello -> world }'):
            lpath = tmp_path / filename
            assert lpath.write_bytes(data) == len(data) == lpath.stat().st_size
            rendered = lpath.with_suffix(f'{lpath.suffix}.{expected_suffix}')
        
            with pytest.deprecated_call():
                result = graphviz.render(engine, format_, str(lpath),
                                         renderer, formatter)
        
            assert result == str(rendered)
        
            assert rendered.stat().st_size
    >       assert capsys.readouterr() == ('', '')
    E       AssertionError: assert CaptureResult...irectories\n') == ('', '')
    E         Full diff:
    E         - ('', '')
    E         + CaptureResult(out='', err='Fontconfig error: No writable cache directories\nFontconfig error: No writable cache directories\nFontconfig error: No writable cache directories\nFontconfig error: No writable cache directories\nFontconfig error: No writable cache directories\nFontconfig error: No writable cache directories\nFontconfig error: No writable cache directories\nFontconfig error: No writable cache directories\nFontconfig error: No writable cache directories\nFontconfig error: No writable cache directories\nFontconfig error: No writable cache directories\nFontconfig...
    E         
    E         ...Full output truncated (1 line hidden), use '-vv' to show
    
    tests/backend/test_rendering.py:63: AssertionError
    ------------------------------ Captured log call -------------------------------
    DEBUG    graphviz.backend.execute:execute.py:61 run [PosixPath('dot'), '-Kdot', '-Tpdf', '-O', 'hello.gv']
    

    Here is the complete list of failed tests:

    =========================== short test summary info ============================
    FAILED tests/backend/test_rendering.py::test_render_img - AssertionError: ass...
    FAILED tests/backend/test_rendering.py::test_render[dot-plain-dot-core-core.dot.plain]
    FAILED tests/backend/test_rendering.py::test_render[dot-pdf-None-None-pdf] - ...
    FAILED tests/backend/test_rendering.py::test_render_outfile_differnt_parent
    FAILED tests/test_graphs.py::test_subgraph_render[Graph-...] - AssertionError...
    FAILED tests/test_graphs.py::test_subgraph_render[Digraph-...] - AssertionErr...
    FAILED tests/backend/test_piping.py::test_pipe[dot-ps-ps-core-%!PS-] - Assert...
    FAILED tests/backend/test_piping.py::test_pipe[dot-svg-None-None-(?s)^<\\?xml .+</svg>\\s*$]
    FAILED tests/backend/test_piping.py::test_pipe[sfdp-svg-None-None-(?s)^<\\?xml .+</svg>\\s*$]
    

    I'm running tests as non-root user. Any idea what is wrong here?

    Thank you.

    opened by mtelka 12
  • error encoding

    error encoding

    only on windows i have this error: 'NoneType ' has not objects encoding line 43 in _compact.py

    I fixed it commenting the lines 156 to 159 in backend.py

    opened by enzococca 12
  • Fails to extract version of

    Fails to extract version of "Development" Graphviz

    I was troubleshooting the Graphviz and using your python3-graphviz on Debian 10.4 Buster.

    The version that I have is:

    $ dot  -V
    dot - graphviz version 2.44.2~dev.20200927.0217 (20200927.0217)
    

    The behavior (actual failing result) is:

    PyDot version: 1.4.1
    Traceback (most recent call last):
      File "/home/steve/work/datascience/WSGraphDemo/bug-gv.py", line 6, in <module>
        print('Graphviz version:', graphviz.version())
      File "/home/steve/work/datascience/WSGraphDemo/venv/lib/python3.7/site-packages/graphviz/backend.py", line 265, in version
        raise RuntimeError('cannot parse %r output: %r' % (cmd, out))
    RuntimeError: cannot parse ['dot', '-V'] output: 'dot - graphviz version 2.44.2~dev.20200927.0217 (20200927.0217)\n'
    
    Process finished with exit code 1
    

    The impacted line is in backend.py line 263.

    The new code that made it work has been pushed in #110

    bug 
    opened by egberts 11
  • Add configurable format for notebook visualization

    Add configurable format for notebook visualization

    In Ubuntu 20.04, the default graphviz (i.e. C code, not python) version is 2.43.0. In https://gitlab.com/graphviz/graphviz/-/issues/1605 someone reported a bug, that the scale was wrongly calculated (introduced in 2.42.0 and fixed in 2.42.4, not sure, how the versioning works, but 2.43.0 is between them).

    I am not in the position to update the C graphviz, but I can easily update the Python graphviz (i.e. this package). Are you interested in a PR, that has a workaround to fix this?

    I observed this bug, when I tried to visualize a Graph in a Jupyter Lab Notebook. While the small examples worked, the larger ones got broken.

    Here is the image from https://gitlab.com/graphviz/graphviz/-/issues/1605 it should give you an idea, what happened in my notebook (Sorry, my examples were too complicated to post them here): image When the graph gets to large, I see something like the first image, while small examples produce the correct output.

    At the moment I use the following wrapper to fix the visualization, because I cannot replace the C lib.

    class FixDotViewer:
        def __init__(self, dot):
            # SVG backend of dot broken since 2.42.0 and fixed in 2.42.4.
            # Not sure, how the versioning works, but it was reported for
            # 2.43.0, which is also broken. 
            # Ubuntu 20.04 has 2.43.0, hence, we need a workaround.
            # Bug reported in https://gitlab.com/graphviz/graphviz/-/issues/1605
            
            backend = 'svg fix scale'
    
            if backend == 'svg':
                def _repr_svg_():
                    return dot._repr_svg_()
                self._repr_svg_ = _repr_svg_ 
            elif backend == 'svg fix scale':
                def _repr_svg_():
                    svg = dot._repr_svg_()
                    r = re.compile('scale\((\d+\.\d*) (\d+\.\d*)\)')
    
                    m = r.search(svg)
                    if m:
                        scale_x, scale_y = m.groups()
                        scale_x = float(scale_x)
                        scale_y = float(scale_y)
                        if scale_x > 1 or scale_y > 1:
                            if scale_x > 1:
                                scale_x = 1 / scale_x
                            if scale_y > 1:
                                scale_y = 1 / scale_y
                            svg = re.sub('scale\(\d+\.\d* \d+\.\d*\)', f'scale({scale_x} {scale_y})', svg)
                    
                    return svg
                self._repr_svg_ = _repr_svg_ 
                
            elif backend == 'pdf->svg':
                def _repr_svg_():
                    import tempfile
                    from pathlib import Path
                    import subprocess
                    pdf_data = dot.pipe(format='pdf')
                    with tempfile.TemporaryDirectory() as tmpdir:
                        tmpdir = Path(tmpdir)
                        pdf = tmpdir / 'image.pdf'
                        pdf.write_bytes(pdf_data)
                        subprocess.run([
                            'inkscape',
                            '--without-gui',
                            f'--file={pdf}',
                            '--export-plain-svg=main.svg',
                        ], cwd=tmpdir)
                        return Path(tmpdir / 'main.svg').read_text()
                self._repr_svg_ = _repr_svg_ 
            elif backend == 'png':
                def _repr_png_():
                    return dot.pipe(format='png')
                self._repr_png_ = _repr_png_ 
            elif backend == 'jpeg':
                def _repr_jpeg_():
                    return dot.pipe(format='jpeg')
                self._repr_jpeg_ = _repr_jpeg_ 
            else:
                raise ValueError(dot_backend)
    

    I am not sure, which workaround would be the best solution. Examples:

    • Add global option for default Jupyter visualization backend, e.g. SVG, PDF, PNG, JPEG (Not sure, if more works)
      • Raise a warning for some graphviz versions, that the visualization may be broken and report how to fix it.
    • Fix the SVG Code with regex for some versions or, when a global flag is set.
    enhancement 
    opened by boeddeker 10
  • '\\

    '\\"' breaks quoting

    Write code as this

    from graphviz import Digraph
    
    g = Digraph("CFG")
    g.node('0', label='\\" shape=box color=red] # "=12')
    g.render()
    

    You'll get that

    digraph CFG {
    	0 [label="\\" shape=box color=red] # \"=12"]
    }
    
    bug 
    opened by agfn 10
  • escaping \l

    escaping \l

    Hi!

    Looks like a degradation in https://github.com/xflr6/graphviz/commit/a29eaa0bb52fb7a1ffeb8ad6cb05b07b059a064d My script uses '\l' in lables [it's DOT syntax], and now it is broken, as backslash is escaped itself. [script is here: https://git.qemu.org/?p=qemu.git;a=blob_plain;f=scripts/render_block_graph.py;hb=HEAD;h=656f0388ad6b05840f1a77b1e150284c5ae89736;hb=HEAD ]

    bug 
    opened by senya 10
  • "failed to execute ['dot', '-Tsvg'], make sure the Graphviz executables are on your systems' PATH" error on platform

    Hi!When I run “make_dot ()”,it appears“failed to execute ['dot', '-Tsvg'], make sure the Graphviz executables are on your systems' PATH ” error. I install graphviz offline by the command of pip insatll graphviz-0.10.1-py2.py3-none-any.whl. Thanks!

    opened by InstantWindy 10
  • Add support for running in MyBinder

    Add support for running in MyBinder

    To make it easier for potential users to demo this package, the repo can be configured so that that a pre-configured Jupyter notebook server can be launched from it and the example notebook(s) run directly using MyBinder.

    Changes required:

    • add a binder directory;
    • to binder/apt.txt add the graphviz requirement;
    • to binder/requirements.txt add the . requirement to install the package from the repo root.
    enhancement 
    opened by psychemedia 9
  • Not pure Python, needs GraphViz installed

    Not pure Python, needs GraphViz installed

    I am not sure if GraphViz is only needed for rendering, but pure Python packages are those that do not require any binary dependencies except Python itself.

    opened by abitrolly 8
  • [0.19] test suite fails with: 'Namespace' object has no attribute '--only-exe'

    [0.19] test suite fails with: 'Namespace' object has no attribute '--only-exe'

    somehow on my system (openSUSE Tumbleweed, i.e. rolling distro), the test suite of this package (version 0.19) fails with:

    > python3 run-tests.py 
    pytest.main([])
    ============================================= test session starts ==============================================
    platform linux -- Python 3.8.12, pytest-6.2.5, py-1.10.0, pluggy-1.0.0
    rootdir: /home/abuild/rpmbuild/BUILD/graphviz-0.19, configfile: setup.cfg, testpaths: README.rst, docs, graphviz, tests
    plugins: mock-3.6.1, cov-3.0.0
    collected 321 items                                                                                            
    INTERNALERROR> Traceback (most recent call last):
    INTERNALERROR>   File "/usr/lib/python3.8/site-packages/_pytest/config/__init__.py", line 1463, in getoption
    INTERNALERROR>     val = getattr(self.option, name)
    INTERNALERROR> AttributeError: 'Namespace' object has no attribute '--only-exe'
    INTERNALERROR> 
    INTERNALERROR> The above exception was the direct cause of the following exception:
    INTERNALERROR> 
    INTERNALERROR> Traceback (most recent call last):
    INTERNALERROR>   File "/usr/lib/python3.8/site-packages/_pytest/main.py", line 269, in wrap_session
    INTERNALERROR>     session.exitstatus = doit(config, session) or 0
    INTERNALERROR>   File "/usr/lib/python3.8/site-packages/_pytest/main.py", line 322, in _main
    INTERNALERROR>     config.hook.pytest_collection(session=session)
    INTERNALERROR>   File "/usr/lib/python3.8/site-packages/pluggy/_hooks.py", line 265, in __call__
    INTERNALERROR>     return self._hookexec(self.name, self.get_hookimpls(), kwargs, firstresult)
    INTERNALERROR>   File "/usr/lib/python3.8/site-packages/pluggy/_manager.py", line 80, in _hookexec
    INTERNALERROR>     return self._inner_hookexec(hook_name, methods, kwargs, firstresult)
    INTERNALERROR>   File "/usr/lib/python3.8/site-packages/pluggy/_callers.py", line 60, in _multicall
    INTERNALERROR>     return outcome.get_result()
    INTERNALERROR>   File "/usr/lib/python3.8/site-packages/pluggy/_result.py", line 60, in get_result
    INTERNALERROR>     raise ex[1].with_traceback(ex[2])
    INTERNALERROR>   File "/usr/lib/python3.8/site-packages/pluggy/_callers.py", line 39, in _multicall
    INTERNALERROR>     res = hook_impl.function(*args)
    INTERNALERROR>   File "/usr/lib/python3.8/site-packages/_pytest/main.py", line 333, in pytest_collection
    INTERNALERROR>     session.perform_collect()
    INTERNALERROR>   File "/usr/lib/python3.8/site-packages/_pytest/main.py", line 637, in perform_collect
    INTERNALERROR>     hook.pytest_collection_modifyitems(
    INTERNALERROR>   File "/usr/lib/python3.8/site-packages/pluggy/_hooks.py", line 265, in __call__
    INTERNALERROR>     return self._hookexec(self.name, self.get_hookimpls(), kwargs, firstresult)
    INTERNALERROR>   File "/usr/lib/python3.8/site-packages/pluggy/_manager.py", line 80, in _hookexec
    INTERNALERROR>     return self._inner_hookexec(hook_name, methods, kwargs, firstresult)
    INTERNALERROR>   File "/usr/lib/python3.8/site-packages/pluggy/_callers.py", line 60, in _multicall
    INTERNALERROR>     return outcome.get_result()
    INTERNALERROR>   File "/usr/lib/python3.8/site-packages/pluggy/_result.py", line 60, in get_result
    INTERNALERROR>     raise ex[1].with_traceback(ex[2])
    INTERNALERROR>   File "/usr/lib/python3.8/site-packages/pluggy/_callers.py", line 39, in _multicall
    INTERNALERROR>     res = hook_impl.function(*args)
    INTERNALERROR>   File "/home/abuild/rpmbuild/BUILD/graphviz-0.19/tests/conftest.py", line 16, in pytest_collection_modifyitems
    INTERNALERROR>     if config.getoption(ONLY_EXE) or config.getoption(SKIP_EXE):
    INTERNALERROR>   File "/usr/lib/python3.8/site-packages/_pytest/config/__init__.py", line 1474, in getoption
    INTERNALERROR>     raise ValueError(f"no option named {name!r}") from e
    INTERNALERROR> ValueError: no option named '--only-exe'
    

    Used pytest 6.2.5

    bug 
    opened by DimStar77 8
  • Add py.typed files to graphviz packages

    Add py.typed files to graphviz packages

    The graphviz library uses type annotations widely, which is very useful. However, currently when using master, attempting to use mypy on a file that imports graphviz gives the following error:

    $ echo "import graphviz" > foo.py
    $ mypy foo.py
    foo.py:1: error: Skipping analyzing "graphviz": module is installed, but missing library stubs or py.typed marker
    foo.py:1: note: See https://mypy.readthedocs.io/en/stable/running_mypy.html#missing-imports
    Found 1 error in 1 file (checked 1 source file)
    

    To make the graphviz type annotations accessible to dependent projects, I added py.typed files to graphviz, graphviz.backend, and graphviz.parameters as described in the MyPy documentation.

    opened by ritikmishra 0
  • Add support for the -y flag

    Add support for the -y flag

    opened by AviSarmani 2
  • HTML-like labels should be opt-in

    HTML-like labels should be opt-in

    I'm starting this based on this Prefect issue: https://github.com/PrefectHQ/prefect/issues/5656

    Long story short, in graphviz library's quoting.py, there is this regex:

    HTML_STRING = re.compile(r'<.*>$', re.DOTALL)
    

    ...which incorrectly matches strings like '<lambda> <map>'.

    To reproduce:

    mkdir graphviz_test
    cd graphviz_test
    python3.9 -m venv env
    . env/bin/activate
    pip install -U pip
    pip install graphviz
    cat >test.py <<EOF
    from graphviz import Digraph
    
    if __name__ == '__main__':
    
        graph = Digraph()
        graph.node('a', '<lambda> <map>')
        graph.view()
    EOF
    python test.py 
    

    ...this results in:

    graphviz.backend.execute.CalledProcessError: Command '[PosixPath('dot'), '-Kdot', '-Tpdf', '-O', 'Digraph.gv']' returned non-zero exit status 1. [stderr: b"Error: Digraph.gv: syntax error in line 2 near ']'\n"]
    

    ...and the generated Digraph.gv looks like:

    digraph {
        a [label=<lambda> <map>]
    }
    
    opened by bayersglassey-zesty 7
  • Interest in asyncio-compatibility?

    Interest in asyncio-compatibility?

    Hi,

    I've been using your nice graphviz library as part of a largely asyncio-based side project. Overall it works great - so thanks! For this side project, in the interest of getting things done (i.e., an excuse for poorly-made choices) I had just patched over some methods of graphviz.Digraph to allow for asynchronous subprocess calls. While others may find deferring to a thread sufficient here and using the existing methods, I like the ability to keep things in asyncio-land as much as possible.

    So, to get to my question - would the developers here be interested in a contribution to support asyncio in the library itself? If so, would you have a suggested naming scheme or any API specifics? If not, feel free to close this.

    opened by klauer 0
  • Ability to edit nodes, edges, etc., after adding them

    Ability to edit nodes, edges, etc., after adding them

    PyGraphviz allows for this, but I think leans pretty heavily on the underlying Graphviz native library, which is sometimes a pain to install as a dependency. It would be super neato keen if there was a pure Python version of this functionality.

    Architecturally, this would likely be a substantial departure from the current approach. I'm assuming one would want to define and maintain an internal representation of the graph(s), and then translate them to the dot format at write-time (rather than at edit time, which is what appears to be done now). One would have to be careful to ensure that the same set of inputs still resulted in the same dot source each time.

    Once such functionality existed, one could write a reader as well, which would support a fairly powerful workflow:

    1. Read a dot file from an external source.
    2. Edit it (add/remove nodes or edges, tweak styles/attrs, etc.).
    3. Create a new dot structure reflecting the edited structure, and optionally render it.
    enhancement 
    opened by posita 6
Simple Python interface for Graphviz

Simple Python interface for Graphviz

Sebastian Bank 1000 Jun 3, 2021
A python script to visualise explain plans as a graph using graphviz

README Needs to be improved Prerequisites Need to have graphiz installed on the machine. Refer to https://graphviz.readthedocs.io/en/stable/manual.htm

Edward Mallia 1 Sep 28, 2021
Splore - a simple graphical interface for scrolling through and exploring data sets of molecules

Scroll through and exPLORE molecule sets The splore framework aims to offer a si

null 3 Jun 18, 2022
Simple plotting for Python. Python wrapper for D3xter - render charts in the browser with simple Python syntax.

PyDexter Simple plotting for Python. Python wrapper for D3xter - render charts in the browser with simple Python syntax. Setup $ pip install PyDexter

D3xter 31 Mar 6, 2021
NumPy and Pandas interface to Big Data

Blaze translates a subset of modified NumPy and Pandas-like syntax to databases and other computing systems. Blaze allows Python users a familiar inte

Blaze 3.1k Jan 1, 2023
3D plotting and mesh analysis through a streamlined interface for the Visualization Toolkit (VTK)

PyVista Deployment Build Status Metrics Citation License Community 3D plotting and mesh analysis through a streamlined interface for the Visualization

PyVista 1.6k Jan 8, 2023
3D plotting and mesh analysis through a streamlined interface for the Visualization Toolkit (VTK)

PyVista Deployment Build Status Metrics Citation License Community 3D plotting and mesh analysis through a streamlined interface for the Visualization

PyVista 692 Feb 18, 2021
A customized interface for single cell track visualisation based on pcnaDeep and napari.

pcnaDeep-napari A customized interface for single cell track visualisation based on pcnaDeep and napari. ?? Under construction You can get test image

ChanLab 2 Nov 7, 2021
Dipto Chakrabarty 7 Sep 6, 2022
In-memory Graph Database and Knowledge Graph with Natural Language Interface, compatible with Pandas

CogniPy for Pandas - In-memory Graph Database and Knowledge Graph with Natural Language Interface Whats in the box Reasoning, exploration of RDF/OWL,

Cognitum Octopus 34 Dec 13, 2022
Simple and lightweight Spotify Overlay written in Python.

Simple Spotify Overlay This is a simple yet powerful Spotify Overlay. About I have been looking for something like this ever since I got Spotify. I th

null 27 Sep 3, 2022
erdantic is a simple tool for drawing entity relationship diagrams (ERDs) for Python data model classes

erdantic is a simple tool for drawing entity relationship diagrams (ERDs) for Python data model classes. Diagrams are rendered using the venerable Graphviz library.

DrivenData 129 Jan 4, 2023
Simple python implementation with matplotlib to manually fit MIST isochrones to Gaia DR2 color-magnitude diagrams

Simple python implementation with matplotlib to manually fit MIST isochrones to Gaia DR2 color-magnitude diagrams

Karl Jaehnig 7 Oct 22, 2022
Yata is a fast, simple and easy Data Visulaization tool, running on python dash

Yata is a fast, simple and easy Data Visulaization tool, running on python dash. The main goal of Yata is to provide a easy way for persons with little programming knowledge to visualize their data easily.

Cybercreek 3 Jun 28, 2021
A simple python tool for explore your object detection dataset

A simple tool for explore your object detection dataset. The goal of this library is to provide simple and intuitive visualizations from your dataset and automatically find the best parameters for generating a specific grid of anchors that can fit you data characteristics

GRADIANT - Centro Tecnolóxico de Telecomunicacións de Galicia 142 Dec 25, 2022
Simple CLI python app to show a stocks graph performance. Made with Matplotlib and Tiingo.

stock-graph-python Simple CLI python app to show a stocks graph performance. Made with Matplotlib and Tiingo. Tiingo API Key You will need to add your

Toby 3 May 14, 2022
eoplatform is a Python package that aims to simplify Remote Sensing Earth Observation by providing actionable information on a wide swath of RS platforms and provide a simple API for downloading and visualizing RS imagery

An Earth Observation Platform Earth Observation made easy. Report Bug | Request Feature About eoplatform is a Python package that aims to simplify Rem

Matthew Tralka 4 Aug 11, 2022
A simple python script using Numpy and Matplotlib library to plot a Mohr's Circle when given a two-dimensional state of stress.

Mohr's Circle Calculator This is a really small personal project done for Department of Civil Engineering, Delhi Technological University (formerly, D

Agyeya Mishra 0 Jul 17, 2021
Simple and fast histogramming in Python accelerated with OpenMP.

pygram11 Simple and fast histogramming in Python accelerated with OpenMP with help from pybind11. pygram11 provides functions for very fast histogram

Doug Davis 28 Dec 14, 2022