bsc_trade_history
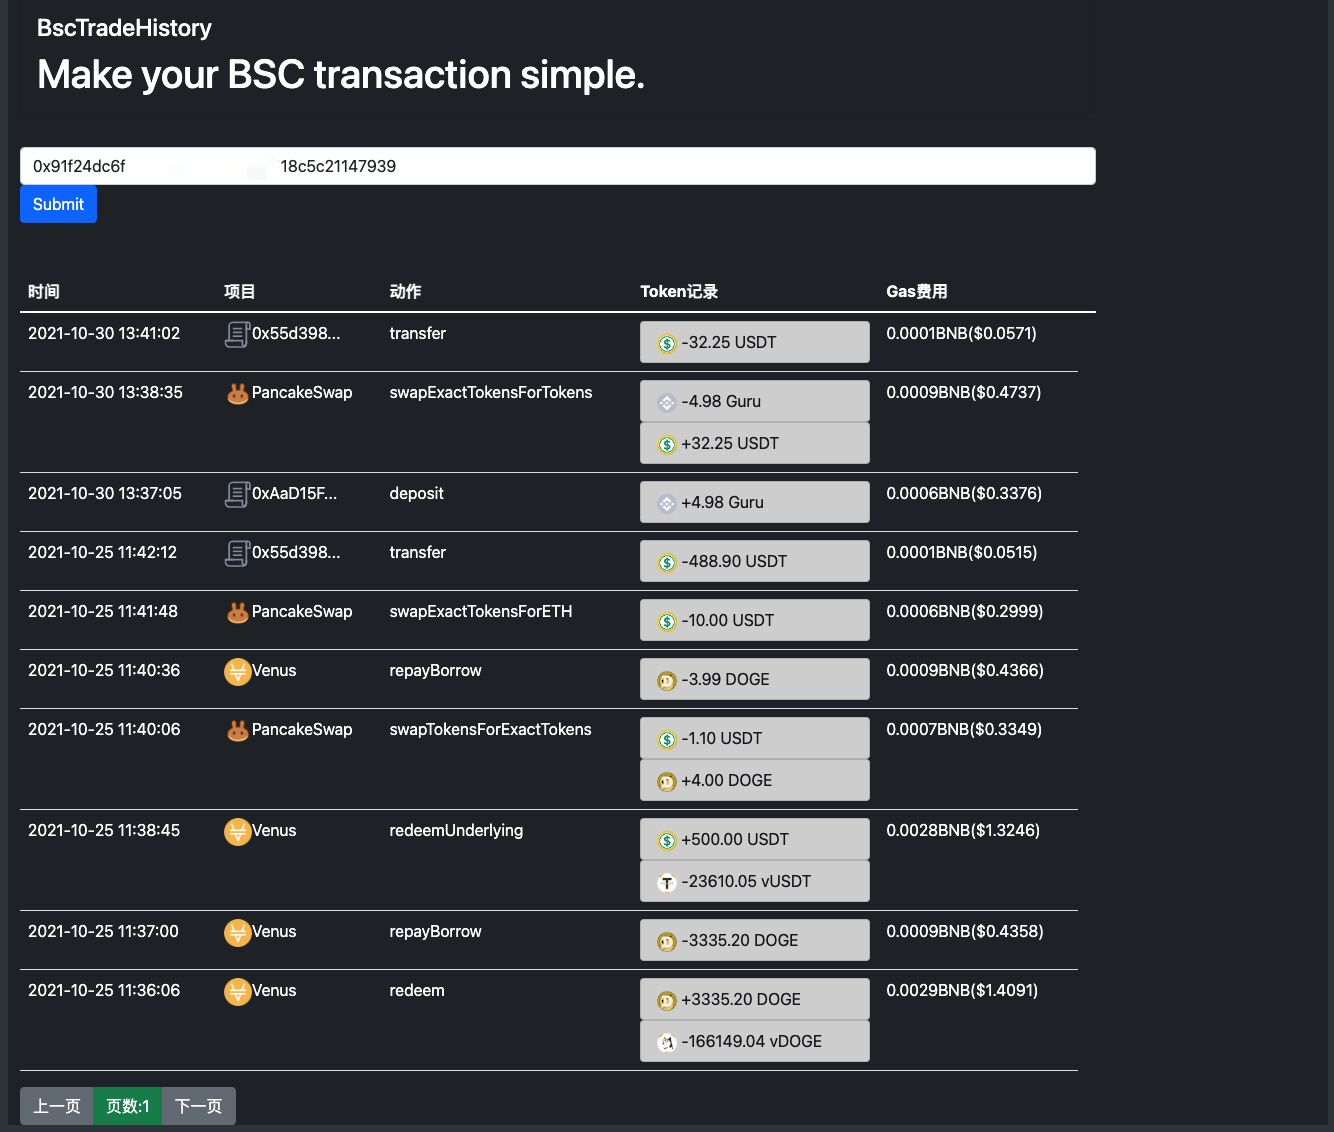
Make your BSC transaction simple.
Background:
inspired by debank ,Practice my hands on this small project
Blog:Crypto-BscTradeHistory Project
Online Demo:
Snapshot:
Install-Web
# install
npm install -g @vue/cli
npm install axios --save
npm install bootstrap --save
npm install bootstrap-vue --save
# enter web project directory
cd client
# run Web
npm run serve
Install-Api
# enter web project directory
cd server
# install pyproject.toml required package
poetry install
# enter your bscscan apikey
vim config.py
# run Api
poetry run python app.py
Usage
visit http://YourIp:8080/history
 2.3k Jan 2, 2023
 214 Jan 7, 2023
 207 Dec 8, 2022
 83 Nov 26, 2022
 18 Sep 11, 2022
 31 Oct 11, 2022

 16 Nov 26, 2022

 397 Feb 17, 2021
 156 Jan 3, 2023
 1.3k Jan 2, 2023
 21 Aug 26, 2022
 10 Jun 1, 2022
 1 Jan 10, 2022
 36 Sep 28, 2022
 142 Dec 25, 2022
 31 Mar 6, 2021
 280 Dec 19, 2022