BioMASS
Mathematical modeling is a powerful method for the analysis of complex biological systems. Although there are many researches devoted on producing models to describe dynamical cellular signaling systems, most of these models are limited and do not cover multiple pathways. Therefore, there is a challenge to combine these models to enable understanding at a larger scale. Nevertheless, larger network means that it gets more difficult to estimate parameters to reproduce dynamic experimental data needed for deeper understanding of a system.
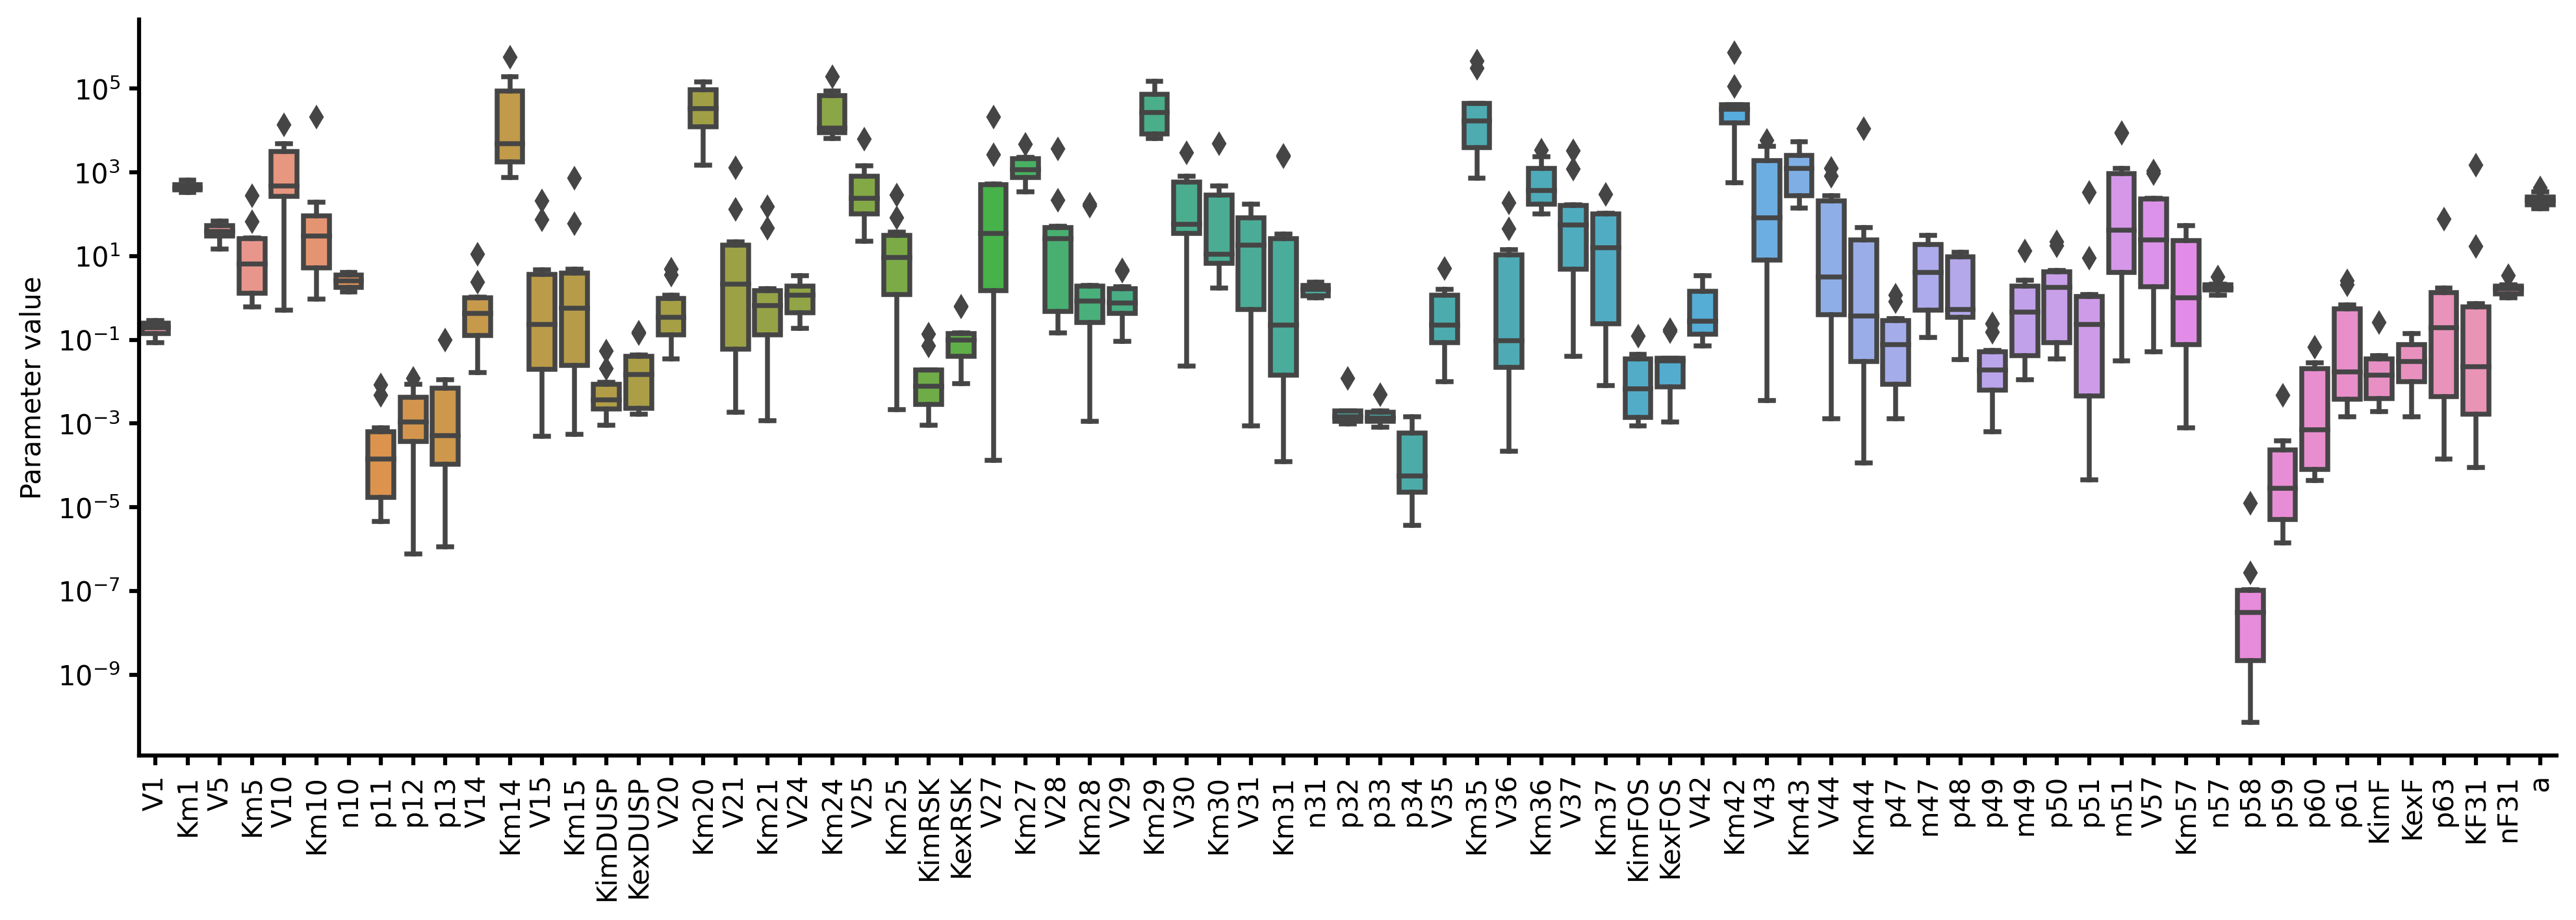
To overcome this problem, we developed BioMASS, a Python framework for Modeling and Analysis of Signaling Systems. The BioMASS framework allows efficient optimization of multiple parameter sets simultaneously and generates the multiple parameter candidates that explain the signaling dynamics of interest. These parameter candidates can be further evaluated by their distribution and sensitivity analysis as a part of alternative information about the hidden regulatory mechanism of the system.
Features
- Parameter estimation of ODE models
- Local sensitivity analysis
- Effective visualization of simulation results
Documentation
Online documentation is available at https://biomass-core.readthedocs.io/.
Installation
The BioMASS library is available at the Python Package Index (PyPI).
$ pip install biomass
BioMASS supports Python 3.7 or newer.
Also, we provide BioMASS docker images on DockerHub.
Example
Parameter estimation
from biomass import Model, optimize
from biomass.models import Nakakuki_Cell_2010

model = Model(Nakakuki_Cell_2010.__package__).create()

optimize(model, x_id=range(1, 11))
from biomass import run_simulation

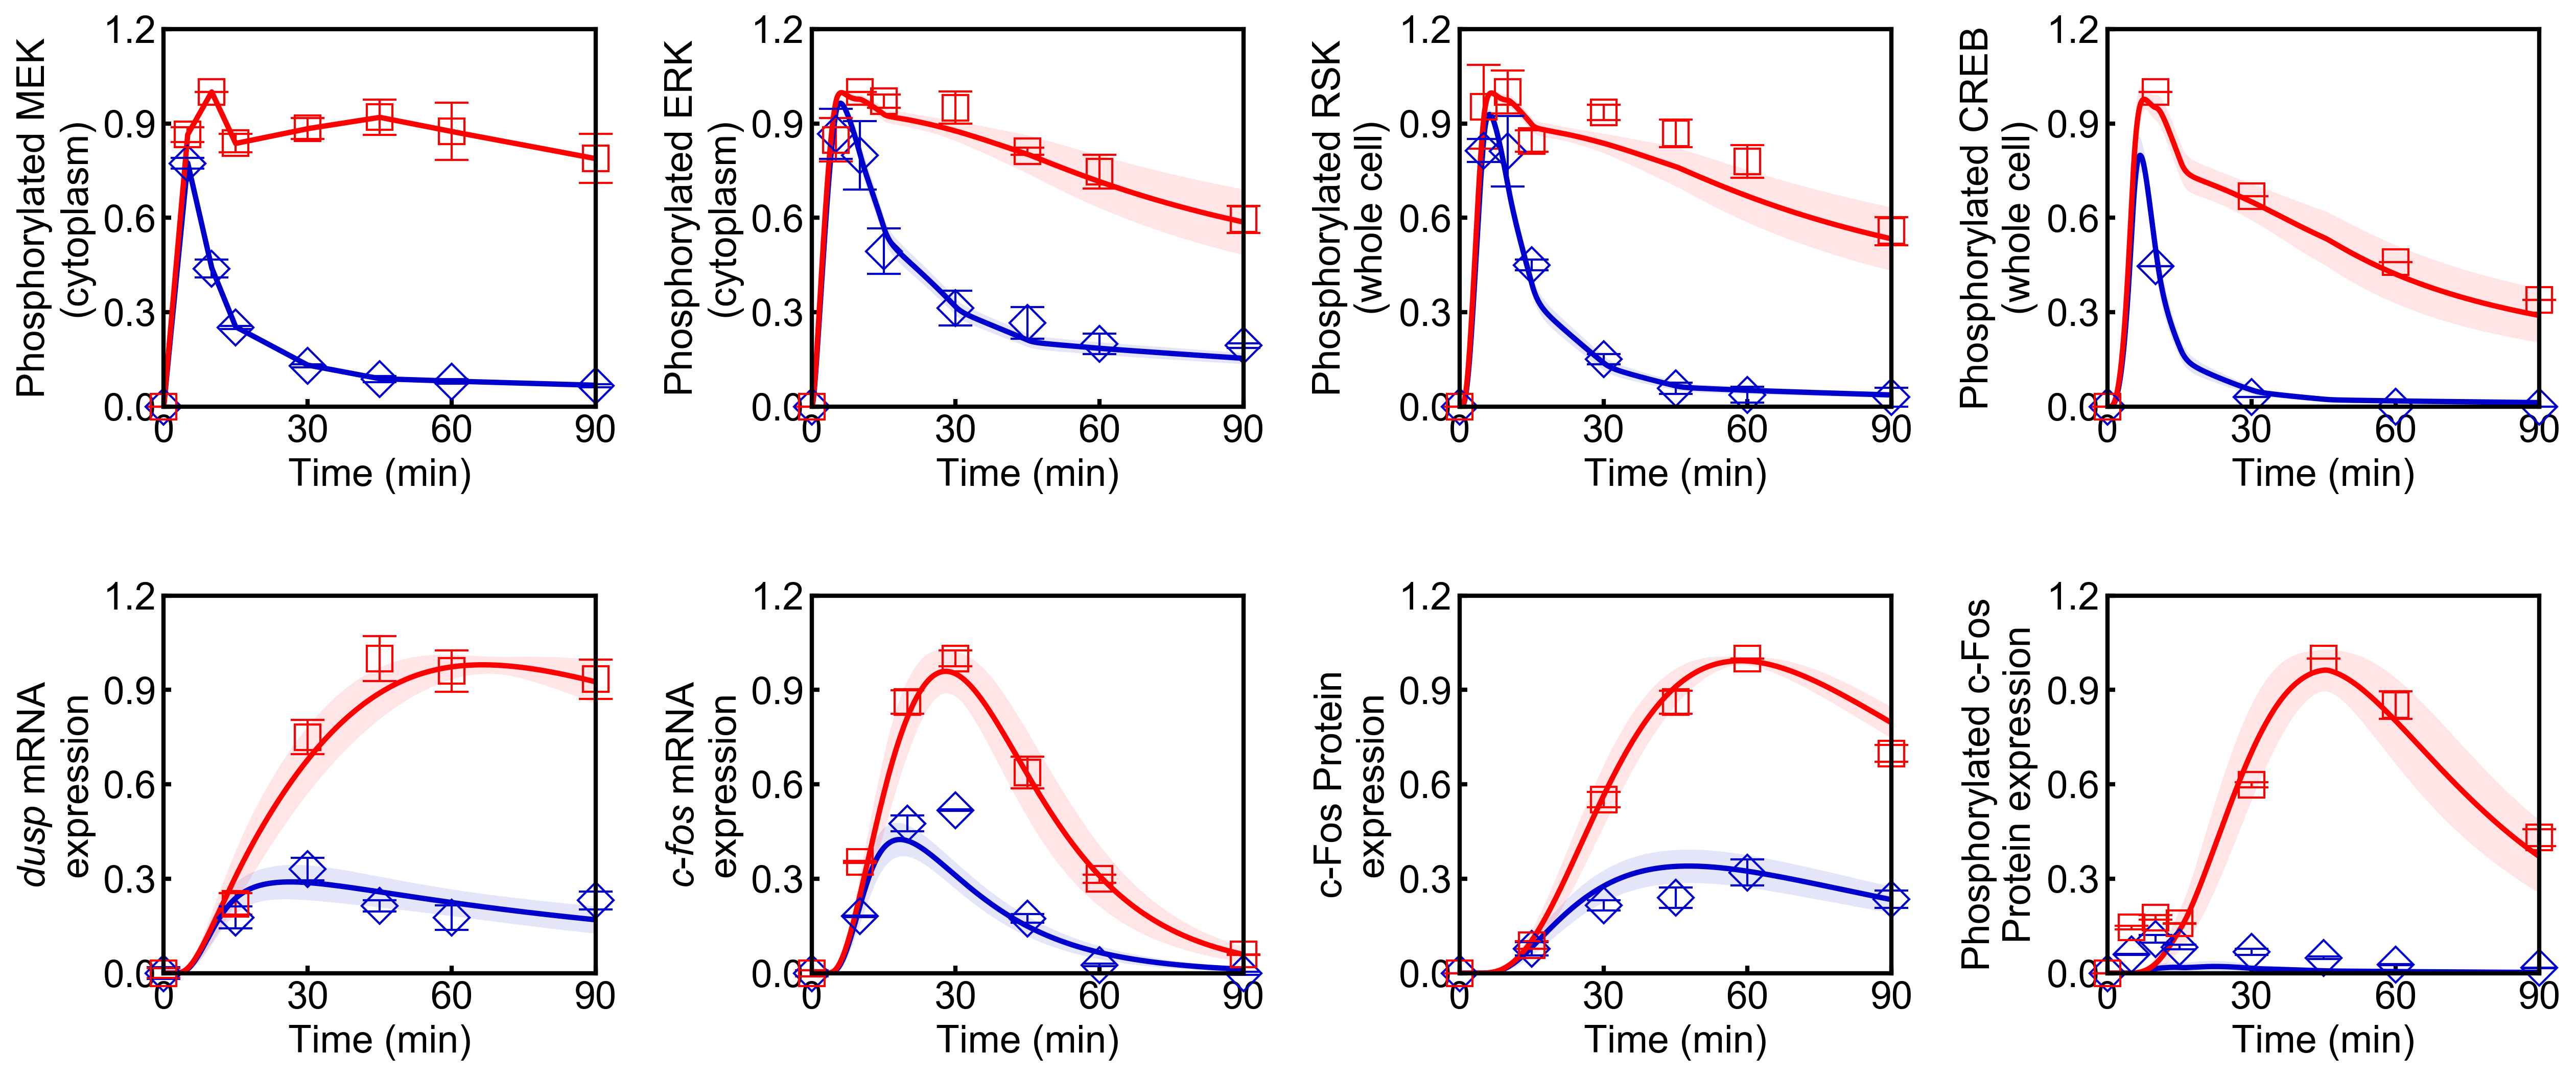
run_simulation(model, viz_type="average", stdev=True)
 Points (blue diamonds, EGF; red squares, HRG) denote experimental data, solid lines denote simulations.
Sensitivity analysis
from biomass import run_analysis

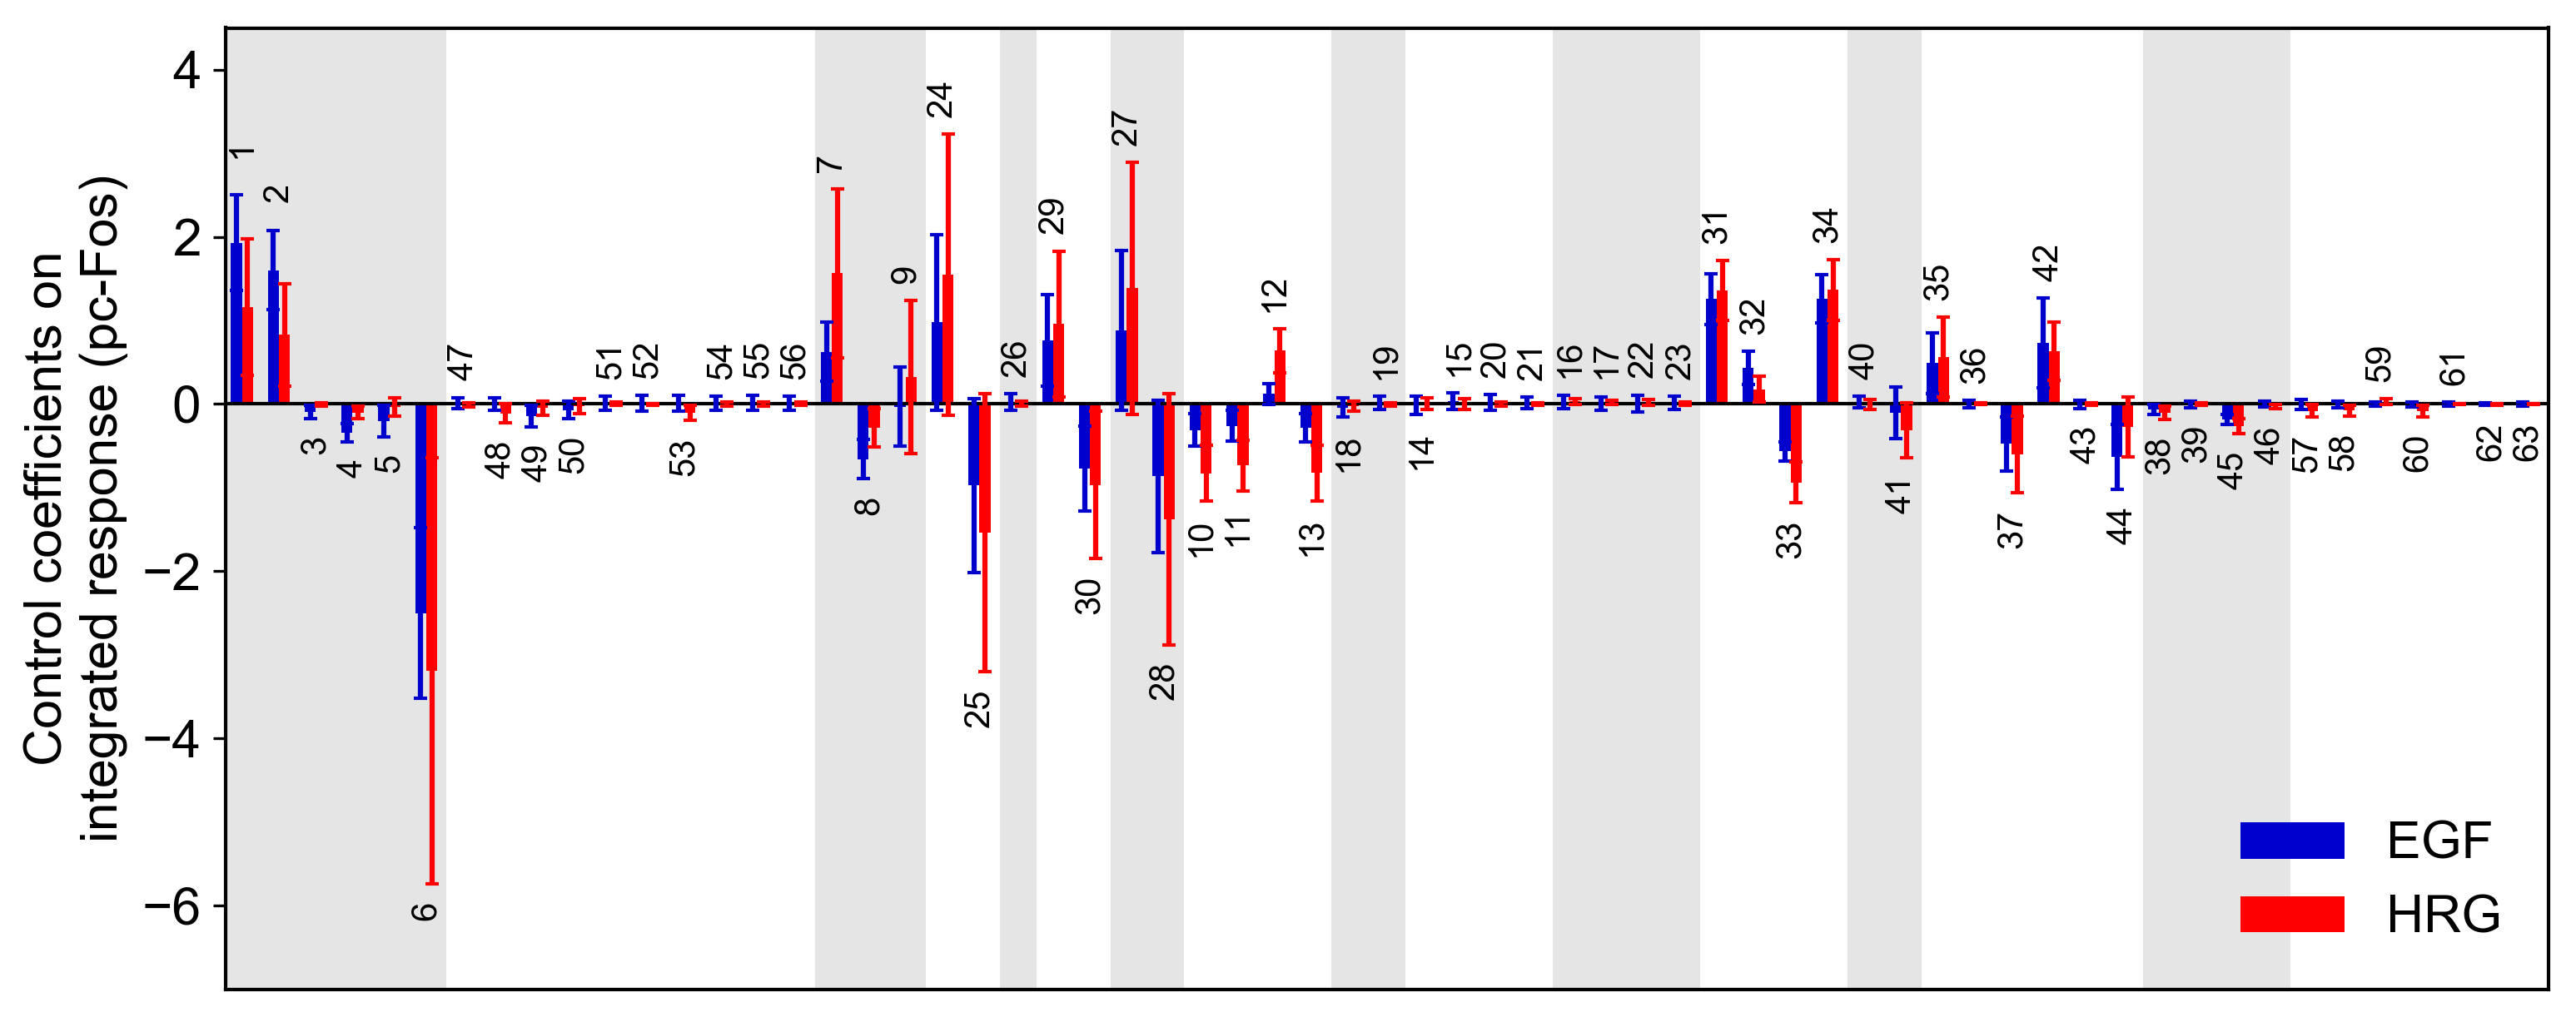
run_analysis(model, target="reaction", metric="integral", style="barplot")
Control coefficients for integrated pc-Fos are shown by bars (blue, EGF; red, HRG). Numbers above bars indicate the reaction indices, and error bars correspond to simulation standard deviation.
Citation
When using BioMASS, please cite the following paper:
- Imoto, H., Zhang, S. & Okada, M. A Computational Framework for Prediction and Analysis of Cancer Signaling Dynamics from RNA Sequencing Data—Application to the ErbB Receptor Signaling Pathway. Cancers 12, 2878 (2020). https://doi.org/10.3390/cancers12102878


