Data and code accompanying the paper Politics and Virality in the Time of Twitter

Overview

Politics and Virality in the Time of Twitter

Data and code accompanying the paper Politics and Virality in the Time of Twitter.

In specific:

  • the code used for the training of our models (./code/finetune_models.py and ./code/finetune_multi_cv.py)
  • a Jupyter Notebook containing the major parts of our analysis (./code/analysis.ipynb)
  • the model that was selected and used for the sentiment analysis.
  • the manually annotated data used for training are shared (./data/annotation/).
  • the ids of tweets that were used in our analyis and control experiments (./data/main/ & ./data/control)
  • names, parties and handles of the MPs that were tracked (./data/mps_list.csv).

Annotated Data (./data/annotation/)

  • One folder for each language (English, Spanish, Greek).
  • In each directory there are three files:
    1. *_900.csv contains the 900 tweets that annotators labelled individually (300 tweets each annotator).
    2. *_tiebreak_100.csv contains the initial 100 tweets all annotators labelled. 'annotator_3' indicates the annotator that was used as a tiebreaker.
    3. *_combined.csv contains all tweets labelled for the language.

Model

While we plan to upload all the models trained for our experiments to huggingface.co, currently only the main model used in our analysis can be currently be find at: https://drive.google.com/file/d/1_Ngmh-uHGWEbKHFpKmQ1DhVf6LtDTglx/view?usp=sharing

The model, 'xlm-roberta-sentiment-multilingual', is based on the implementation of 'cardiffnlp/twitter-xlm-roberta-base-sentiment' while being further finetuned on the annotated dataset.

Example usage

from transformers import AutoModelForSequenceClassification, pipeline
model = AutoModelForSequenceClassification.from_pretrained('./xlm-roberta-sentiment-multilingual/')
sentiment_analysis_task = pipeline("sentiment-analysis", model=model, tokenizer="cardiffnlp/twitter-xlm-roberta-base-sentiment")

sentiment_analysis_task('Today is a good day')
Out: [{'label': 'Positive', 'score': 0.978614866733551}]

Reference paper

For more details, please check the reference paper. If you use the data contained in this repository for your research, please cite the paper using the following bib entry:

@inproceedings{antypas2022politics,
  title={{Politics and Virality in the Time of Twitter: A Large-Scale Cross-Party Sentiment Analysis in Greece, Spain and United Kingdom}},
  author={Antypas, Dimosthenis and Preece, Alun and Camacho-Collados, Jose},
  booktitle={arXiv preprint arXiv:2202.00396},
  year={2022}
}
You might also like...
fds is a tool for Data Scientists made by DAGsHub to version control data and code at once.

Fast Data Science, AKA fds, is a CLI for Data Scientists to version control data and code at once, by conveniently wrapping git and dvc

Tuplex is a parallel big data processing framework that runs data science pipelines written in Python at the speed of compiled code

Tuplex is a parallel big data processing framework that runs data science pipelines written in Python at the speed of compiled code. Tuplex has similar Python APIs to Apache Spark or Dask, but rather than invoking the Python interpreter, Tuplex generates optimized LLVM bytecode for the given pipeline and input data set.

 🧪 Panel-Chemistry - exploratory data analysis and build powerful data and viz tools within the domain of Chemistry using Python and HoloViz Panel.
🧪 Panel-Chemistry - exploratory data analysis and build powerful data and viz tools within the domain of Chemistry using Python and HoloViz Panel.

🧪📈 🐍. The purpose of the panel-chemistry project is to make it really easy for you to do DATA ANALYSIS and build powerful DATA AND VIZ APPLICATIONS within the domain of Chemistry using using Python and HoloViz Panel.

Created covid data pipeline using PySpark and MySQL that collected data stream from API and do some processing and store it into MYSQL database.

Created covid data pipeline using PySpark and MySQL that collected data stream from API and do some processing and store it into MYSQL database.

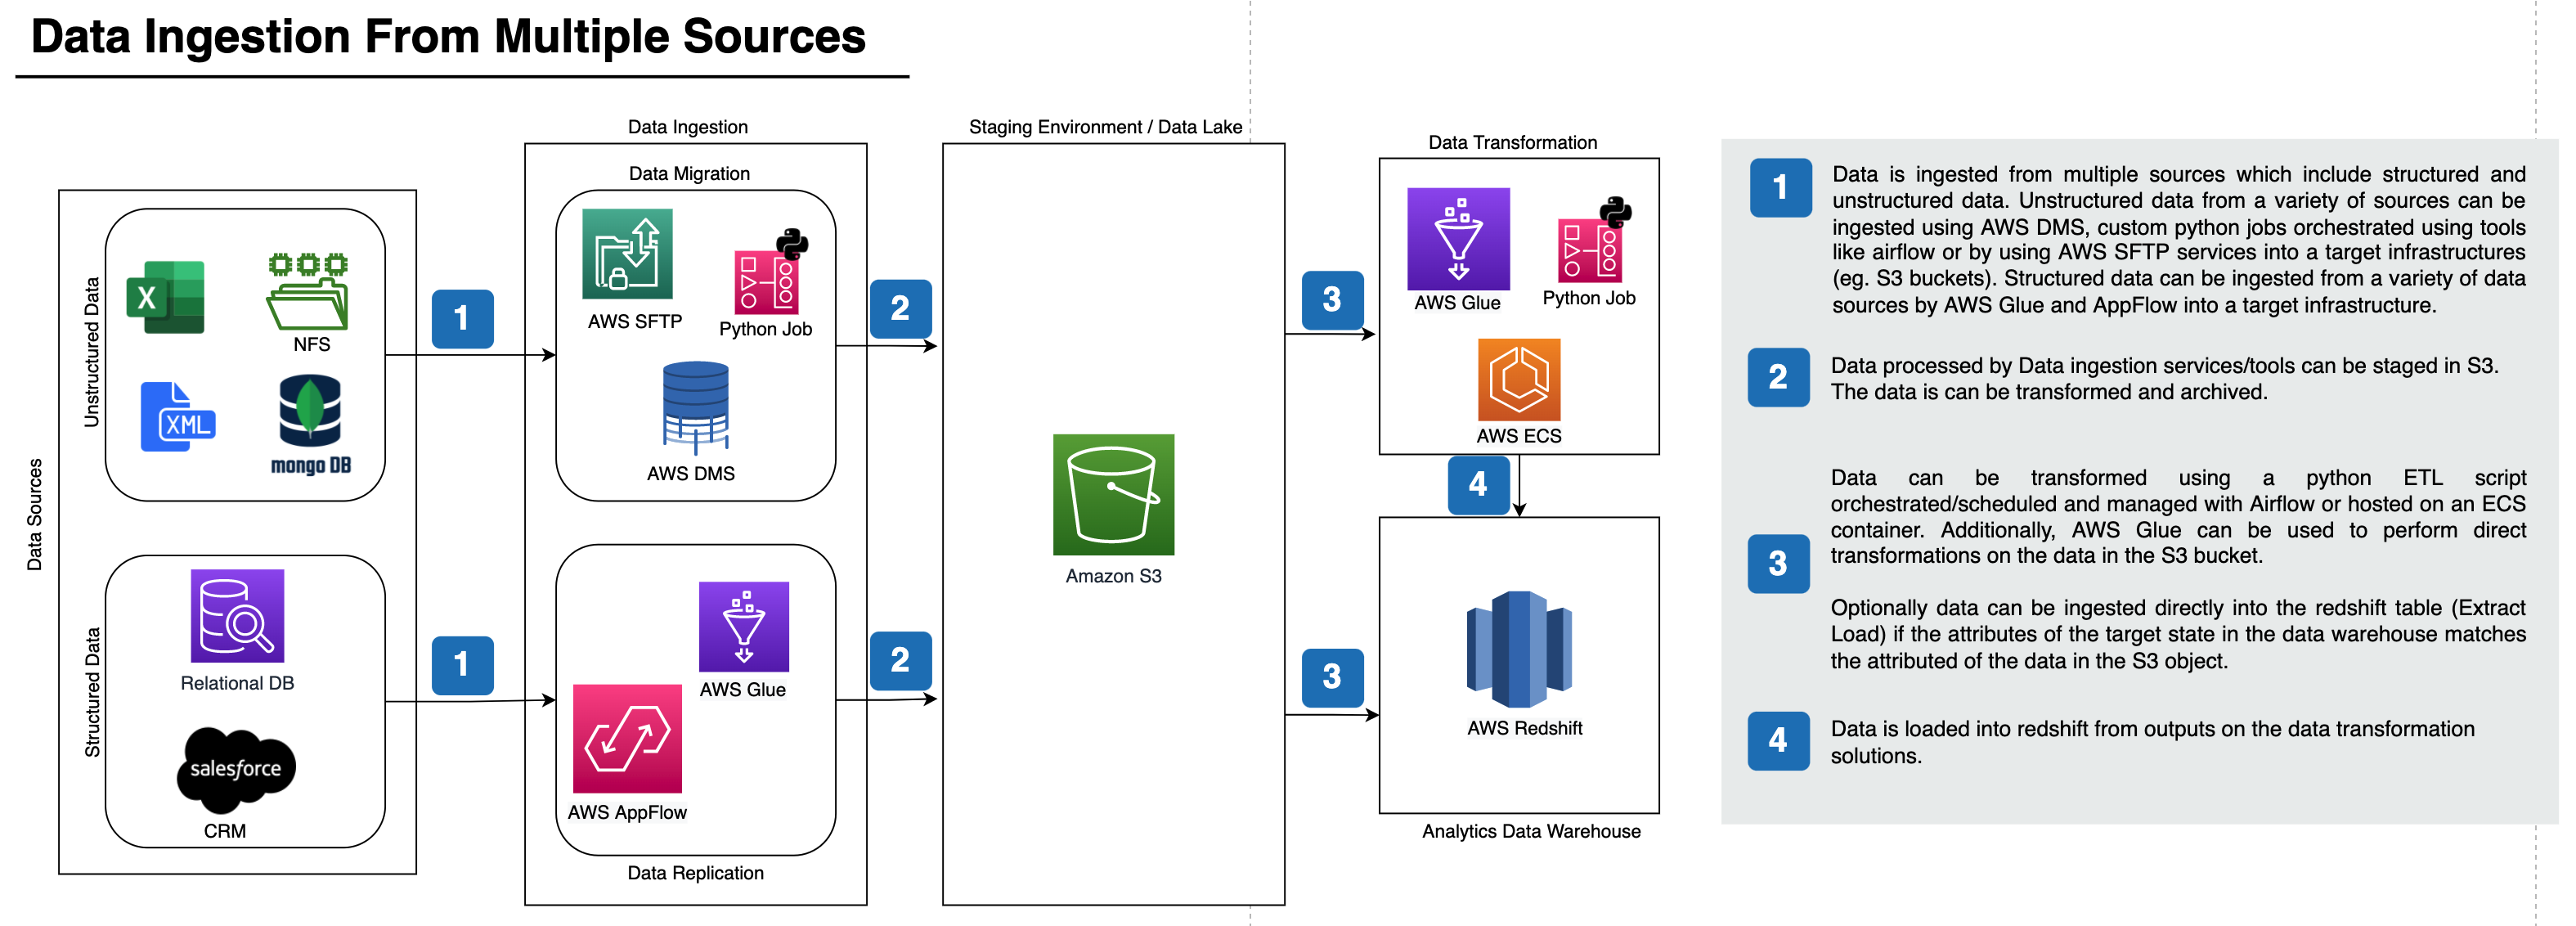
PrimaryBid - Transform application Lifecycle Data and Design and ETL pipeline architecture for ingesting data from multiple sources to redshift

Transform application Lifecycle Data and Design and ETL pipeline architecture for ingesting data from multiple sources to redshift This project is composed of two parts: Part1 and Part2

Python data processing, analysis, visualization, and data operations

Python This is a Python data processing, analysis, visualization and data operations of the source code warehouse, book ISBN: 9787115527592 Descriptio

Demonstrate the breadth and depth of your data science skills by earning all of the Databricks Data Scientist credentials

Data Scientist Learning Plan Demonstrate the breadth and depth of your data science skills by earning all of the Databricks Data Scientist credentials

A data parser for the internal syncing data format used by Fog of World.

A data parser for the internal syncing data format used by Fog of World. The parser is not designed to be a well-coded library with good performance, it is more like a demo for showing the data structure.

Functional Data Analysis, or FDA, is the field of Statistics that analyses data that depend on a continuous parameter.
Owner
Cardiff NLP
Research Group in Natural Language Processing at Cardiff University
Cardiff NLP
Sentiment analysis on streaming twitter data using Spark Structured Streaming & Python

Sentiment analysis on streaming twitter data using Spark Structured Streaming & Python This project is a good starting point for those who have little

Himanshu Kumar singh 2 Dec 4, 2021
First and foremost, we want dbt documentation to retain a DRY principle. Every time we repeat ourselves, we waste our time. Second, we want to understand column level lineage and automate impact analysis.

dbt-osmosis First and foremost, we want dbt documentation to retain a DRY principle. Every time we repeat ourselves, we waste our time. Second, we wan

Alexander Butler 150 Jan 6, 2023
Amundsen is a metadata driven application for improving the productivity of data analysts, data scientists and engineers when interacting with data.

Amundsen is a metadata driven application for improving the productivity of data analysts, data scientists and engineers when interacting with data.

Amundsen 3.7k Jan 3, 2023
Elementary is an open-source data reliability framework for modern data teams. The first module of the framework is data lineage.

Data lineage made simple, reliable, and automated. Effortlessly track the flow of data, understand dependencies and analyze impact. Features Visualiza

null 898 Jan 9, 2023
A real-time financial data streaming pipeline and visualization platform using Apache Kafka, Cassandra, and Bokeh.

Realtime Financial Market Data Visualization and Analysis Introduction This repo shows my project about real-time stock data pipeline. All the code is

null 6 Sep 7, 2022
Integrate bus data from a variety of sources (batch processing and real time processing).

Purpose: This is integrate bus data from a variety of sources such as: csv, json api, sensor data ... into Relational Database (batch processing and r

null 1 Nov 25, 2021
ForecastGA is a Python tool to forecast Google Analytics data using several popular time series models.

ForecastGA is a tool that combines a couple of popular libraries, Atspy and googleanalytics, with a few enhancements.

JR Oakes 36 Jan 3, 2023
PyEmits, a python package for easy manipulation in time-series data.

PyEmits, a python package for easy manipulation in time-series data. Time-series data is very common in real life. Engineering FSI industry (Financial

Thompson 5 Sep 23, 2022
A Python 3 library making time series data mining tasks, utilizing matrix profile algorithms

MatrixProfile MatrixProfile is a Python 3 library, brought to you by the Matrix Profile Foundation, for mining time series data. The Matrix Profile is

Matrix Profile Foundation 302 Dec 29, 2022
An Integrated Experimental Platform for time series data anomaly detection.

Curve Sorry to tell contributors and users. We decided to archive the project temporarily due to the employee work plan of collaborators. There are no

Baidu 486 Dec 21, 2022