Dashboard for the COVID19 spread

Overview

COVID-19 Data Explorer App

A streamlit Dashboard for the COVID-19 spread.

The app is live at: [https://covid19.cwerner.ai].

New data is queried from GitHub. If you think you don't see the latest click on on the "Hamburger" menue on the top right and clear the cache, then rerun the app.

COVID-19 Data Explorer

You might also like...
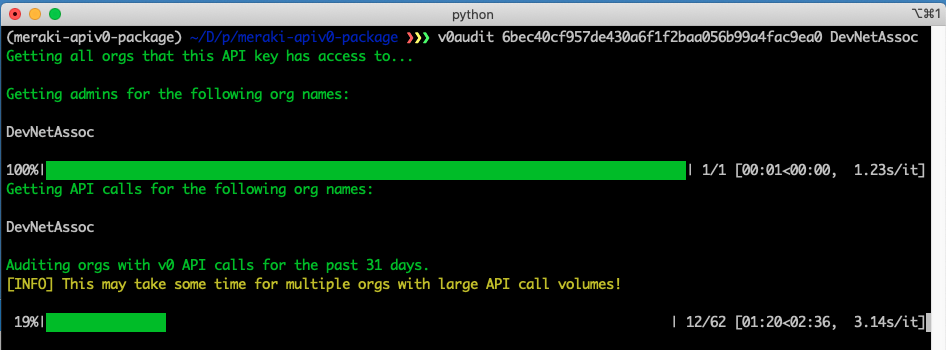
Meraki-apiv0-audit - CLI application that will export all Meraki Dashboard v0 API calls for one, multiple, or all Meraki Dashboard Organizations Bot para automatizacao de registros no Vacivida para o COVID19
Bot para automatizacao de registros no Vacivida para o COVID19

VACIBOT v.06 - Bot para automatizacao de registros no Vacivida para o COVID19 by Victor Fragoso - Prefeitura Municipal de Santo André Email: vfragoso@

Scraping Bot for the Covid19 vaccination website of the Canton of Zurich, Switzerland.

Hi 👋 , I'm David A passionate developer from France. 🌱 I’m currently learning Kotlin, ReactJS and Kubernetes 👨‍💻 All of my projects are available

Scraping script for stats on covid19 pandemic status in Chiba prefecture, Japan

About 千葉県の地域別の詳細感染者統計(Excelファイル) をCSVに変換し、かつ地域別の日時感染者集計値を出力するスクリプトです。 Requirement POSIX互換なシェル, e.g. GNU Bash (1) curl (1) python = 3.8 pandas = 1.1.

voice assistant made with python that search for covid19 data(like total cases, deaths and etc) in a specific country

covid19-voice-assistant voice assistant made with python that search for covid19 data(like total cases, deaths and etc) in a specific country installi

A set of procedures that can realize covid19 virus detection based on blood.

A set of procedures that can realize covid19 virus detection based on blood.

Ontario-Covid19-Screening - An automated Covid-19 School Screening Tool for Ontario

Ontario-Covid19-Screening An automated Covid-19 School Screening Tool for Ontari

Covid19-Forecasting - An interactive website that tracks, models and predicts COVID-19 Cases

Covid-Tracker This is an interactive website that tracks, models and predicts CO

:bowtie: Create a dashboard with python!

Installation | Documentation | Gitter Chat | Google Group Bowtie Introduction Bowtie is a library for writing dashboards in Python. No need to know we

FastAPI Admin Dashboard based on FastAPI and Tortoise ORM.

FastAPI ADMIN 中文文档 Introduction FastAPI-Admin is a admin dashboard based on fastapi and tortoise-orm. FastAPI-Admin provide crud feature out-of-the-bo

FastAPI Admin Dashboard based on FastAPI and Tortoise ORM.

FastAPI ADMIN 中文文档 Introduction FastAPI-Admin is a admin dashboard based on fastapi and tortoise-orm. FastAPI-Admin provide crud feature out-of-the-bo

Streamlit dashboard examples - Twitter cashtags, StockTwits, WSB, Charts, SQL Pattern Scanner

streamlit-dashboards Streamlit dashboard examples - Twitter cashtags, StockTwits, WSB, Charts, SQL Pattern Scanner Tutorial Video https://ww

Train/evaluate a Keras model, get metrics streamed to a dashboard in your browser.

Hera Train/evaluate a Keras model, get metrics streamed to a dashboard in your browser. Setting up Step 1. Plant the spy Install the package pip

Your interactive network visualizing dashboard

Your interactive network visualizing dashboard Documentation: Here What is Jaal Jaal is a python based interactive network visualizing tool built usin

Minimal and clean dashboard to visualize some stats of Pi-Hole with an E-Ink display attached to your Raspberry Pi

Clean Dashboard for Pi-Hole Minimal and clean dashboard to visualize some stats of Pi-Hole with an E-Ink display attached to your Raspberry Pi.

Monorepo for my Raspberry Pi dashboard and GPS satellite listener.

🥧 pi dashboard My blog post: Listening to Satellites with my Raspberry Pi This is the monorepo for my Raspberry Pi dashboard!

A terminal UI dashboard to monitor requests for code review across Github and Gitlab repositories.

A terminal UI dashboard to monitor requests for code review across Github and Gitlab repositories.

Python library to decrypt Airtag reports, as well as a InfluxDB/Grafana self-hosted dashboard example

Openhaystack-python This python daemon will allow you to gather your Openhaystack-based airtag reports and display them on a Grafana dashboard. You ca

Scraping Thailand COVID-19 data from the DDC's tableau dashboard

Scraping COVID-19 data from DDC Dashboard Scraping Thailand COVID-19 data from the DDC's tableau dashboard. Data is updated at 07:30 and 08:00 daily.

Comments
  • Bump streamlit from 0.71.0 to 1.11.1

    Bump streamlit from 0.71.0 to 1.11.1

    Bumps streamlit from 0.71.0 to 1.11.1.

    Release notes

    Sourced from streamlit's releases.

    1.11.1

    No release notes provided.

    1.11.0

    No release notes provided.

    1.10.0

    No release notes provided.

    1.9.2

    No release notes provided.

    1.9.1

    No release notes provided.

    1.9.0

    No release notes provided.

    1.8.1

    No release notes provided.

    1.8.0

    No release notes provided.

    1.7.0

    • ❄️ Add st.snow()!

    1.6.0

    • 🗜 WebSocket compression is now disabled by default, which will improve CPU and latency performance for large dataframes. You can use the server.enableWebsocketCompression  configuration option to re-enable it if you find the increased network traffic more impactful.
    • ☑️ 🔘 Radio and checkboxes improve focus on Keyboard navigation (#4308)

    1.5.1

    No release notes provided.

    1.5.0

    Release date: Jan 27, 2022

    Notable Changes

    • 🌟 Favicon defaults to a PNG to allow for transparency (#4272).
    • 🚦 Select Slider Widget now has the disabled parameter that removes interactivity (completing all of our widgets) (#4314).

    Other Changes

    • 🔤 Improvements to our markdown library to provide better support for HTML (specifically nested HTML) (#4221).
    • 📖 Expanders maintain their expanded state better when multiple expanders are present (#4290).
    • 🗳 Improved file uploader and camera input to call its on_change handler only when necessary (#4270).

    1.4.0

    ... (truncated)

    Commits

    Dependabot compatibility score

    Dependabot will resolve any conflicts with this PR as long as you don't alter it yourself. You can also trigger a rebase manually by commenting @dependabot rebase.


    Dependabot commands and options

    You can trigger Dependabot actions by commenting on this PR:

    • @dependabot rebase will rebase this PR
    • @dependabot recreate will recreate this PR, overwriting any edits that have been made to it
    • @dependabot merge will merge this PR after your CI passes on it
    • @dependabot squash and merge will squash and merge this PR after your CI passes on it
    • @dependabot cancel merge will cancel a previously requested merge and block automerging
    • @dependabot reopen will reopen this PR if it is closed
    • @dependabot close will close this PR and stop Dependabot recreating it. You can achieve the same result by closing it manually
    • @dependabot ignore this major version will close this PR and stop Dependabot creating any more for this major version (unless you reopen the PR or upgrade to it yourself)
    • @dependabot ignore this minor version will close this PR and stop Dependabot creating any more for this minor version (unless you reopen the PR or upgrade to it yourself)
    • @dependabot ignore this dependency will close this PR and stop Dependabot creating any more for this dependency (unless you reopen the PR or upgrade to it yourself)
    • @dependabot use these labels will set the current labels as the default for future PRs for this repo and language
    • @dependabot use these reviewers will set the current reviewers as the default for future PRs for this repo and language
    • @dependabot use these assignees will set the current assignees as the default for future PRs for this repo and language
    • @dependabot use this milestone will set the current milestone as the default for future PRs for this repo and language

    You can disable automated security fix PRs for this repo from the Security Alerts page.

    dependencies 
    opened by dependabot[bot] 0
  • Refactor code

    Refactor code

    It's a mess - let's refactor it ;-)

    • Split the plotting from the normal control flow
    • Switch to the page class used in stations repo (that also enables state)
    • Think about using a local database (sqlite) to store the actual data instead of pulling from git with pandas all the time (not sure if necessary)
    • Split to multiple files to get complexity of app.py down
    opened by cwerner 0
Owner
Christian Werner
Senior Scientist
Christian Werner
Train/evaluate a Keras model, get metrics streamed to a dashboard in your browser.

Hera Train/evaluate a Keras model, get metrics streamed to a dashboard in your browser. Setting up Step 1. Plant the spy Install the package pip

Keplr 495 Dec 10, 2022
Your interactive network visualizing dashboard

Your interactive network visualizing dashboard Documentation: Here What is Jaal Jaal is a python based interactive network visualizing tool built usin

Mohit 177 Jan 4, 2023
Streamlit Tutorial (ex: stock price dashboard, cartoon-stylegan, vqgan-clip, stylemixing, styleclip, sefa)

Streamlit Tutorials Install pip install streamlit Run cd [directory] streamlit run app.py --server.address 0.0.0.0 --server.port [your port] # http:/

Jihye Back 30 Jan 6, 2023
Only works with the dashboard version / branch of jesse

Jesse optuna Only works with the dashboard version / branch of jesse. The config.yml should be self-explainatory. Installation # install from git pip

Markus K. 8 Dec 4, 2022
The most simple and minimalistic navigation dashboard.

Navigation This project follows a goal to have simple and lightweight dashboard with different links. I use it to have my own self-hosted service dash

Yaroslav 23 Dec 23, 2022
CLDF dataset derived from Robbeets et al.'s "Triangulation Supports Agricultural Spread" from 2021

CLDF dataset derived from Robbeets et al.'s "Triangulation Supports Agricultural Spread" from 2021 How to cite If you use these data please cite the o

Digital Linguistics 2 Dec 20, 2021
django-dashing is a customisable, modular dashboard application framework for Django to visualize interesting data about your project. Inspired in the dashboard framework Dashing

django-dashing django-dashing is a customisable, modular dashboard application framework for Django to visualize interesting data about your project.

talPor Solutions 703 Dec 22, 2022
iot-dashboard: Fully integrated architecture platform with a dashboard for Logistics Monitoring, Internet of Things.

Fully integrated architecture platform with a dashboard for Logistics Monitoring, Internet of Things. Written in Python. Flask applicati

null 2 Jul 29, 2022
Flask-Discord-Bot-Dashboard - A simple discord Bot dashboard created in Flask Python

Flask-Discord-Bot-Dashboard A simple discord Bot dashboard created in Flask Pyth

Ethan 8 Dec 22, 2022
dash-manufacture-spc-dashboard is a dashboard for monitoring read-time process quality along manufacture production line

In our solution based on plotly, dash and influxdb, the user will firstly generate the specifications for different robots, and then a wide range of interactive visualizations for different machines for machine power, machine cost, and total cost based on the energy time and total energy getting dynamically from sensors. If a threshold is met, the alert email is generated for further operation.

Dequn Teng 1 Feb 13, 2022