Display your data in an attractive way in your notebook!

Overview

Bloxs

Bloxs is a simple python package that helps you display information in an attractive way (formed in blocks). Perfect for building dashboards, reports and apps in the notebook.

It works with: Jupyter Notebook, Google Colab, Deepnote, Kaggle Notebook, Mercury.

Get started

Install bloxs:

pip install bloxs

Import and create a bloxs:

from bloxs import B
B(1234, "Bloxs in notebook!")

Exmaples

Bloxs Code
B(1234, "Bloxs in notebook!")
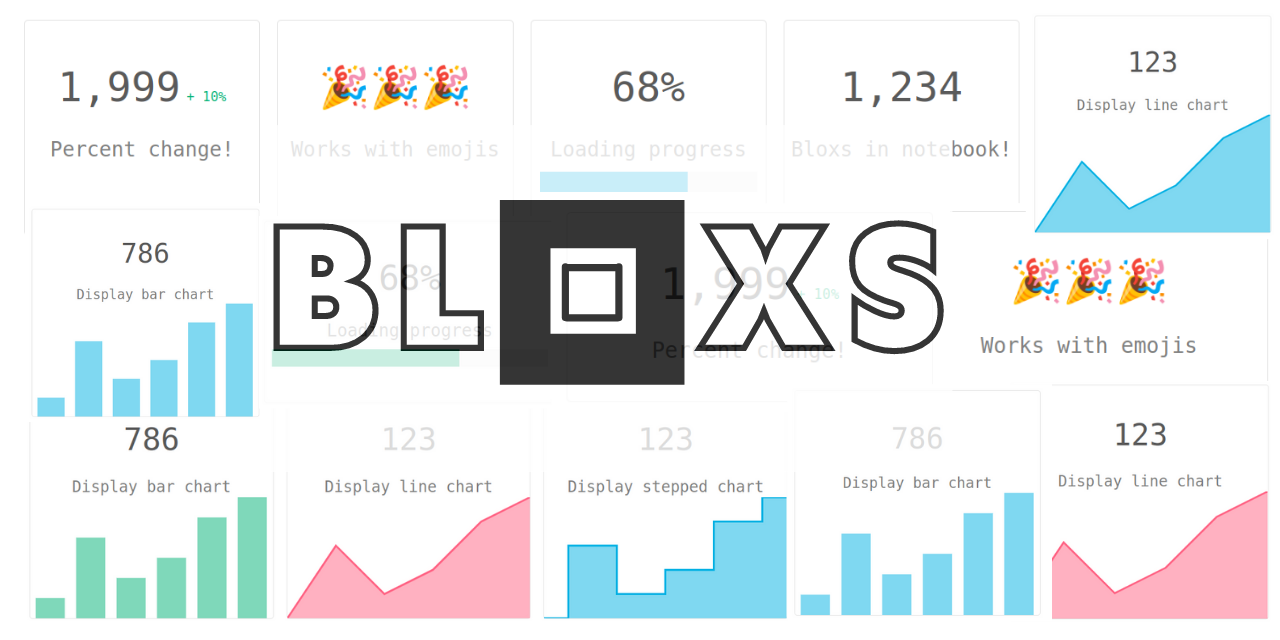
B(1999, "Percent change!", percent_change=10)
B("πŸŽ‰πŸŽ‰πŸŽ‰", "Works with emojis")
B("68%", "Loading progress", progress=68)
B("68%", "Loading progress", progress=68, color="green") color can be "blue", "red", "green" or custom in hex format (exmaple "#fa33fa")
B("123", "Display line chart", points=[1,4,2,3,5,6])
B("123", "Display line chart", points=[1,4,2,3,5,6], color="red")
B("123", "Display stepped chart", points=[1,4,2,3,5,6], chart_type="stepped")
B("123", "Display bar chart", points=[1,4,2,3,5,6], chart_type="bar")
B("123", "Display bar chart", points=[1,4,2,3,5,6], chart_type="bar", color="green")

You can combine several bloxs in one row:

B([
    B(1999, "Percent change!", percent_change=10),
    B("πŸŽ‰πŸŽ‰πŸŽ‰", "Works with emojis"),
    B("68%", "Loading progress", progress=68),
    B(1234, "Bloxs in notebook!")
])

B([
    B("786", "Display bar chart", points=[1,4,2,3,5,6], chart_type="bar", color="green"),
    B("123", "Display line chart", points=[1,4,2,3,5,6], color="red"),
    B("123", "Display stepped chart", points=[1,4,2,3,5,6], chart_type="stepped")
])

πŸ’» You can check the notebook with above example bloxs.

Bloxs works great with Mercury

Mercury is a framework for converting notebook to an interactive web app. It adds widgets to the notebook based on the YAML config. Below is presented a notebook with bloxs and the same notebook served as a web app with Mercury.

The notebook with bloxs

The Mercury web app

The web app is available on our server πŸ’»
You might also like...
In this project, we are going to display the battery notification and the time left for the battery to drain out using the battery capacity value.

In this project, we are going to display the battery notification and the time left for the battery to drain out using the battery capacity value.

A service to display a quick summary of a project on GitHub.

A service to display a quick summary of a project on GitHub. Usage πŸ“– Paste the code below with details filled in as specified below into your Readme.

Chemical Analysis Calculator, with full solution display.

Chemicology Chemical Analysis Calculator, to solve problems efficiently by displaying whole solution. Go to releases for downloading .exe, .dmg, Linux

Bootstraparse is a personal project started with a specific goal in mind: creating static html pages for direct display from a markdown-like file

Bootstraparse is a personal project started with a specific goal in mind: creating static html pages for direct display from a markdown-like file

Streamlit component to display topics from Streamlit's community forum related to any exception.

streamlit-forum Streamlit component to display topics from Streamlit's community forum related to any exception. Installation pip install streamlit-fo

Connect Playground - easy way to fill in your account with production-like objects

Just set of scripts to initialise accpunt with production-like data: A - Basic Distributor Account Initialization INPUT Distributor Account Token ACTI

Secret santa is a fun and easy way to get together with your friends and/or family with a gift for them.

Secret Santa What is Secret Santa? Secret santa is a fun and easy way to get together with your friends and/or family with a gift for them. The idea i

Tips that improve your life in one way or another

Tips that improve your life in one way or another. This software downloads life tips from reddit.com/r/LifeProTips and tweet the most upvoted tips on Twitter.

An easy way to access to your EPITECH subjects based on the Roslyn's database.

An easy way to access to your EPITECH subjects based on the Roslyn's database.

Comments
  • Graph line does not show up

    Graph line does not show up

    The bloxs examples work fine on Colab but when I transfer the same code to my local machine the charts do not show up. The block appears with the text in it but the graph is missing. I've tried with Jupyter Notebook, Jupyter Lab and VSCode all with the same result. I'm using Anaconda Python 3.9.7

    Screenshot 2022-04-05 171301 .

    opened by alanjones2 12
  • Fill color not affected when using hex color definition

    Fill color not affected when using hex color definition

    If you specify a color in hex, e.g.

    B("Rain",year,points=rain, color="#FF6384")

    This only changes the line color in a line graph and has no visible effect on the lighter fill color. With a bar graph there is no visible effect.

    Could there be a fill-color parameter, too? That way we could match the colors appropriately.

    opened by alanjones2 1
Releases(v1.0.2)
Owner
MLJAR
Data Science meets Software Engineering
MLJAR
Adjust the white point, gamma or make your XDR display darker without losing HDR peak luminance or the ability to adjust display brightness

XDR Tuner Adjust the white point, gamma or make your XDR display darker without losing HDR peak luminance or the ability to adjust display brightness

François Simond 16 Dec 28, 2022
TB Set color display - Add-on for Blender to set multiple objects and material Display Color at once.

TB_Set_color_display Add-on for Blender with operations to transfer name between object, data, materials and action names Set groups of object's or ma

null 1 Jun 1, 2022
How to access and display MyEnergi data

MyEnergi-Python-Example How to access and display MyEnergi data Windows PC Install a version of Python typically 3.10 The Python code here needs addit

G6EJD 8 Nov 28, 2022
An addin for Autodesk Fusion 360 that lets you view your design in a Looking Glass Portrait 3D display

An addin for Autodesk Fusion 360 that lets you view your design in a Looking Glass Portrait 3D display

Brian Peiris 12 Nov 2, 2022
A step-by-step tutorial for how to work with some of the most basic features of Nav2 using a Jupyter Notebook in a warehouse environment to create a basic application.

This project has a step-by-step tutorial for how to work with some of the most basic features of Nav2 using a Jupyter Notebook in a warehouse environment to create a basic application.

Steve Macenski 49 Dec 22, 2022
Repo to demo translating colab/jupyter notebook to streamlit webapp

Repo to demo translating colab/jupyter notebook to streamlit webapp

Marisa Smith 2 Feb 2, 2022
Med to csv - A simple way to parse MedAssociate output file in tidy data

MedAssociates to CSV file A simple way to parse MedAssociate output file in tidy

Jean-Emmanuel Longueville 5 Sep 9, 2022
Simple GUI menu for micropython using a rotary encoder and basic display.

Micropython encoder based menu This is a simple menu system written in micropython. It uses a switch, a rotary encoder and an OLED display.

null 80 Jan 7, 2023
This is a Fava extension to display a grouped portfolio view in Fava for a set of Beancount accounts.

Fava Portfolio Summary This is a Fava extension to display a grouped portfolio view in Fava for a set of Beancount accounts. It can also calculate MWR

null 18 Dec 26, 2022
gwcheck is a tool to check .gnu.warning.* sections in ELF object files and display their content.

gwcheck Description gwcheck is a tool to check .gnu.warning.* sections in ELF object files and display their content. For an introduction to .gnu.warn

Frederic Cambus 11 Oct 28, 2022