pyinstrument


Pyinstrument is a Python profiler. A profiler is a tool to help you 'optimize' your code - make it faster. It sounds obvious, but to get the biggest speed increase you should focus on the slowest part of your program. Pyinstrument helps you find it!
Documentation
Installation
pip install pyinstrument
Pyinstrument supports Python 2.7 and 3.3+.
To run Pyinstrument from a git checkout, there's a build step. Take a look at Contributing for more info.
How to use it
Profile a Python script
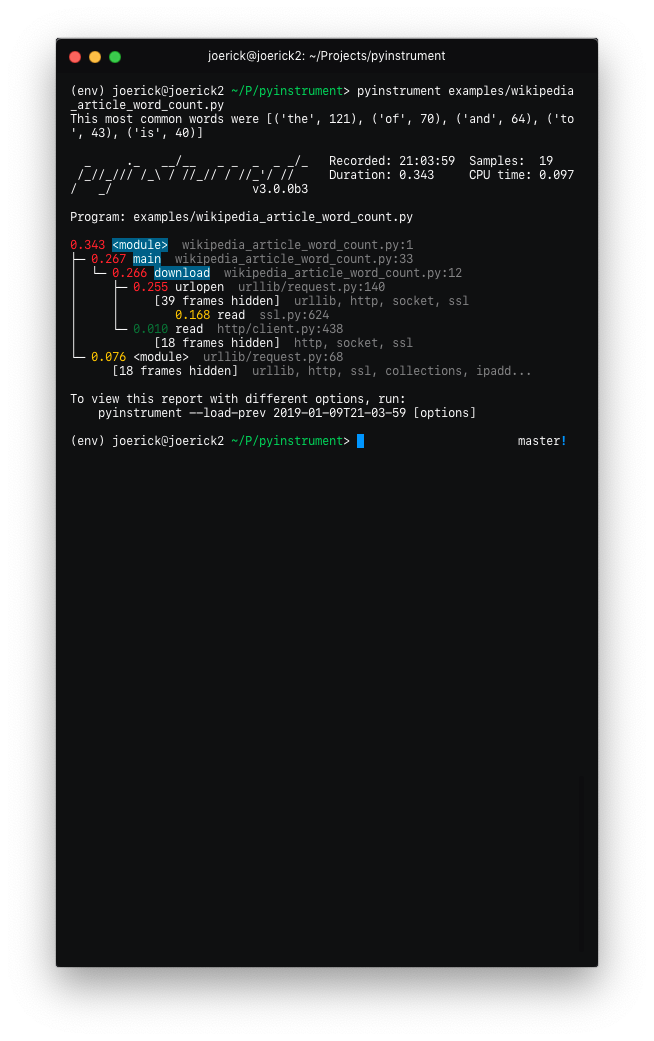
Call Pyinstrument directly from the command line. Instead of writing python script.py, type pyinstrument script.py. Your script will run as normal, and at the end (or when you press ^C), Pyinstrument will output a colored summary showing where most of the time was spent.
Here are the options you can use:
Usage: pyinstrument [options] scriptfile [arg] ...

Options:
  --version             show program's version number and exit
  -h, --help            show this help message and exit
  --load-prev=ID        Instead of running a script, load a previous report
  -m MODULE_NAME        run library module as a script, like 'python -m
                        module'
  -o OUTFILE, --outfile=OUTFILE
                        save to <outfile>
  -r RENDERER, --renderer=RENDERER
                        how the report should be rendered. One of: 'text',
                        'html', 'json', or python import path to a renderer
                        class
  -t, --timeline        render as a timeline - preserve ordering and don't
                        condense repeated calls
  --hide=EXPR           glob-style pattern matching the file paths whose
                        frames to hide. Defaults to '*/lib/*'.
  --hide-regex=REGEX    regex matching the file paths whose frames to hide.
                        Useful if --hide doesn't give enough control.
  --show-all            (text renderer only) show external library code
  --unicode             (text renderer only) force unicode text output
  --no-unicode          (text renderer only) force ascii text output
  --color               (text renderer only) force ansi color text output
  --no-color            (text renderer only) force no color text output
Protip: -r html will give you a interactive profile report as HTML - you can really explore this way!
Profile a specific chunk of code
Pyinstrument also has a Python API. Just surround your code with Pyinstrument, like this:
from pyinstrument import Profiler

profiler = Profiler()
profiler.start()

# code you want to profile

profiler.stop()

print(profiler.output_text(unicode=True, color=True))
(You can omit the unicode and color flags if your output/terminal does not support them.)
Protip: To explore the profile in a web browser, use profiler.open_in_browser(). To save this HTML for later, use profiler.output_html().
Profile a web request in Django
To profile Django web requests, add pyinstrument.middleware.ProfilerMiddleware to MIDDLEWARE_CLASSES in your settings.py.
Once installed, add ?profile to the end of a request URL to activate the profiler. Your request will run as normal, but instead of getting the response, you'll get pyinstrument's analysis of the request in a web page.
If you're writing an API, it's not easy to change the URL when you want to profile something. In this case, add PYINSTRUMENT_PROFILE_DIR = 'profiles' to your settings.py. Pyinstrument will profile every request and save the HTML output to the folder profiles in your working directory.
If you want to show the profiling page depending on the request you can define PYINSTRUMENT_SHOW_CALLBACK as dotted path to a function used for determining whether the page should show or not. You can provide your own function callback(request) which returns True or False in your settings.py.
def custom_show_pyinstrument(request):
    return request.user.is_superuser


PYINSTRUMENT_SHOW_CALLBACK = "%s.custom_show_pyinstrument" % __name__
Profile a web request in Flask
A simple setup to profile a Flask application is the following:
from flask import Flask, g, make_response, request
app = Flask(__name__)

@app.before_request
def before_request():
    if "profile" in request.args:
        g.profiler = Profiler()
        g.profiler.start()


@app.after_request
def after_request(response):
    if not hasattr(g, "profiler"):
        return response
    g.profiler.stop()
    output_html = g.profiler.output_html()
    return make_response(output_html)
This will check for the ?profile query param on each request and if found, it starts profiling. After each request where the profiler was running it creates the html output and returns that instead of the actual response.
Profile something else?
I'd love to have more ways to profile using Pyinstrument - e.g. other web frameworks. PRs are encouraged!
How is it different to profile or cProfile?
Statistical profiling (not tracing)
Pyinstrument is a statistical profiler - it doesn't track every function call that your program makes. Instead, it's recording the call stack every 1ms.
That gives some advantages over other profilers. Firstly, statistical profilers are much lower-overhead than tracing profilers.
| Django template render × 4000 | Overhead | |
|---|---|---|
| Base | ████████████████ 0.33s |
|
| pyinstrument | ████████████████████ 0.43s |
30% |
| cProfile | █████████████████████████████ 0.61s |
84% |
| profile | ██████████████████████████████████...██ 6.79s |
2057% |
But low overhead is also important because it can distort the results. When using a tracing profiler, code that makes a lot of Python function calls invokes the profiler a lot, making it slower. This distorts the results, and might lead you to optimise the wrong part of your program!
Full-stack recording
The standard Python profilers profile and cProfile show you a big list of functions, ordered by the time spent in each function. This is great, but it can be difficult to interpret why those functions are getting called. It's more helpful to know why those functions are called, and which parts of user code were involved.
For example, let's say I want to figure out why a web request in Django is slow. If I use cProfile, I might get this:
151940 function calls (147672 primitive calls) in 1.696 seconds

   Ordered by: cumulative time

   ncalls  tottime  percall  cumtime  percall filename:lineno(function)
        1    0.000    0.000    1.696    1.696 profile:0(<code object <module> at 0x1053d6a30, file "./manage.py", line 2>)
        1    0.001    0.001    1.693    1.693 manage.py:2(<module>)
        1    0.000    0.000    1.586    1.586 __init__.py:394(execute_from_command_line)
        1    0.000    0.000    1.586    1.586 __init__.py:350(execute)
        1    0.000    0.000    1.142    1.142 __init__.py:254(fetch_command)
       43    0.013    0.000    1.124    0.026 __init__.py:1(<module>)
      388    0.008    0.000    1.062    0.003 re.py:226(_compile)
      158    0.005    0.000    1.048    0.007 sre_compile.py:496(compile)
        1    0.001    0.001    1.042    1.042 __init__.py:78(get_commands)
      153    0.001    0.000    1.036    0.007 re.py:188(compile)
  106/102    0.001    0.000    1.030    0.010 __init__.py:52(__getattr__)
        1    0.000    0.000    1.029    1.029 __init__.py:31(_setup)
        1    0.000    0.000    1.021    1.021 __init__.py:57(_configure_logging)
        2    0.002    0.001    1.011    0.505 log.py:1(<module>)
It's often hard to understand how your own code relates to these traces.
Pyinstrument records the entire stack, so tracking expensive calls is much easier. It also hides library frames by default, letting you focus on your app/module is affecting performance.
  _     ._   __/__   _ _  _  _ _/_   Recorded: 14:53:35  Samples:  131
 /_//_/// /_\ / //_// / //_'/ //    Duration: 3.131     CPU time: 0.195
/   _/                    v3.0.0b3

Program: examples/django_example/manage.py runserver --nothreading --noreload

3.131 <module>  manage.py:2
└─ 3.118 execute_from_command_line  django/core/management/__init__.py:378
      [473 frames hidden]  django, socketserver, selectors, wsgi...
         2.836 select  selectors.py:365
         0.126 _get_response  django/core/handlers/base.py:96
         └─ 0.126 hello_world  django_example/views.py:4
'Wall-clock' time (not CPU time)
Pyinstrument records duration using 'wall-clock' time. When you're writing a program that downloads data, reads files, and talks to databases, all that time is included in the tracked time by pyinstrument.
That's really important when debugging performance problems, since Python is often used as a 'glue' language between other services. The problem might not be in your program, but you should still be able to find why it's slow.
How does it work?
Pyinstrument interrupts the program every 1ms and records the entire stack at that point. It does this using a C extension and PyEval_SetProfile, but only taking readings every 1ms. Check out this blog post for more info.
You might be surprised at how few samples make up a report, but don't worry, it won't decrease accuracy. The default interval of 1ms is a lower bound for recording a stackframe, but if there is a long time spent in a single function call, it will be recorded at the end of that call. So effectively those samples were 'bunched up' and recorded at the end.
Known issues
- Profiling code inside a Docker container can cause some strange results, because the gettimeofday syscall that pyinstrument uses is slow in that environment. See #83
- When using
pyinstrument script.pywherescript.pycontains a class serialized withpickle, you might encounter errors because the serialisation machinery doesn't know where__main__is. See this issue for workarounds
Changelog
v3.3.0
- Fixed issue with
pyinstrument -m module, where pyinstrument wouldn't find modules in the current directory. - Dropped support for Python 2.7 and 3.5. Old versions will remain available on PyPI, and pip should choose the correct one automatically.
v3.2.0
- Added the ability to track time in C functions. Minor note - Pyinstrument will record time spent C functions as 'leaf' functions, due to a limitation in how Python records frames.
Python -> C -> Pythonis recorded asPython -> Python, butPython -> Python -> Cwill be attributed correctly. (#103)
v3.1.2
- Fix
<__array_function__ internals>frames appearing as app code in reports
v3.1.1
- Added support for timeline mode on HTML and JSON renderers
- Released as a tarball as well as a universal wheel
v3.1.0
- Added PYINSTRUMENT_SHOW_CALLBACK option on the Django middleware to add a condition to showing the profile (could be used to run pyinstrument on a live server!)
- Fixed bug in the Django middleware where file would not be written because of a unicode error
v3.0.3
- Fixed bug with the Django middleware on Windows where profiling would fail because we were trying to put an illegal character '?' in the profile path. (#66)
v3.0.2
- Add
--showand--show-regexoptions, to mark certain files to be displayed. This helps to profile inside specific modules, while hiding others. For example,pyinstrument --show '*/sympy/*' script.py.
v3.0.1
- Fix #60: pass all arguments after -m module_name to the called module
- Fix crash during HTML/JSON output when no frames were captured.
v3.0.0
-
Pyinstrument will now hide traces through libraries that you're using by default. So instead of showing you loads of frames going through the internals of something external e.g. urllib, it lets you focus on your code.
Before After 
To go back to the old behaviour, use
--show-allon the command line. -
'Entry' frames of hidden groups are shown, so you know which call is the problem
-
Really slow frames in the groups are shown too, e.g. the 'read' call on the socket
-
Application code is highlighted in the console
-
Additional metrics are shown at the top of the trace - timestamp, number of samples, duration, CPU time
-
Hidden code is controlled by the
--hideor--hide-regexoptions - matching on the path of the code files.--hide=EXPR glob-style pattern matching the file paths whose frames to hide. Defaults to '*/lib/*'. --hide-regex=REGEX regex matching the file paths whose frames to hide. Useful if --hide doesn't give enough control. -
Outputting a timeline is supported from the command line.
-t, --timeline render as a timeline - preserve ordering and don't condense repeated calls -
Because there are a few rendering options now, you can load a previous profiling session using
--load-prev- pyinstrument keeps the last 10 sessions. -
Hidden groups can also call back into application code, that looks like this:

-
(internal) When recording timelines, frame trees are completely linear now, allowing for the creation of super-accurate frame charts.
-
(internal) The HTML renderer has been rewritten as a Vue.js app. All the console improvements apply to the HTML output too, plus it's interactive.
-
(internal) A lot of unit and integration tests added!
Yikes! See #49 for the gory details. I hope you like it.
v2.3.0
- Big refactor!
Recordershave been removed. The frame recording is now internal to theProfilerobject. This means the 'frame' objects are more general-purpose, which paves the way for...- Processors! These are functions that mutate the tree to sculpt the output. They are used by the renderers to filter the output to the correct form. Now, instead of a time-aggregating recorder, the profiler just uses timeline-style recording (this is lower-overhead anyway) and the aggregation is done as a processing step.
- The upshot of this is that it's now way easier to alter the tree to filter stuff out, and do more advanced things like combining frames that we don't care about. More features to come that use this in v3.0!
- Importlib frames are removed - you won't see them at all. Their children are retained, so imports are just transparent.
- Django profile file name is now limited to a hundred of characters (#50)
- Fix bug with --html option (#53)
- Add
--versioncommand line option
v2.2.1
- Fix crash when using on the command line.
v2.2.0
-
Added support for JSON output. Use
pyinstrument --renderer=json scriptfile.py. PR -
@iddan has put together an interactive viewer using the JSON output!

-
When running
pyinstrument --htmland you don't pipe the output to a file, pyinstrument will write the console output to a temp file and open that in a browser.
v2.1.0
- Added support for running modules with pyinstrument via the command line. The new syntax is the
-mflag e.g.pyinstrument -m module_name! PR
v2.0.4
- Fix crashes due to multi-threaded use of pyinstrument. The fix is in the C extension, over at https://github.com/joerick/pyinstrument_cext/pull/3
v2.0.3
-
Pyinstrument can now be used in a
withblock.For example:
profiler = pyinstrument.Profiler() with profiler: # do some work here... print(profiler.output_text()) -
Middleware fix for older versions of Django
v2.0.2
- Fix for max recursion error when used to profile programs with a lot of frames on the stack.
v2.0.1
- Ensure license is included in the sdist.
v2.0.0
-
Pyinstrument uses a new profiling mode. Rather than using signals, pyintrument uses a new statistical profiler built on PyEval_SetProfile. This means no more main thread restriction, no more IO errors when using Pyinstrument, and no need for a separate more 'setprofile' mode!
-
Renderers. Users can customize Pyinstrument to use alternative renderers with the
rendererargument onProfiler.output(), or using the--rendererargument on the command line. -
Recorders. To support other use cases of Pyinstrument (e.g. flame charts), pyinstrument now has a 'timeline' recorder mode. This mode records captured frames in a linear way, so the program execution can be viewed on a timeline.
v0.13
pyinstrumentcommand. You can now profile python scripts from the shell by running$ pyinstrument script.py. This is now equivalent topython -m pyinstrument. Thanks @asmeurer!
v0.12
-
Application code is highlighted in HTML traces to make it easier to spot
-
Added
PYINSTRUMENT_PROFILE_DIRoption to the Django interface, which will log profiles of all requests to a file the specified folder. Useful for profiling API calls. -
Added
PYINSTRUMENT_USE_SIGNALoption to the Django interface, for use when signal mode presents problems.
Contributing
To run pyinstrument from the git repo or a source checkout, you must first run
python setup.py build
This compiles the Javascript code needed for the HTML output. You will need node installed (Node isn't required for the pip install as the Javascript is already pre-built in the wheel).
To setup a dev environment, do:
virtualenv --python=python3 env
. env/bin/activate
pip install -r requirements-dev.txt
To get some sample output:
pyinstrument examples/wikipedia_article_word_count.py
To run the tests:
pytest


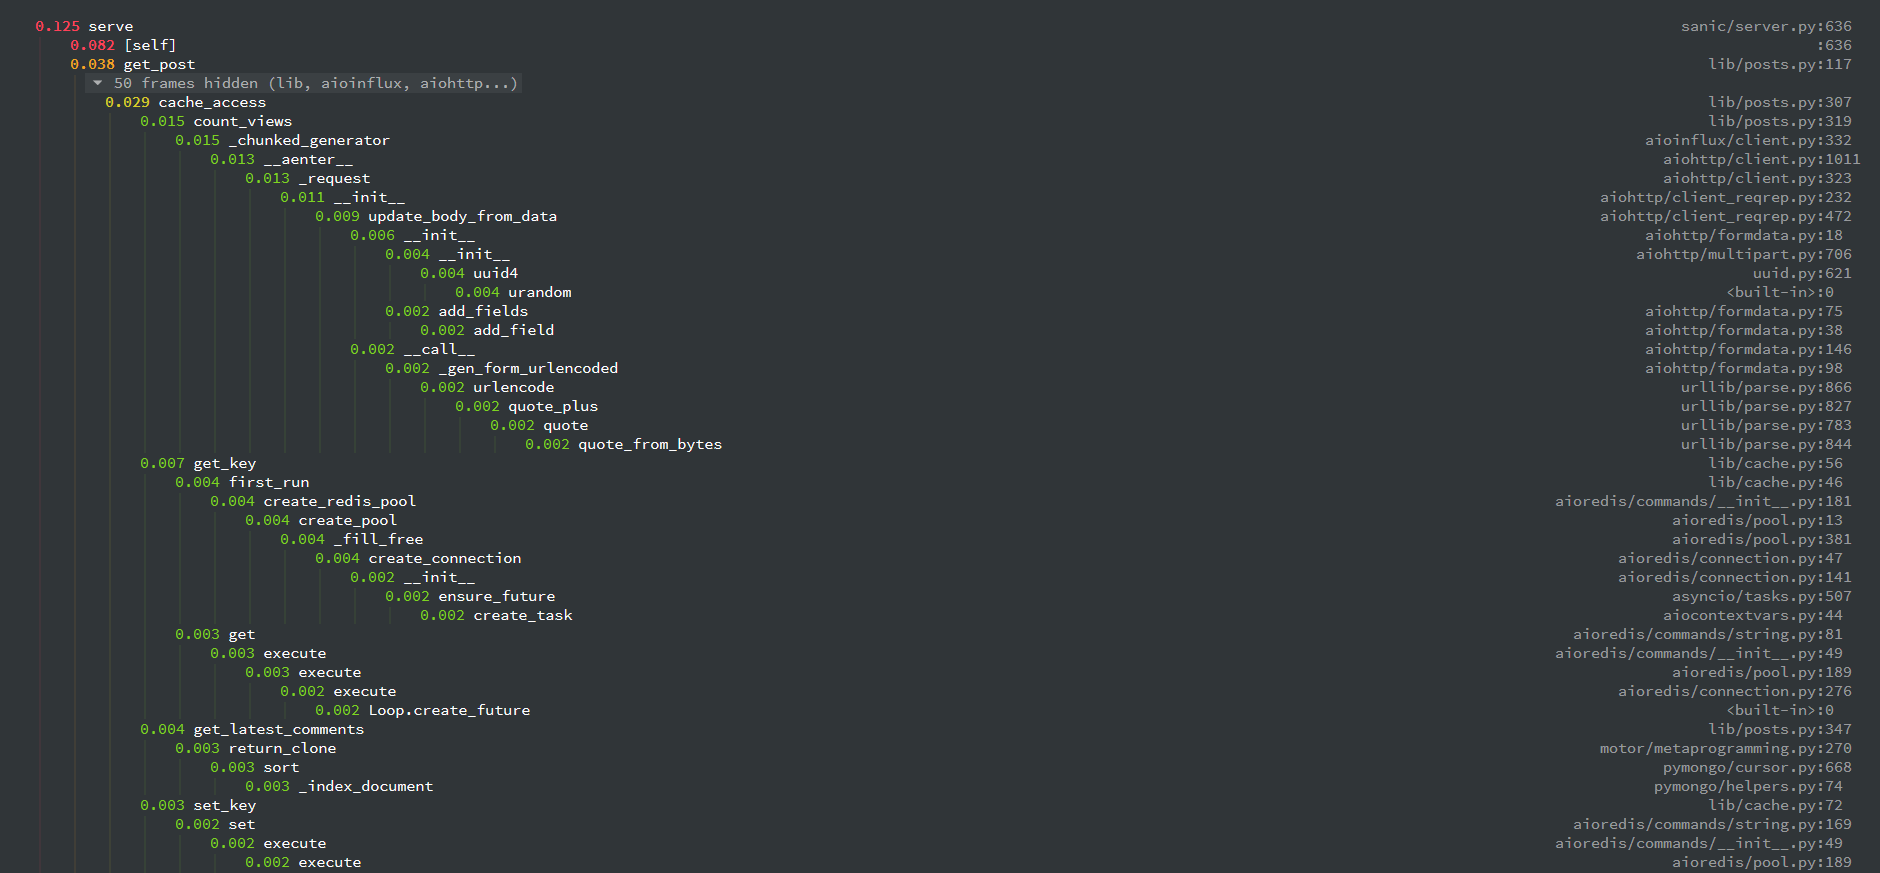
![Asyncio applications have a mysterious [SELF] function](https://avatars.githubusercontent.com/u/25571984?v=4)


 1k Jan 1, 2023
 3.9k Dec 19, 2022
 138 Dec 30, 2022
 3k Dec 27, 2022
 17 Aug 23, 2022
 10 Oct 12, 2022
 300 Dec 26, 2022
 15.6k Jan 2, 2023
 22k Jan 4, 2023
 466 Dec 11, 2022
 33 Apr 5, 2022
 3.7k Dec 30, 2022
 80 Nov 18, 2022
 996 Jan 1, 2023
 3.2k Jan 7, 2023
 663 Dec 29, 2022
 9k Jan 2, 2023
 1.6k Dec 31, 2022
 1.7k Jan 5, 2023