A python module for scientific analysis of 3D objects based on VTK and Numpy

Overview

vlogo

lics Anaconda-Server Badge Ubuntu 20.10 DOI Downloads CircleCI

A lightweight and powerful python module for scientific analysis and visualization of 3d objects.

✨ Philosophy

Inspired by the vpython manifesto "3D programming for ordinary mortals", vedo makes it easy to work with 3D pointclouds, meshes and volumes, in just a few lines of code, even for less experienced programmers.

vedo is based on VTK and numpy, with no other dependencies.

πŸ’Ύ Installation

pip install vedo
additional installation details [click to expand]
  • To install the latest dev version of vedo:
    pip install -U git+https://github.com/marcomusy/vedo.git

  • To install from the conda-forge channel:
    conda install -c conda-forge vedo

  • Sometimes an older version of VTK can yield better visualizations with transparent objects, to install it use: pip install vtk==8.1.2 (if available on your system).

  • To use in jupyter notebooks use function vedo.embedWindow(), you may want to install k3d with:
    pip install k3d==2.7.4

πŸ“™ Documentation

The webpage of the library with documentation is available here.

πŸ“Œ Need help? Have a question, or wish to ask for a missing feature?

Do not hesitate to open a issue

🎨 Features

The library includes a large set of working examples for a wide range of functionalities:

working with polygonal meshes and point clouds [click to expand]
  • Import meshes from VTK format, STL, Wavefront OBJ, 3DS, Dolfin-XML, Neutral, GMSH, OFF, PCD (PointCloud),
  • Export meshes as ASCII or binary to VTK, STL, OBJ, PLY ... formats.
  • Analysis tools like Moving Least Squares, mesh morphing and more..
  • Tools to visualize and edit meshes (cutting a mesh with another mesh, slicing, normalizing, moving vertex positions, etc..).
  • Split mesh based on surface connectivity. Extract the largest connected area.
  • Calculate areas, volumes, center of mass, average sizes etc.
  • Calculate vertex and face normals, curvatures, feature edges. Fill mesh holes.
  • Subdivide faces of a mesh, increasing the number of vertex points. Mesh simplification.
  • Coloring and thresholding of meshes based on associated scalar or vectorial data.
  • Point-surface operations: find nearest points, determine if a point lies inside or outside of a mesh.
  • Create primitive shapes: spheres, arrows, cubes, torus, ellipsoids...
  • Generate glyphs (associate a mesh to every vertex of a source mesh).
  • Create animations easily by just setting the position of the displayed objects in the 3D scene. Add trailing lines and shadows to moving objects is supported.
  • Straightforward support for multiple sync-ed or independent renderers in the same window.
  • Registration (alignment) of meshes with different techniques.
  • Mesh smoothing.
  • Delaunay triangulation in 2D and 3D.
  • Generate meshes by joining nearby lines in space.
  • Find the closest path from one point to another, traveling along the edges of a mesh.
  • Find the intersection of a mesh with lines, planes or other meshes.
  • Interpolate scalar and vectorial fields with Radial Basis Functions and Thin Plate Splines.
  • Add sliders and buttons to interact with the scene and the individual objects.
  • Visualization of tensors.
  • Analysis of Point Clouds:
  • Moving Least Squares smoothing of 2D, 3D and 4D clouds
  • Fit lines, planes, spheres and ellipsoids in space
  • Identify outliers in a distribution of points
  • Decimate a cloud to a uniform distribution.
working with volumetric data and tetrahedral meshes
  • Import data from VTK format volumetric TIFF stacks, DICOM, SLC, MHD and more
  • Import 2D images as PNG, JPEG, BMP
  • Isosurfacing of volumes
  • Composite and maximum projection volumetric rendering
  • Generate volumetric signed-distance data from an input surface mesh
  • Probe volumes with lines and planes
  • Generate stream-lines and stream-tubes from vectorial fields
  • Slice and crop volumes
  • Support for other volumetric structures (structured and grid data)
plotting and histogramming in 2D and 3D
  • Polygonal 3D text rendering with Latex-like syntax and unicode characters, with 14 different fonts.
  • Fully customizable axis styles
  • donut plots and pie charts
  • Scatter plots in 2D and 3D
  • Surface function plotting
  • 1D customizable histograms
  • 2D hexagonal histograms
  • Polar plots, spherical plots and histogramming
  • Draw latex-formatted formulas in the rendering window.
  • Quiver, violin, whisker and stream-line plots
  • Graphical markers analogous to matplotlib
integration with other libraries
  • Integration with the Qt5 framework.
  • Support for FEniCS/Dolfin platform for visualization of PDE/FEM solutions.
  • Interoperability with the trimesh, pyvista and pymeshlab libraries.
  • Export 3D scenes and embed them into a web page.
  • Embed 3D scenes in jupyter notebooks with K3D (can export an interactive 3D-snapshot page here).

⌨ Command Line Interface

Visualize a polygonal mesh or a volume from a terminal window simply with:

vedo https://vedo.embl.es/examples/data/embryo.tif

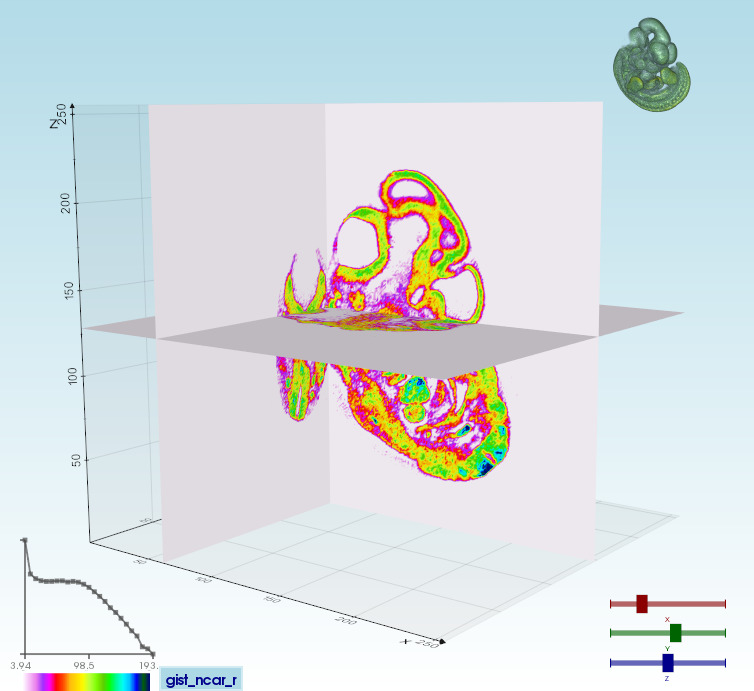
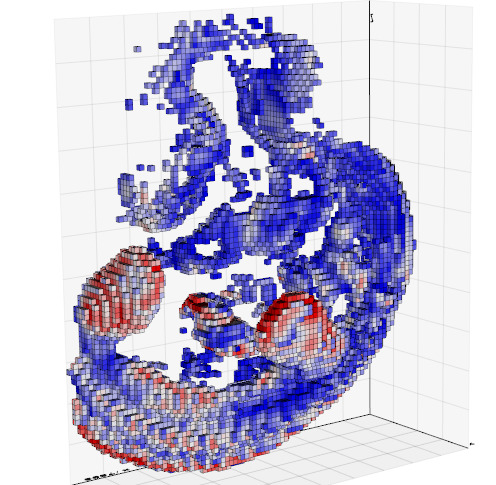
Volumetric files (mhd, vti, slc, tiff, DICOM etc..) can be visualized in different modes:

Volume 3D slicing
vedo --slicer embryo.slc
Ray-casting
vedo -g
2D slicing
vedo --slicer2d
Colorize voxels
vedo --lego
slicer isohead viz_slicer lego

Type vedo -h for the complete list of options.

🐾 Gallery

vedo currently includes 300+ working examples and notebooks.

bunny dolf greyscott
Work with volumes, tetrahedral and polygonal meshes. Interoperability with external libraries like FEniCs, trimesh, meshio, pyvista, and pymeshlab. Animations of physical systems (above, a system of reaction-diffusion).

Run any of the built-in examples. In a terminal type: vedo -r earthquake_browser

Check out the example galleries organized by subject here:


πŸ“œ References

Scientific publications leveraging vedo:

  • X. Diego et al.: "Key features of Turing systems are determined purely by network topology", Physical Review X, 20 June 2018.
  • M. Musy, K. Flaherty et al.: "A Quantitative Method for Staging Mouse Limb Embryos based on Limb Morphometry", Development, 5 April 2018, doi: 10.1242/dev.154856.
  • G. Dalmasso et al., "Evolution in space and time of 3D volumetric images", in preparation.
  • F. Claudi, A. L. Tyson, T. Branco, "Brainrender. A python based software for visualisation of neuroanatomical and morphological data.", DOI.
  • J. S. Bennett, D. Sijacki, "Resolving shocks and filaments in galaxy formation simulations: effects on gas properties and star formation in the circumgalactic medium", Monthly Notices of the Royal Astronomical Society, Vol. 499, Issue 1, Nov. 2020, DOI.
  • J.D.P. Deshapriya et al., "Spectral analysis of craters on (101955) Bennu". (DOI: 10.1016/j.icarus.2020.114252)
  • A. Pollack et al., *"Stochastic inversion of gravity, magnetic, tracer, lithology, and fault data for geologically realistic structural models: Patua Geothermal Field case study" Geothermics Volume 95, September 2021, doi: 10.1016/j.geothermics.2021.102129.
  • X. Lu et al., "3D electromagnetic modeling of graphitic faults in the Athabasca Basin using a finite-volume time-domain approach with unstructured grids" doi: 10.1190.

Have you found this software useful for your research? Star ✨ the project and cite it as:

M. Musy et al., "vedo, a python module for scientific analysis and visualization of 3D objects and point clouds", Zenodo, 2021, doi: 10.5281/zenodo.4609336.

embl_logo

Comments
  • up/oversampling point cloud with vedo for balancing feature distribution

    up/oversampling point cloud with vedo for balancing feature distribution

    Hi @marcomusy,

    I was wondering if vedo has any upsampling method for point and feature vectors on point clouds like SMOTE or something alike. For example I have the following point cloud:

    pcd_oversampling

    where for each point (x,y,z) I have a corresponding feature vector, eg light intensity, among others (normals, reflectance factor, area, etc). Now if I check the distribution of the values in this feature vector (grouped in 9 clusters) I will notice that is heavily imbalanced:

    image

    and this is how the clusters correspond to the point cloud:

    image

    you will notice that values with high range (or really low range) are only a few (the bright area in the first image). Now what I would like to do is to created "fake" points (around these areas based on the lux values that lack in the distribution) so that to bring this distribution in a balanced form but at the same time populate with relevant values (as much as this is possible) in the other feature vectors that each new "fake" point will have.

    Any idea whether this could be achieved?

    I am attaching a .csv file in case it helps where each column corresponds to the following attributes for each point in the point cloud: [x, y, z, light_intensity, reflectance_red, reflectance_green, reflectance_blue, normal_x, normal_y, normal_z, area, lux_value, cluster_id] so I would l like to create new points and values for the other feature vectors so that the "lux_value" distribution gets balanced.

    Thanks. data.zip

    bug fixed 
    opened by ttsesm 45
  • setting title and color bar, directed graph

    setting title and color bar, directed graph

    Hi @marcomusy

    This is a follow up to my question on SO. I'd like to ask for clarification on the following,

    1. I'd like to know how to assign symbols in title of a scalarbar. Latex formatting doesn't work e.g. nx_pts.pointColors(vals, cmap='YlGn', vmin=min(vals), vmax=max(vals)).addScalarBar(title='$\mu$')

    2. How can we set titles for plot? I tried, show(nx_pts, nx_edg, nx_pts.labels('id'), interactive=True, bg='black', title='plot') this doesn't display the title.

    3. Is it possible to create discontinuous color bars? For example, while trying to assign the following set of values that contains an outlier vals = [100, .80, .10, .79, .70, .60, .75, .78, .65, .90] all entries, except 100, are assigned the same color.

    Please find the complete code below,

    import networkx as nx
    from vedo import *
    
    G = nx.gnm_random_graph(n=10, m=15, seed=1)
    nxpos = nx.spring_layout(G)
    nxpts = [nxpos[pt] for pt in sorted(nxpos)]
    
    nx_lines = []
    for i, j in G.edges():
        p1 = nxpos[i].tolist() + [0]  # add z-coord
        p2 = nxpos[j].tolist() + [0]
        nx_lines.append([p1, p2])
    
    nx_pts = Points(nxpts, r=12)
    nx_edg = Lines(nx_lines).lw(2)
    
    # node values
    vals = [100, .80, .10, .79, .70, .60, .75, .78, .65, .90]
    nx_pts.pointColors(vals, cmap='YlGn', vmin=min(vals), vmax=max(vals)).addScalarBar(title='$\mu$')
    show(nx_pts, nx_edg, nx_pts.labels('id'), interactive=True, bg='black', title='plot')
    
    
    1. How to convert the above graph, G, to a directed graph? From the suggestion offered on SO, I could use g = DirectedGraph(layout='fast2d')

    I am not sure how to add edges ed_ls = [(0, 6), (0, 7), (0, 5), (8, 0), (0, 4), (1, 4), (1, 7), (1, 9), (2, 9), (3, 6), (3, 4), (8, 3), (3, 5), (3, 7), (6, 9)] for each item in ed_ls, e.g. (0,6) the edge is directed from 0 to 6. Thanks a lot

    enhancement help wanted testing-phase 
    opened by DeepaMahm 38
  • can't interact with show and mouse

    can't interact with show and mouse

    Hello, Very nice job, I am struggling with interacting with 3d window (on windows, python) I tried : vp = Plotter(bg='black')

    show both Volume and Mesh

    vp.show(vol1,vol2,interactive=0) vp.interactor.Render() vp.interactor.Start()

    and onmy show with interactive=True but everytime I click in the window it's closing.... I guess I missed something Best, Arnaud

    testing-phase 
    opened by cyrenaique 36
  • Snapping multiple meshes together and extract transformation matrices

    Snapping multiple meshes together and extract transformation matrices

    Hi @marcomusy,

    I have the following problem that I am trying to address and I am trying to figure out how possibly I could automate the whole procedure. Imagine that I have multiple pieces of a complete object which are randomly given as input (different orientation, position, etc) and then I would like to find a way to automatize (not perfectly) how to assemble them all together to the final object and extract the transformation matrices. So imagine that I have the following 5 pieces: output1

    which if you put them together in the correct order you should get the following complete object: image

    Currently someone could do that manually by using a corresponding 3d analysis tool, e.g. Meshlab, CloudCompare, Blender, Meshmixer, etc... and as I did. However, this takes a lot of time especially if you plan to do it for multiple objects and moreover the result still might not be the best. Thus, I wanted to ask you from your experience if you know any tool that could help me on that or if you believe I could do something with vedo.

    My idea would be to extract some kind of boundary/shape contours and try to apply some kind of shape fitting metric or something similar but I am not sure what that could be. I've found your discussion here about shape decomposition but I am not sure whether this could be related or not. I've tried to apply and test with different aligning algorithms but these are not working properly since they look for similar features that overlay each other while in this case I am looking for features that complement each other instead.

    Any idea is welcome.

    p.s. actually even an easier interactive mode, where I can select whether two edges should snap together would be helpful in regards to the current solution where I am trying to bring two pieces close together manually.

    tombstone.zip

    opened by ttsesm 31
  • VTK Lagrange elements in 3D elements is not rendered correctly

    VTK Lagrange elements in 3D elements is not rendered correctly

    MWE using dolfinx:

    from mpi4py import MPI
    import vedo
    import numpy as np
    import dolfinx
    import dolfinx.io
    
    mesh = dolfinx.UnitCubeMesh(MPI.COMM_WORLD, 1, 1, 1, dolfinx.cpp.mesh.CellType.hexahedron)
    geo = mesh.geometry.x
    num_cells = mesh.topology.index_map(mesh.topology.dim).size_local
    topo = dolfinx.cpp.mesh.entities_to_geometry(mesh, mesh.topology.dim, np.arange(num_cells, dtype=np.int32), False)
    perm_vtk = dolfinx.cpp.io.perm_vtk(mesh.topology.cell_type, topo.shape[1])
    dolfin_to_vtk = np.zeros(topo.shape[1], dtype=np.int32)
    for i in range(topo.shape[1]):
        dolfin_to_vtk[perm_vtk[i]] = i
    
    dolfinx.io.VTKFile("mesh.pvd").write(mesh)
    topo = topo[:, dolfin_to_vtk]
    mesh_vedo = vedo.Mesh([geo, topo])
    p = vedo.Plotter(shape=(1, 1), N=1, pos=(0, 0))
    p.add(mesh_vedo)
    p.show()
    p.screenshot("mesh.png")
    print(topo,"\n", geo)
    

    yields:

    [[1 4 6 2 0 5 7 3]]
     [[1. 0. 0.]
     [0. 0. 0.]
     [0. 1. 0.]
     [1. 1. 0.]
     [0. 0. 1.]
     [1. 0. 1.]
     [0. 1. 1.]
     [1. 1. 1.]]
    

    and mesh 
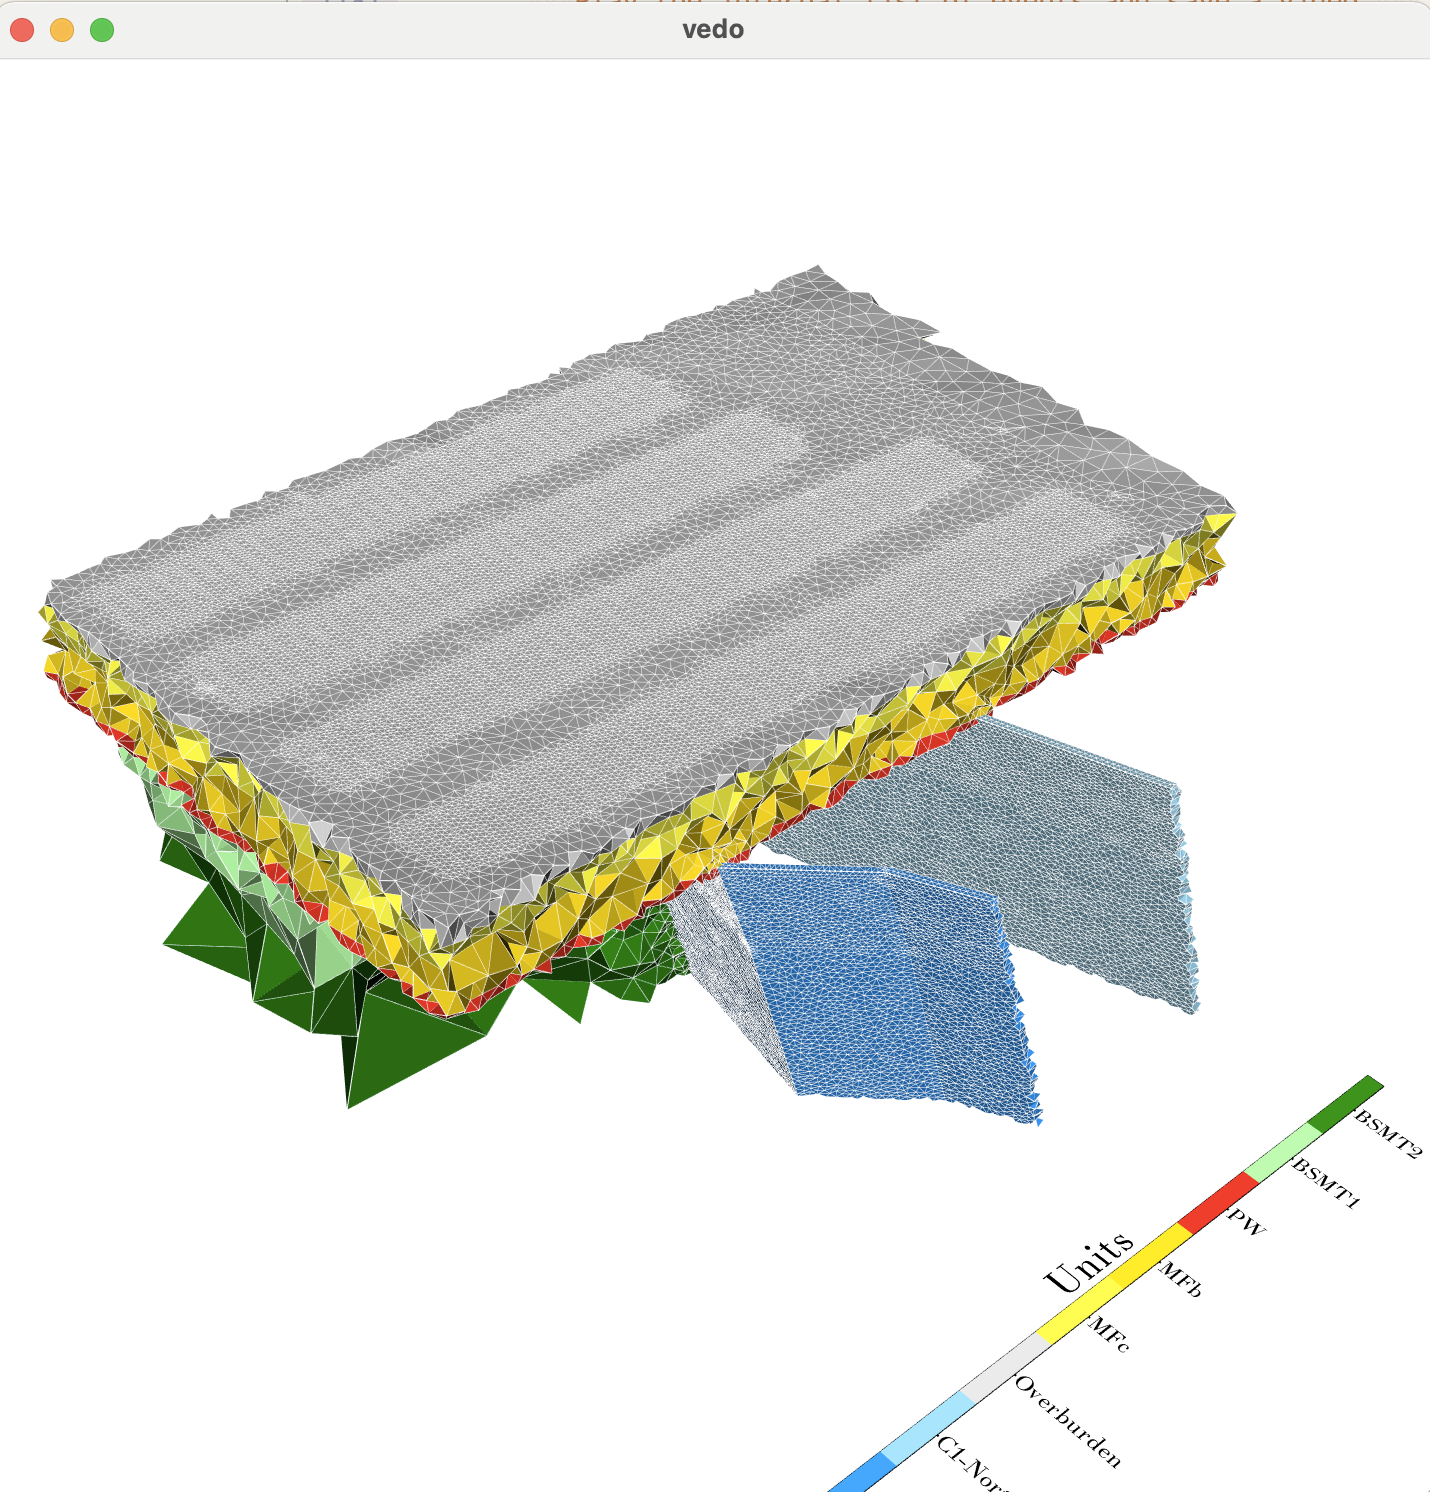
while the correponding VTU file contains;

    <?xml version="1.0"?>
    <VTKFile type="UnstructuredGrid"  version="0.1" >
    <UnstructuredGrid>
    <Piece  NumberOfPoints="8" NumberOfCells="1">
    <Points>
    <DataArray  type="Float64"  NumberOfComponents="3"  format="ascii">1 0 0  0 0 0  0 1 0  1 1 0  0 0 1  1 0 1  0 1 1  1 1 1  </DataArray>
    </Points>
    <Cells>
    <DataArray  type="Int32"  Name="connectivity"  format="ascii">1 4 6 2 0 5 7 3  </DataArray>
    <DataArray  type="Int32"  Name="offsets"  format="ascii">8 </DataArray>
    <DataArray  type="Int8"  Name="types"  format="ascii">72 </DataArray>
    </Cells>
    </Piece>
    </UnstructuredGrid>
    </VTKFile>
    

    Which is the same as the vedo mesh has, but yields hex_pvd

    enhancement 
    opened by jorgensd 30
  • Plot Glyph figures with vtu files (vtuPointData)

    Plot Glyph figures with vtu files (vtuPointData)

    Here come the vector plot issues mainly with vtu Glyph...

    I have vtu files (binary format obtained from pyevtk) which are basically made up of points with coordinates and attributes. One scalar attribute named 'E', and one vector attribute named 'direction'. With Paraview, I can create a Glyph plot by selecting the direction with the 'direction' attribute and the scalar with the 'E' attribute.

    I think with vedo, from the examples that I see, it mainly uses Arrows object to create these 3D vector plots. Is there a way to directly plot the information in the vtu file? I can certainly go back to work with my original data before they were converted to vtu, but it would be good to know whether using vtu files directly is possible or not.

    A vtu file exmaple: extra_B_21.vtu.zip Figure plotted using Paraview (the red rectangle represents a conductor): image

    enhancement fixed 
    opened by XushanLu 25
  • How to show scalars as categories with a scalar bar (and how to move labels of an axis to the other side)

    How to show scalars as categories with a scalar bar (and how to move labels of an axis to the other side)

    Two issues here related to the following plot:

    image

    Here is the code I used to plot the figure:

    import numpy as np
    from vedo import TetMesh, show, screenshot, settings, Picture, buildLUT, Box, \
        Plotter
    
    import time as tm
    
    settings.defaultFont = 'Kanopus'
    # settings.useParallelProjection = True # avoid perspective parallax
    
    tet = TetMesh('final_mesh.1.vtk')
    # Clone the TetMesh object and threshold it to get the conducotrs
    conductor = tet.clone().threshold(name='cell_scalars', above=0, below=4)
    cond = conductor.tomesh().lineWidth(2).lineColor([7, 15, 190])
    
    tet.threshold(name='cell_scalars', above=0, below=15)
    msh = tet.tomesh().lineWidth(2).lineColor([7, 15, 190])
    
    # Crop the entire mesh
    bounds = [503500, 505000, 6414000, 6417000, -1830, 600]
    msh.crop(bounds=bounds)
    
    # Crop the conductor mesh
    bounds = [503500, 505200, 6414000, 6417000, -1830, 600]
    cond.crop(bounds=bounds)
    
    # We need to build a look up table for our color bar
    lut = buildLUT([
        (0.0, 'k'),
        (1.0, 'cyan'),
        (2.0, 'skyeblue'),
        (3.0, 'dodgerblue'),
        (4.0, 'blue'),
        (5.0, 'gray'),
        (6.0, 'yellow'),
        (7.0, 'gold'),
        (9.0, 'red'),
        (11.0, 'powderblue'),
        (13.0, 'lime'),
        (15.0, 'seagreen'),
    ]
    )
    
    msh.cmap(lut, 'cell_scalars', on='cells')
    # msh.cmap("coolwarm", 'cell_scalars', on='cells')
    msh.addScalarBar3D(
        pos=(505800, 6415500, -1830),
        title='Units',
        titleSize=1.5,
        sx=100,
        sy=2000,
        # titleXOffset=,
    )
    # Create cmap for cond
    cond.cmap(lut, 'cell_scalars', on='cells')
    
    axes_opt = dict(
        xtitle='Easting (m)',
        ytitle='Northing (m)',
        ztitle='Elevation (m)',
        xLabelSize=0.015,
        xTitlePosition=0.65,
        yTitlePosition=0.65,
        zTitlePosition=0.65,
        axesLineWidth=4,
        # xrange=msh.xbounds(),
        yrange=msh.ybounds(),
        # zInverted=True,
        xTitleOffset=0.1,
        # zTitleOffset=0.5,
        yzShift=1,
        tipSize=0.,
        # yLabelOffset=0.5,
    )
    
    # Set the camera position
    plt = Plotter()
    plt.camera.SetPosition( [510267.33, 6408661.841, 5262.764] )
    plt.camera.SetFocalPoint( [504361.406, 6415247.796, -650.844] )
    plt.camera.SetViewUp( [-0.397, 0.39, 0.831] )
    plt.camera.SetDistance( 10640.747 )
    plt.camera.SetClippingRange( [6131.035, 16343.212] )
    
    size = [3940, 2160]
    show(msh, cond, axes=axes_opt, size=size, interactive=True, zoom=1.2)
    screenshot('model_mesh_vedo.png')
    # npimg = screenshot(returnNumpy=True)
    # pic = Picture(npimg)
    # pic.crop(left=0.2, right=0.2, top=0.01, bottom=0.01).write('src_obs_refinement_vedo.png')
    
    # from wand import image
    
    # with image.Image(filename='src_obs_refinement_vedo.png') as imag:
    #     imag.trim(color=None, fuzz=0)
    #     imag.save(filename='src_obs_refinement_vedo_trim.png')
    
    1. How to show scalar values as categories in the scalar bar. Right now only values are shown. In Paraview, I can show scalars as categories and it seems that I can probably also do that using PyVista.
    2. The 3D axes. The yz axes used to be located at the left of the figure (default) behaviour, but that causes the z-title to be not readable (reversed, something like the below picture). Then, I had to move it to the right side. However, the titles are not moving together with the axes (both the y- and z-axis titles). Also, the labels of the y-axis is located at the left of the axis and seems to be buried under the mesh. I want to simply move them to the right of the axis. So, how to do all of these changes? image

    The vtk file used to plot the figure: final_mesh.1.vtk.zip

    Thanks in advance for any comments and suggestions!

    enhancement 
    opened by XushanLu 23
  • Delaunay triangulation from voronoi tessellation

    Delaunay triangulation from voronoi tessellation

    Hello @marcomusy, I would like to know how Delaunay triangulation can be applied to find the connectivity of the cells formed by voronoi tessellation in vedo.

    The following is the code that I'm using to generate voronoi cells using the scipy library. I'd like to do this in vedo but I am not sure how to do it.

        import numpy as np
        from scipy.spatial import Voronoi, voronoi_plot_2d
        import shapely.geometry
        import shapely.ops
        
        points = np.random.random((20, 2))
        vor = Voronoi(points)
        fig = voronoi_plot_2d(vor)
        plt.show()


    I would like to know if voronoi tessellation can be generated in vedo and find the cell connectivity by applying Delaunay triangulation. Here, I am actually looking at applying this to biological cells to find how the biological cells are connected with each other.

    Thanks a lot

    opened by DeepaMahm 22
  • Intersection between spline and line

    Intersection between spline and line

    Hey @marcomusy

    Thanks for this great package!

    A simple question, is there a way to find the intersection points between a spline and line/spline in 2d/3d?

    When I use the function spline_2d.intersectWithLine(p1, p2), I get an empty array in return. Is this because the spline is not set as a mesh?

    image

    In advance, thank you!

    Regards, Eivind

    enhancement question 
    opened by eivindtn 21
  • Matching two Meshes

    Matching two Meshes

    Previously and upon you assist me in this: https://github.com/marcomusy/vtkplotter/issues/83#issuecomment-574625775 now what I have to ask, if I have two meshes, and I need to make matching between them, we already have interest points, and from these points, and after applying few strategies, I got matching between meshes, So now, instead of having: a = [1,4,7,2,9,10,50,33,25] I got a new array having for example: b = [1,50,33,25] and this the common points between the two meshes My question would it be possible to show the two meshes, showing the main interest points, as well make lines that refer to matching depending on b like the image obtained by someone, and the color of the line will be later, depending on whether this match is correct or not. Would it be possible to do this using this library, please? 7-Figure8-1

    opened by roaasoloh 21
  • Animation: camera setting lost while rotating multiple mesh objects

    Animation: camera setting lost while rotating multiple mesh objects

    Hi @marcomusy,

    I am playing with the Animation class and I found that my camera setting got lost while I try to rotate multiple mesh objects.

    The code I used is something like this:

    #!/usr/bin/env python3
    
    import numpy as np
    from vedo import TetMesh, show, screenshot, settings, Picture, buildLUT, Box, \
        Plotter, Axes
    from vedo.applications import Animation
    
    import time as tm
    
    # Do some settings
    settings.useDepthPeeling=False  # Useful to show the axes grid
    font_name = 'Theemim'
    settings.defaultFont = font_name
    settings.multiSamples=8
    # settings.useParallelProjection = True # avoid perspective parallax
    
    # Create a TetMesh object form the vtk file
    tet = TetMesh('final_mesh.vtk')
    
    # Clone the TetMesh object and threshold it to get the conducotrs
    cond = tet.clone().threshold(name='cell_scalars', above=0, below=15)
    
    # Clone the TetMesh object and threshold it to get southern part of BSMT1
    bm1 = tet.clone().threshold(name='cell_scalars', above=22, below=22)
    # The southern part of BSMT2
    bm2 = tet.clone().threshold(name='cell_scalars', above=24, below=24)
    
    # This will get rid of the background Earth unit and air unit in the model
    # which leaves us with the central part of the model
    tet.threshold(name='cell_scalars', above=0, below=21)
    
    # Crop the entire mesh using a Box object (which is considered to be a mesh
    # object in vedo)
    # First build a Box object with its centers and dimensions
    cent = [504700, 6416500, -615]
    box = Box(pos=cent, size=(3000, 5000, 2430))
    # So, we now cut the TetMesh object with a mesh (that Box object)
    tet.cutWithMesh(box, wholeCells=True)
    # We can also cut msh directly rather than cutting tet, but that gives us
    # something uglier, like what you would get without click the 'crinkle clip'
    # option in Paraview and much worse because it would not keep mesh cells intact
    # bounds = [503500, 505000, 6414000, 6417000, -1830, 600]
    # msh.crop(bounds=bounds, wholeCells=True)
    
    # And we need to convert it to a mesh object for later plotting
    msh = tet.tomesh().lineWidth(1).lineColor('w')
    
    # Crop the conductor TetMesh object using a larger box
    cent = [505500, 6416500, -615]
    box_cond = Box(pos=cent, size=(3200, 5000, 2430))
    cond.cutWithMesh(box_cond, wholeCells=True)
    cond_msh = cond.tomesh().lineWidth(1).lineColor('w')
    
    # Also need to crop bm1 and bm2, but with a smaller box than that used for the
    # entire mesh
    cent = [504500, 6416500, -615]
    box = Box(pos=cent, size=(1500, 5000, 2430))
    bm1.cutWithMesh(box, wholeCells=True)
    bm1_msh = bm1.tomesh().lineWidth(1).lineColor('w')
    bm2.cutWithMesh(box, wholeCells=True)
    bm2_msh = bm2.tomesh().lineWidth(1).lineColor('w')
    
    # We need to build a look up table for our color bar, and now it supports
    # using category names as labels instead of the numerical values
    # This was implemented upon my request
    lut_table = [
        # Value, color, alpha, category
        (12.2, 'dodgerblue', 1, 'C1'),
        (15.2, 'skyblue', 1, 'C1-North'),
        (16.2, 'lightgray', 1, 'Overburden'),
        (18.2, 'yellow', 1, 'MFc'),
        (19.2, 'gold', 1, 'MFb'),
        (21.2, 'red', 1, 'PW'),
        (23.2, 'palegreen', 1, 'BSMT1'),
        (25.2, 'green', 1, 'BSMT2'),
    ]
    lut = buildLUT(lut_table)
    
    msh.cmap(lut, 'cell_scalars', on='cells')
    cond_msh.cmap(lut, 'cell_scalars', on='cells')
    bm1_msh.cmap(lut, 'cell_scalars', on='cells')
    bm2_msh.cmap(lut, 'cell_scalars', on='cells')
    bm_msh = bm1_msh + bm2_msh
    # msh.cmap("coolwarm", 'cell_scalars', on='cells')
    msh.addScalarBar3D(
        categories=lut_table,
        pos=(508000, 6416500, -1830),
        title='Units',
        titleSize=1.5,
        sx=100,
        sy=4000,
        titleXOffset=-2,
    )
    
    group = msh + cond_msh + bm_msh
    zlabels = [(500, '500'), (0, '0'), (-500, '-500'), (-1000, '-1000'),
               (-1500, '-1500')]
    axes = Axes(group,
                xtitle='Easting (m)',
                ytitle='Northing (m)',
                ztitle='Elevation (m)',
                xLabelSize=0.015,
                xTitlePosition=0.65,
                yTitlePosition=0.65,
                yTitleOffset=-1.18,
                yLabelRotation=90,
                yLabelOffset=-1.6,
                # yShiftAlongX=1,
                zTitlePosition=0.85,
                # zTitleOffset=0.04,
                zLabelRotation=90,
                zValuesAndLabels=zlabels,
                # zShiftAlongX=-1,
                axesLineWidth=3,
                yrange=msh.ybounds(),
                xTitleOffset=0.02,
                # yzShift=1,
                tipSize=0.,
                yzGrid=True,
                xyGrid=True,
                gridLineWidth=5,
                )
    
    # Set the camera position
    plt = Animation()
    plt.camera.SetPosition( [512921.567, 6407793.637, 8217.335] )
    plt.camera.SetFocalPoint( [505099.133, 6415752.321, -907.462] )
    plt.camera.SetViewUp( [-0.494, 0.4, 0.772] )
    plt.camera.SetDistance( 14415.028 )
    plt.camera.SetClippingRange( [7367.387, 23203.319] )
    
    size = [3940, 2160]
    
    # Trying to play with the Animation class
    plt.showProgressBar = True
    plt.timeResolution = 0.025  # secs
    
    # It would be okay if I only plot one mesh object
    # plt.fadeIn(msh, t=0, duration=0.5)
    # plt.rotate(msh, axis="y", angle=180, t=1, duration=2)
    
    # If I try to plot multiple objects, then things quickly go wrong: the mesh objects become a small point
    # in the middle of the mesh and then disappear
    plt.fadeIn([cond_msh, msh, bm1_msh, bm2_msh], t=0, duration=0.5)
    plt.rotate([cond_msh, msh, bm1_msh, bm2_msh], axis="z", angle=180, t=1, duration=3)
    plt.totalDuration = 4 # can shrink/expand total duration
    
    plt.play()
    # plt.show(msh, cond_msh, bm_msh, axes, size=size, interactive=False, resetcam=0, zoom=1.0)
    # screenshot('model_mesh_vedo.png')
    

    Here is the data required for this script to work: final_mesh.vtk.zip

    While I can try to just plot with one mesh object, it would still be interesting to make the above script work to add some more flexibility. I am not entirely sure whether I am doing something wrong or this is just the default behaviour. When you get a chance, could you please take a look at this?

    Here is what things look like before they disappear (very last frame generated in the call to faceIn function): image 
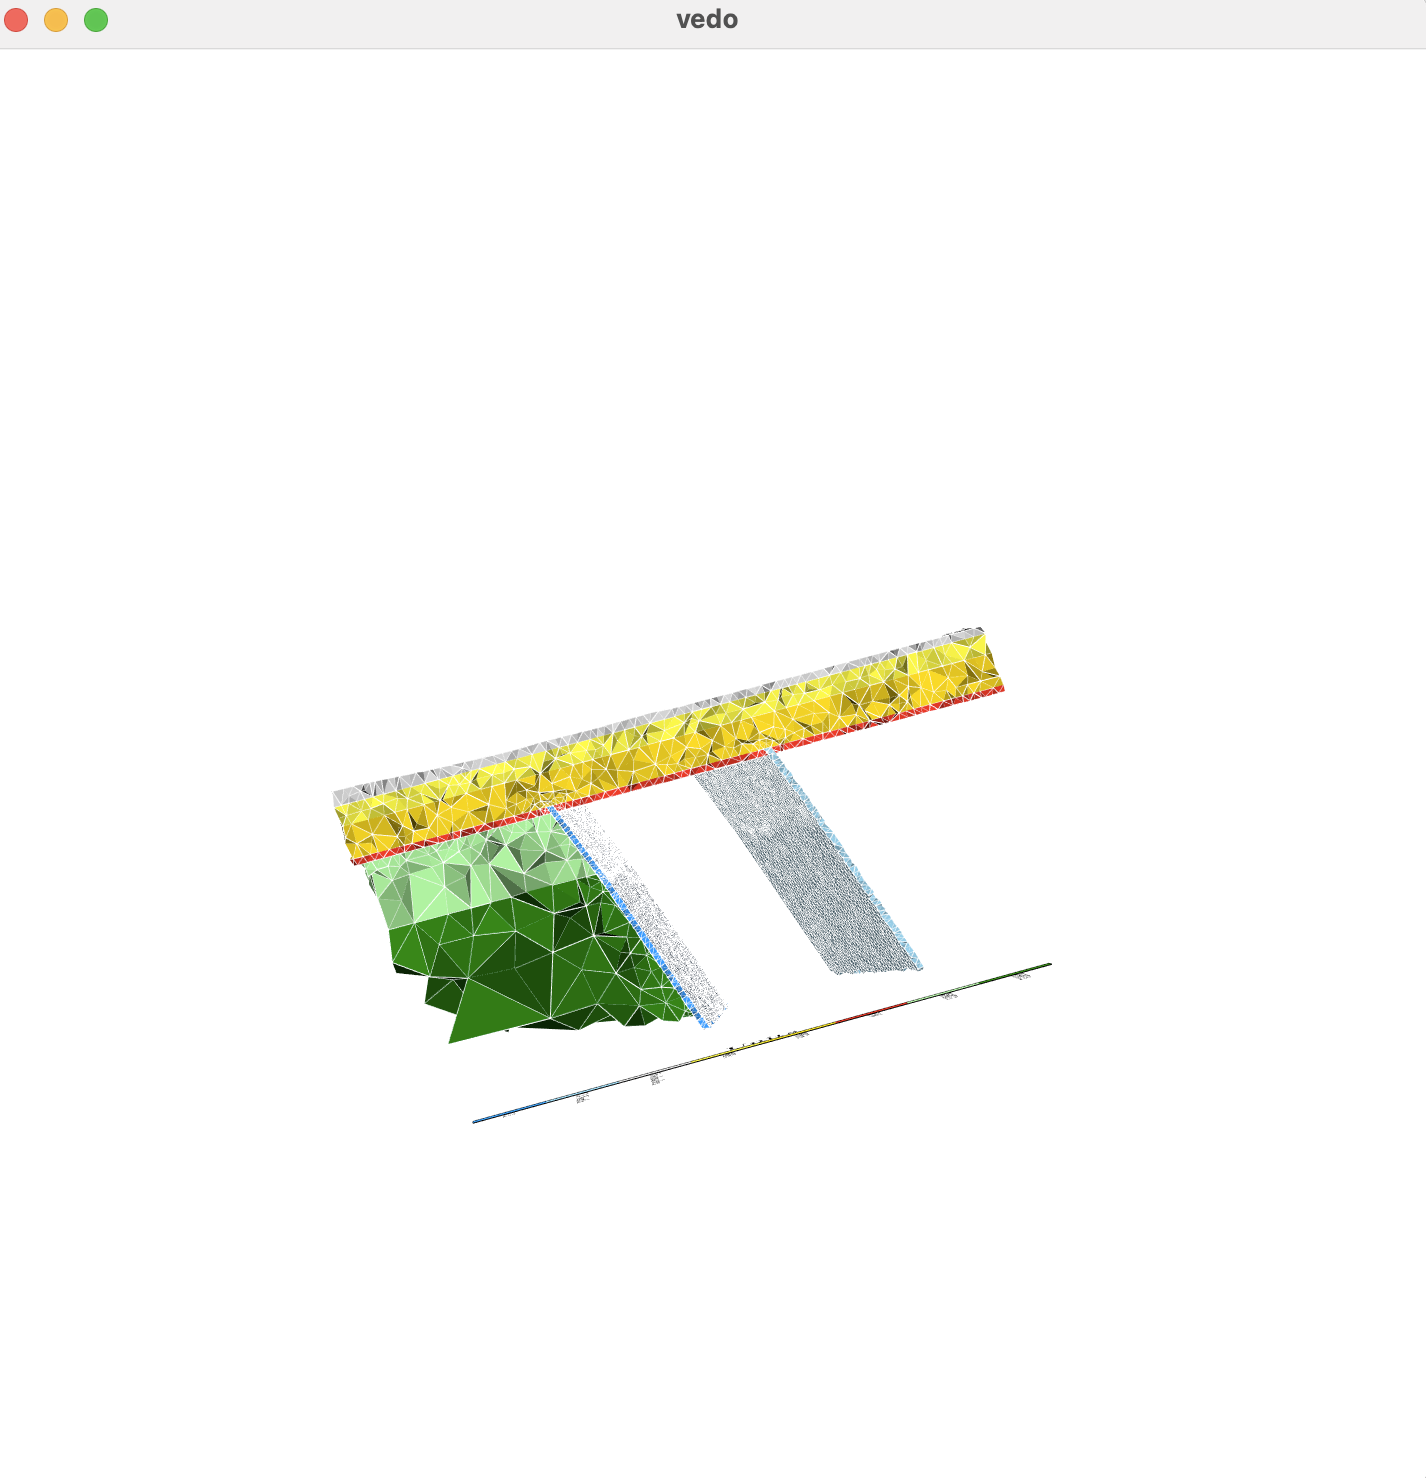
And here is what I mean by 'disappear' (can still be visible at the bottom-right coner): image You can see that they are still there if you zoom in to that area: image

    Well, I just discovered that it does not matter how many objects I rotate. This would happen even if I just rotate one object.

    Also, there is no way for me to add Axes objects because of the following error: AttributeError: 'Assembly' object has no attribute 'alpha'".

    The added 3D scalar bar also disappears.

    The .mp4 file cannot be viewed using QuickTime Player on Mac. I've tried another video player and it does not work either.

    Thanks very much, Xushan

    opened by XushanLu 20
  • Strange behavior on Plotter

    Strange behavior on Plotter

    Hi @marcomusy,

    Do you have any idea what could be causing the following behavior in the Plotter. When I load my custom mesh files I get this: Peek 2023-01-03 18-16

    When I load instead any other mesh alternative it seems to work fine: Peek 2023-01-03 18-17

    The code that I am using the following:

    vp = Plotter(shape=[5,7], axes=0, interactive=0, sharecam=False)
    video = Video(os.path.join(dirname, box+".gif"), backend='ffmpeg')  # backend='opencv/ffmpeg'
    video.options = "-b:v 8000k -filter_complex \"[0:v] split [a][b];[a] palettegen=stats_mode=single [p];[b][p] paletteuse=new=1\""
    
    for t in np.arange(0, 1, 0.005):
        for i, mesh_model in enumerate(mesh_models):
             t1 = mesh_model.filename.split('/')[-1].split('.')[0]
             vp.show(mesh_model.lighting(style='ambient'), t1, at=i) # this line gives the first gif
             # vp.show(vd.Cone().lighting(style='ambient'), t1, at=i) # this line gives the second gif
             cam = vp.renderer.GetActiveCamera()
             cam.Azimuth(2)
         video.add_frame()
    
    video.close()
    vp.show().close()
    

    The error happens inside the vp.show() inside the for loop and if my custom meshes are more than 30.

    opened by ttsesm 0
  • Issue with return_ids when checking intersections between a mesh and line.

    Issue with return_ids when checking intersections between a mesh and line.

    Hi!

    This issue is something new, probably related to some recent update, because this exact same code worked flawlessly for me for a long time.

    I'm using the mesh.intersect_with_line() function to check the intersection between a mesh and a line. If i do it without the return_ids argument, it works, returning the intersection point:

    array([[18444.52929688, 11806.72460938, 2475. ]])

    But when i add the return_ids = True argument, i'm getting the following error:

    ValueError: setting an array element with a sequence. The requested array has an inhomogeneous shape after 2 dimensions. The detected shape was (1, 2) + inhomogeneous part.

    Any idea what could this be? As i said, this worked perfect for me, never an error, but just today this popped.

    Edit: I think it's some numpy related issue.

    opened by ManuGraiph 1
  • Can I set the rotate center to a point not the center of  render view?

    Can I set the rotate center to a point not the center of render view?

    from vedo import Plotter, Cube
    
    def callbck(evt):
        if evt.actor:
            #plt.fly_to(evt.picked3d)
            plt.camera.SetFocalPoint(evt.picked3d)
    
    plt = Plotter(axes=1)
    plt.addCallback("LeftButtonPress", callbck)
    
    c1 = Cube()
    plt.show(c1)
    

    If I changed the focal of the camera but the render would fly to the center of point.

    opened by timeanddoctor 2
  • export x3d with multiple panels

    export x3d with multiple panels

    Congrats on an awesome library. I've set up a 3-panel Plotter instance and would like to export it to x3d and html for interaction within a browser.

    plt = vedo.Plotter(N=3, bg='blackboard')
    plt.at(0).show(vol1, bg='black')
    plt.at(1).show(vol2, bg='black')
    plt.at(2).show(vol3, bg='black')
    plt.export(filename='test.x3d', binary=False)
    plt.interactive().close()
    

    The plotter appears fine in Windows, with three panels displaying the desired meshes vol1, vol2, and vol3. The exported x3d file is rendered in the browser with the appropriate dimensions for 3 panels, but only vol1 appears, in the center of the scene. I expected the entire output of the Plotter object to show up.

      <x3d width='1706px' height='568px'>
         <scene>
            <Inline url="test.x3d"> </Inline>
         </scene>
      </x3d>
    

    Any ideas? Is multiple panel x3d rendering supported by vtk?

    opened by cabaker7 0
  • AttributeError: module 'numpy' has no attribute 'warnings'

    AttributeError: module 'numpy' has no attribute 'warnings'

    I was having issues with Plotter showing anything so decided to see if there was an update for vedo. I made a fresh conda environment and installed only vedo through conda-forge. vedo=2022.4.2 numpy=1.24.0 python=3.11.0

    When simply importing vedo with from vedo import * I get AttributeError: module 'numpy' has no attribute 'warnings'.

    I don't have any files or folders named numpy in the current directory. Is there a quick fix to this? Thanks.

    opened by daniel-a-diaz 1
  • plotting from ipython

    plotting from ipython

    Hi, Thanks for the nice tool. I have tried to search the documentation for the way to plot form within ipython. Is this possible? I tried several backends but none is creating a window.

    Thanks

    opened by kakila 1
Releases(v2022.4.2)
  • v2022.4.2(Dec 15, 2022)

    Main changes


    base.py

    • added basegrid.extract_cells_on_plane()
    • added basegrid.extract_cells_on_sphere()
    • added basegrid.extract_cells_on_cylinder()
    • added count_vertices() method
    • added copy_data_from() method to transfer all cell and point data from an object to another.
    • fixed metadata association

    pointcloud.py

    • added cut_with_planes() to cut at once with multiple planes
    • added generate_random_data() for testing purposes
    • renamed vignette() to flagpole()
    • added new flagpost() similar to the above
    • added new property pointcloud.cellcolorsand pointcolors to access and modify colors by RGBA assignment.
    • added compute_camera_distance() to calculate the distance from points to the camera. A pointdata array is created with name 'DistanceToCamera'.
    • added cut_with_scalars() to cut polygonal data with some input scalar data.

    mesh.py

    • improved binarize() method thanks to @vfmatzkin
    • added collide_with() to fix crashing of intersect_with() in special cases
    • added check_validity()
    • added method=4 for subdivide()
    • added intersect_with_plane()
    • added boolean(..., method=1)
    • added intersect_with_multiplanes() to generate a set of lines from cutting a mesh in n intervals between a minimum and maximum distance from a plane of given origin and normal.

    plotter.py

    • fixed key bindings for uppercase hits.
    • added method add_hint() to generate a pop-up message on hovering an object
    • fix output of template camera when pressing "C"
    • improved move_camera()
    • added key-press R to reset camera viewup to closest orthogonal viewup added corresponding method plotter.reset_viewup()
    • added press . to fly to last clicked point and zoom in

    picture.py

    • generate false colors for an image with Picture().cmap()

    pyplot.py

    • clicking on a histogram shows the bin value
    • add as2d() method to freeze a plot in 2d canvas, without mouse interaction (experimental)

    shapes.py

    • Added support for chinese and japanese chars
    • Added font "ComicMono"
    • added possibility to create a disc sector in Disc(angle_range=...)

    tetmesh.py

    • added compute_tets_volume()
    • added check_validity()

    volume.py

    • added vtkFlyingEdges3D instead of contouring, which is faster.

    Examples

    New/Revised

    examples/basic/color_mesh_cells1.py
    examples/basic/color_mesh_cells2.py
    examples/pyplot/fit_curve.py
    examples/pyplot/histo_2d_a.py
    examples/pyplot/histo_2d_b.py
    examples/other/flag_labels2.py
    examples/volumetric/image_false_colors.py
    
    Source code(tar.gz)
    Source code(zip)
  • v2022.4.1(Oct 18, 2022)

    This version includes various fixes, but the most important thing is that it implements the snake_case naming scheme (instead of camelCase) for all class methods and functions, so e.g. code like this (in vedo==2022.3.1):

    mesh = Mesh("bunny.obj")
    mesh.cutWithPlane()
    

    now becomes (in vedo==2022.4.1):

    mesh = Mesh("bunny.obj")
    mesh.cut_with_plane()     ##### <----
    

    Check out the docs in case of doubts.

    See discussion #705 @jkissi @zhang-qiang-github @XushanLu @Gjacquenot @FedeClaudi @ManuGraiph @infinity77 @lukablagoje @LogWell @Amin-Fakia @nantille


    addons.py

    • improved slider callback interface

    mesh.py

    • fixed issue #593

    volume.py

    • can warp scalars in a volumetric dataset with warp()

    New/Revised Examples

    examples/pyplot/fill_gap.py
    examples/basic/sliders_hsv.py
    examples/volumetric/slicer2.py
    examples/volumetric/warp_scalars.py
    examples/other/qt_window3.py
    
    Source code(tar.gz)
    Source code(zip)
  • v2022.3.0(Aug 24, 2022)

    Main changes

    • pep8 parsing with pylint and general cleanup of the code.
    • Volume(np_array) does not need array to be transposed anymore. Warning: this may cause flipping of the x-z axes!

    applications.py

    • added SplinePlotter object

    pointcloud.py

    • bug fix in clone()
    • added labels2D()
    • added logscale for colormapping in method cmap(..., logscale=True)
    • added explicit label formatting for scalarbars, @XushanLu

    plotter.py

    • added breakInteraction() to break window interaction and return to the python execution flow

    picture.py

    • added class MatplotlibPicture to embed matplotlib figures as 2d objects in the scene.

    shapes.py

    • Added text() method to update 3d text on the fly, by @mkerrin
    • Added pcaEllipse() analogous to pcaEllipsoid() for 2D problems.

    utils.py

    • added getUV() method to get the texture coordinates of a 3D point

    volume.py

    • Volume(np_array) does not need array to be transposed anymore. Warning: this may cause flipping of the x-z axes!
    • added slicePlane(autocrop=False)

    Examples

    New/Revised

    examples/basic/input_box.py
    examples/basic/pca_ellipse.py
    examples/advanced/capping_mesh.py
    examples/volumetric/numpy2volume2.py
    examples/volumetric/numpy2volume1.py
    examples/pyplot/fourier_epicycles.py
    examples/pyplot/histo_pca.py
    examples/pyplot/histo_1d_b.py
    examples/other/flag_labels.py
    examples/other/remesh_tetgen.py
    examples/other/pymeshlab2.py
    
    Source code(tar.gz)
    Source code(zip)
  • v2022.2.3(May 8, 2022)

    This release includes various improvements and bug fixes


    base.py

    • alignToBoundingBox() change the default behavior to match exactly the target (affine transform) @jsaintauret
    • added getRGBA() to obtain the actual colors from an object as rendered

    pointcloud.py

    • addTrail() simplified.

    mesh.py

    • isInside(..., returnIds=True) fixed bug

    plotter.py

    • added lookAt(plane='xy') to move the camera to face one of the cartesian planes
    • removed plotter.load() as not really necessary and potentially confusing

    pyplot.py

    • add legends to Figures thanks to new method addLegend()

    shapes.py

    • moved volume.streamLines to shapes.StreamLines

    volume.py

    • added mask(vol) to mask the visualization of a volume

    Examples

    New/Revised

    examples/basic/shadow2.py
    examples/basic/deleteMeshPoints.py
    examples/basic/ssao.py
    examples/basic/align6.py
    examples/basic/pca_ellipsoid.py
    examples/advanced/gyroid.py
    examples/volumetric/volumeOperations.py
    examples/volumetric/streamlines1.py
    
    examples/simulations/orbitals.py
    examples/simulations/mag_field1.py
    examples/simulations/mag_field2.py
    examples/simulations/pendulum_3d.py
    
    examples/pyplot/histo_1d_b.py
    examples/pyplot/fitPolynomial1.py
    examples/pyplot/plot_extra_yaxis.py
    
    examples/other/pygeodesic1.py
    examples/other/qt_cutter.py
    

    Deleted

    examples/other/animation1.py
    examples/other/animation2.py
    examples/simulations/alien_life.py
    examples/simulations/cell_colony.py
    
    Source code(tar.gz)
    Source code(zip)
  • v2022.2.0(Apr 5, 2022)

    Main changes

    • New documentation pages based on pdoc3.
    • general cleanup of the examples
    • simplified licence file by splitting fonts and general MIT licence
    • all vedo/texture/* files removed
    • a new syntax is allowed for changing the current renderer: plotter.at(ren_number).show(mymesh) instead of the (still valid): plotter.show(mymesh, at=ren_number)
    • reverted settings to be a simple import instead of a dictionary (because of pdoc3).

    pointcloud.py

    • cmap(arrayName=...) -> cmap(name=...)
    • added chamferDistance() of pointclouds (needs to be double checked)
    • added cutWithMesh(self, keep=True) to return an Assembly of the cut & discarded parts.

    mesh.py

    • can now recover the edges of a mesh with mymesh.edges()
    • added tetralize() to tetralize any closed surface mesh

    plotter.py

    • keyword change show(interactorStyle=...) -> show(mode=...)
    • added function vedo.close() to close the latest Plotter

    picture.py

    • remove by default alpha channel so that images become pickable

    pyplot.py

    • Full revision of the existing code.
    • can now create an empty Figure object to be later filled.

    With it one can easily create elegant plots and histograms like:

    Screenshot from 2022-04-05 22-01-50


    shapes.py

    • added Rectangle(radius=...) to have a border radius

    tetmesh.py

    • added tetralize() to tetralize any closed surface mesh
    • added addQuality() of tets

    settings.py

    • new polygonal fonts added: 'Vogue', 'Brachium', 'Dalim', 'Miro', 'Ubuntu'

    Examples:

    New/Revised

    • examples/basic/mousehover2.py
    • examples/simulations/wave_equation2d.py
    • examples/advanced/interpolateScalar4.py
    • examples/advanced/timer_callback1.py
    • examples/basic/multirenderers.py
    • examples/advanced/spline_draw.py
    • examples/simulations/museum_problem.py
    • examples/volumetric/tet_explode.py
    • examples/volumetric/tetralize_surface.py
    • examples/other/remesh_tetgen.py
    • examples/pyplot/histo_1d_a.py
    • examples/pyplot/histo_1d_b.py
    • examples/pyplot/histo_1d_c.py
    • examples/pyplot/histo_1d_d.py
    • examples/pyplot/histo_2d.py
    • examples/pyplot/histo_pca.py
    • examples/pyplot/histo_manual.py
    • tests/common/test_pyplot.py
    • examples/pyplot/plot_empty.py
    • examples/pyplot/plot_errband.py
    • examples/pyplot/quiver.py

    Deleted

    • examples/pyplot/covid19.py
    • examples/pyplot/histo_1D.py
    • examples/pyplot/histo_2D.py
    • moving_least_squares3D.py
    • examples/other/dolfin/curl2d.py
    • examples/other/dolfin/demo_auto-adaptive-poisson.py
    • examples/other/dolfin/demo_cahn-hilliard.py
    • examples/other/dolfin/ex01_show-mesh.py
    • examples/other/dolfin/ft07_navier_stokes_channel.py
    • examples/other/dolfin/ft08_navier_stokes_cylinder.py
    • examples/other/dolfin/meshEditor.py
    • examples/other/dolfin/simple1Dplot.py
    Source code(tar.gz)
    Source code(zip)
  • v2022.1.0(Feb 23, 2022)

    Main changes

    • Quite serious bug fixed in closestPoint() method due to a problem in the upstream vtk9.0 vtkStaticCellLocator class. (https://discourse.vtk.org/t/vtkstaticcelllocator-problem-vtk9-0-3/7854/4)

    • internal global variable settings.plotter_instance must become vedo.plotter_instance.

    • vedo.settings is now a dotted dictionary

    • implemented logging module for managing errors and warnings

    • fixed bug to distanceTo() method


    applications.py

    • Brower, IsosurfaceBrowser, Slicer2DPlotter and RayCastPlotter are now Plotter derived classes (not functions)
    • improved IsosurfaceBrowser for speed

    io.py

    • improved Video.action(cameras=[...]) to interpolate cameras positions

    mesh.py

    • faces of a mesh can be reversed individually with reverse(face_list).
    • fixed bug to distanceTo() method

    plotter.py

    • fix closeWindow()
    • add show(..., zoom="tight") to automatically zoom in as close as possible when 2D.

    picture.py

    • added binarize() method.
    • added invert() method.

    pyplot.py

    • name change cornerPlot -> CornerPlot
    • name change cornerHistogram -> CornerHistogram

    shapes.py

    • Line.lineColor() overrides mesh.lineColor() to avoid ambiguities.
    • added line.curvature() method and example in docs.
    • added line.tangents() method and example in docs.

    volume.py

    • volume.mesh2Volume() function moved to vedo.mesh.binarize()
    • volume.signedDistanceFromPointCloud() function moved to Points.signedDistance
    • legosurface() changed interface

    utils.py

    • function has new keyword sortByColumn(invert=False)

    New/Revised examples:

    examples/basic/align5.py examples/basic/distance2mesh.py examples/pyplot/fourier_epicycles.py examples/other/ellipt_fourier_desc.py examples/volumetric/image_probe.py examples/volumetric/image_mask.py examples/pyplot/histo_3D.py examples/other/napari1.py examples/other/makeVideo.py examples/volumetric/volumeFromMesh.py examples/volumetric/mesh2volume.py

    Source code(tar.gz)
    Source code(zip)
  • v2022.0.1(Jan 12, 2022)

    Main changes


    colors.py

    • minor fixes

    cli.py

    New CLI mode to emulate eog for convenient visualization of common format images :

    vedo --eog https://corepetfood.com/files/2019/07/kitten-e1568311742288-1440x900.jpg

    Press:
      up/down     to modify level (or drag mouse)
      left/right  to modify window
      m           to mirror image
      t           to rotate image by 90 deg
      k           to enhance b&w image
      s           to apply gaussian smoothing
      S           to save image as png
      h           to print this help banner
    

    plotter.py

    • added enableErase() enableRenderer() useDepthPeeling(at) methods
    • added addScaleIndicator() to add to the scene an indicator of absolute size of objects (needs settings.useParallelProjection = True)

    pointcloud.py

    • added smoothLloyd2D() for smoothing pointclouds in 2D
    • vtkCellLocator seems to have a problem with single cell meshes (#558), fixed using vtkStaticCellLocator which behaves normally

    shapes.py

    • added Line().pattern() to create a dashed line with a user defined pattern.
    • fixed bug in Text2D()

    New/Revised examples:

    examples/basic/shadow2.py

    Source code(tar.gz)
    Source code(zip)
  • v2021.0.7(Nov 8, 2021)

  • v2021.0.6(Oct 5, 2021)

    Main changes

    • various fixes

    base.py

    • introduced new sintax to set/retrieve a mesh point data array: myobj.pointdata["arrayname"] same for cell/face data: myobj.celldata["arrayname"]

    addons.py

    • added kword LegendBox(markers=...)
    • added kword Slider2D(delayed=True) to act upon mouse release

    colors.py

    • fixed small bug in colorMap (only affecting systems without matplotlib)

    mesh.py

    • fixed problem in geodesic().
    • added tolerance keyword in intersectWithLine(). Also, now returnIds returns [[pt,cellid]]
    • added kword flag to function merge(..., flag=True) to optionally keep track of the original meshes ids

    picture.py

    • added .enhance() method.
    • method .tonumpy() reshape to [nx,ny,nchannels] to match matplotlib standard
    • added .append() to stitch images the current to the left or to the top.
    • added .extent() to specify physical extention of an image.

    pointcloud.py

    • cluster() renamed to pointcloud.addClustering()
    • added voronoi() function

    New/Revised examples:

    vedo -r optics_main1 vedo -r optics_main2 vedo -r optics_main3 vedo -r warp4 vedo -r voronoi vedo -r drag_chain vedo -r morphomatics_tube


    Source code(tar.gz)
    Source code(zip)
  • v2021.0.5(Aug 29, 2021)

    Main changes

    • Added support for ipygany in jupyter notebooks.
    • Command line interface vedo ... should now work on windows 10 too.
    • added skybox environment with show(..., bg="path/to/file.hdr")
    • added (kind of limited) support to wxpython embedding (analogous to Qt, but open-source)
    • updated pymeshlab examples

    base.py

    • added .lighting(metallicity=1, roughness=0.1) to include PBR (physics based rendering).
    • method .printInfo() is now simply .print()

    addons.py

    • added SplineTool.nodes() to retrieve current node positions.

    plotter.py

    • removed global functions closeWindow() ion() ioff()
    • added record() and play() to store and playback camera and all other events
    • keyword interactorStyle becomes now mode

    picture.py

    • added flip keyword to flip xy convention
    • added level() and window() methods to control brightness and contrast of a Picture.
    • added smooth() to make gaussian smoothing of a Picture object.
    • added bw() to make a picture black and white
    • added channels keyword to specify rgba channels to use (useful to remove alpha)
    • added pad() to create a padding margin to a picture
    • added median() a median filter that preserves thin lines and corners
    • added frequencyPassFilter() to filter images based on level of detail frequencies
    • added rotateAntiClockWise() to rotate an image (landscape to portrait and viceversa)
    • added tonumpy() and modified() methods.
    • added tiling() to generate tilings from a single picture
    • extract() renamed to select()

    pyplot.py

    • added plot(mode="bar")

    pointcloud.py

    • added hausdorffDistance() to compute the Hausdorff distance of two point sets or meshes

    volume.py

    • added vmin and vmax keywords to share the same mapping across different volumes
    • renamed getDataArray to tonumpy.

    cli.py

    • removed bin/vedo and created entry point from vedo/cli.py (command line interface). This works better on windows systems.
    • vedo -r now colorizes the code dump.

    New/Revised examples:

    • vedo -r plot_bars
    • vedo -r alien_life
    • vedo -r pendulum_ode
    • vedo -r earth_model
    • vedo -r qt_window2
    • vedo -r spline_tool
    • vedo -r wx_window1
    • vedo -r picture2mesh
    • vedo -r record_play
    • vedo -r pymeshlab1
    • vedo -r pymeshlab2
    • vedo -r volume_sharemap
    • vedo -r multiwindows1
    Source code(tar.gz)
    Source code(zip)
  • 2021.0.3(May 4, 2021)

    Main changes

    • General improvements to the vedo command line

    • colorcet colormaps are directly usable in vedo. Check example basic/mesh_custom.py

    • general tool for free-hand cutting a mesh can be invoked from command line: vedo --edit https://vedo.embl.es/examples/data/porsche.ply

    • added example search by command line e.g.: vedo --search triangle -i (-i to ignore capital letters)

    • added file(s) info dump by command line e.g.: vedo --info some_image.jpg https://vedo.embl.es/examples/data/porsche.ply

    • pressing shift-A toggles antialiasing for the whole rendering window

    • pressing shift-D toggles depth-peeling algorithm for the current renderer

    • antialiasing set by default on vtk9

    • balloon-style flags are disabled because of a bug in vtk9

    Consider installing VTK 8.1.2 for better visualisations when possible (unfortunately this slightly older version is no more available for python >=3.8)


    base.py

    • corrected bug on diagonalSize() returning a wrong value

    addons.py

    • added addSplineTool() to interactively spline points in space
    • added labelRotation in addScalarBar3D
    • added xShiftAlongY keywords in Axes to slide the whole axis position along another axis
    • added xAxisRotation to rotate the whole axis (ticks and labels)
    • addScalarBar3D() can now render categorical data

    colors.py

    • fixed small issue in printc to support different terminals

    mesh.py

    • computeNormals() is no more changing the nr of mesh points unless featureAngle is specified
      • added keywords: featureAngle=None, consistency=True
    • intersectWithLine() can now return cell ids, not just points

    plotter.py

    • improved automatic text management in show("some text")
    • added computeWorldPosition(point2d) to get the 3d point in the scene from a screen 2d point
    • added addSplineTool() to interactively spline points in space
    • small fix in plotter.add() for offscreen mode.
    • added topicture() to render a scene into a Picture object (to crop, mirror etc)

    picture.py

    • added FFT and RFFT, added example fft2d.py
    • can save Picture obj to file as jpg or png

    pointcloud.py

    • added cutWithBox(), cutWithLine(), cutWithSphere() and cutWithCylinder() methods

    shapes.py

    • fixed small bug in Glyph

    volume.py

    • added class VolumeSlice for volume-sliced visualization.

    utils.py

    • added roundToDigit(x,p), round number x to significant digit

    New/Revised examples:

    • vedo -r koch_fractal
    • vedo -r mesh_custom
    • vedo -r fft2d
    • vedo -r lines_intersect
    • vedo -r cutFreeHand
    • vedo -r spline_tool
    • vedo -r legendbox
    • vedo -r read_volume3
    • vedo -r multi_viewer2
    Source code(tar.gz)
    Source code(zip)
  • 2021.0.2(Mar 16, 2021)

    vedo 2021.0.2

    A new web page is avaialble! check it out at https://vedo.embl.es

    • python2 is no more supported
    • A dangerous bug in mesh.closestPoint(returnIds=True) has been fixed
    • Added interfaces and examples to libraries iminuit and pymeshlab
    • variable datadir changed to dataurl
    • added ipyvtk_simple option for notebooks rendering

    base.py

    • method addPos() (obsolete but still valid) renamed to shift()
    • added shortcut to input the opacity with syntax mesh.color("blue", 0.5)
    • arrays with name "Normals" are set as active normals automatically ( @theponpon )
    • added keyword invert in getTransform() ( @Tai-Hsien )
    • added deleteCells() method

    addons.py

    • added mesh cutter with planes and spheres in addition to boxes ( @nantille )
    • major revision of the Axes class. with new added feature like axes inversion, free rotations
    • keyword xFlipText disappeared as is now substituted by xLabelRotation
    • Added xyShift to shift the whole cartesian plane along one axis ( @JGarrett7 )
    • Axes can be flipped with their range with xInverted (caveat: this does not at all affect the world coordinate system!)
    • new class LegendBox to show a legend with icons

    colors.py

    • vedo is now independent of matplotlib for colormaps
    • added new bootstrap5 color scheme (e.g. c='red1', 'red2', ..., 'red9', or in short: c='r1', 'r2', ..., 'r9') Lower index means darker.
    • added rgb2hex() and hex2rgb() functions
    • fixed bug on printc() and added settings.enablePrintColor. #337

    mesh.py

    • fixed bug in splitByConnectivity() ( @jsanchez679 )
    • added method addConnectivity() to add a connectivity array to mesh points
    • added method isClosed() ti return if mesh is watertight (no holes)

    plotter.py

    • improved resetcam behaviour
    • passing camera no more empties the passed dictionary (thanks @icemtel )
    • verbose keyword has been removed (as hard to maintain)
    • mouse clicking can now pick Picture not only Mesh
    • revised and improved callback functionality with plotter.addCallback() (see examples mousehighlight, mousehover)
    • new way of creating a callback loop with a timer (thanks @nantille - see examples timer_callback)

    picture.py

    • attribute picture.shape holds the shape of the picture in pixels
    • added gif file reader to return a list of Picture objs.
    • added clone() method.

    pointcloud.py

    • added fitCircle() to fit a circle to a line in 3D.
    • added a revision of self.densify(). Removed densifyCloud(). #338

    pyplot.py

    • a brand new function fit() to perform polynomial fitting to data with error bars in both x and y with correct estimation of error bands via bootstrap method (there are out there soo many wrong scripts in matplotlib!)
    • added pyplot.matrix() to plot numpy matrices (eg. correlation/covariance matrix)
    • various minor fixes

    shapes.py

    • Spline can control the easing, the density of points along the line.
    • support for closed splines.
    • Text2D completely rewritten. Can now update it after creation (e.g. mytxt.text("test").color("g"))

    volume.py

    • added volume.shade() which can be True or False. Disable by default (was previously enabled) to be used in conjunction with volume.lighting() to create a mesh-like rendering of the volume. (thanks to @nantille for debugging)
    • fixed example interpolateVolume (thanks @rafaelmarch3 )

    New/Revised examples:

    • vedo -r colorcubes

    • vedo -r cutter

    • vedo -r spline_ease

    • vedo -r gyroid

    • vedo -r align6

    • vedo -r colormap_list

    • vedo -r bloch

    • vedo -r slicePlane1

    • vedo -r slicePlane2

    • vedo -r pygmsh_cut

    • vedo -r mousehighlight

    • vedo -r mousehover

    • vedo -r line2mesh_quads

    • vedo -r line2mesh_tri

    • vedo -r pointsCutMesh2

    • vedo -r hoverLegend

    • vedo -r iminuit

    • vedo -r pymeshlab1

    • vedo -r timer_callback1

    • vedo -r timer_callback2

    • vedo -r fitCircle

    • vedo -r anim_lines

    • vedo -r earthquake_browser

    • vedo -r np_matrix

    • vedo -r customAxes2

    • vedo -r customAxes3

    • vedo -r glyphs3

    • vedo -r fitPolynomial1

    • vedo -r fitPolynomial2

    • vedo -r histo_gauss

    • vedo -r plot_polar

    • vedo -r densifycloud

    • vedo -r interpolateVolume

    Source code(tar.gz)
    Source code(zip)
  • 2020.4.2(Nov 23, 2020)

    Main changes

    • Removed restriction VTK<9. Even so, VTK9 seems significantly slower and unexpected behaviors are still possible.

    • Various minor issues have been fixed.


    addons.py:

    • name change addLight() -> Light(). Improved API. Revised example basic/lights.py (thanks to @mit10000 and @theponpon input #249)
    • added size keyword for addScalarBar() to control size in pixels (@RubendeBruin #237)

    io.py:

    • added default bitrate specification Video.options="-b:v 8000k" (for ffmpeg) seems to produce much better quality results - tested on linux system only.

    plotter.py:

    • modified plotter.addLight()
    • added warning to non-existing camera keywords (@FedeClaudi #244)
    • In rendering window:
      • pressing 3 cycles over predefined set of textures for clicked Mesh objects
      • pressing I picks the color under the mouse (uses colors.pickColor())

    shapes.py:

    • added class Brace (see example scatter3.py)
    • can sweep() a Line object to create a surface

    New/Revised examples:

    vedo -r rgbaImage vedo -r cutWithMesh2 vedo -r scatter3 vedo -r lights vedo -r plot_density4d (thanks to @edmontz) vedo -r app_raycaster vedo -r app_isobrowser

    Source code(tar.gz)
    Source code(zip)
  • 2020.4.1(Oct 13, 2020)

    New in vedo 2020.4.1

    • Fixed pip problem (hopefully solving issue #185 raised by @RizzerOnGitHub)
    • Typo in readme fixed (thanks to @danielhrisca)
    • Global variable settings.collectable_actors is now obsolete and void.
    • Various minor issues have been fixed too.

    addons.py:

    • buildAxes() now admits a header title

    • addScalarBar3D() returns self, use self.scalarbar to access the scalarbar object (e.g for scaling, rotating and repositioning it)

    • makeLUT() renamed to buildLUT() with new examples, which includes indicators for NaN's and out of scale values:


    base.py:

    • setTransform() -> applyTransform() accepts now a python or numpy matrix (thanks to @FedeClaudi input)
    • added removePointArray() and removeCellArray() methods
    • added divergence(), vorticity() methods
    • added removePointArray() and removeCellArray() methods (thanks to @Tai-Hsien input)

    colors.py:

    • added ask() method to prompt user input from command line
    • added printc(dbg=1) mode to help debugging

    io.py:

    • load() method can load and return normal npy or npz numpy data files

    mesh.py:

    • clone(deep=True), deep can be False to generate a shallow copy of the obj.

    picture.py:

    • polygonize(), create a polygonal Mesh from a Picture by filling regions above a specified threshold

    plotter.py:

    • flyTo(), fly camera to the specified point.
    • export(), to export scene.npz

    pointscloud.py

    • interpolateDataFrom(), Interpolate over source to port its data onto the current object using various kernels.

    pyplot.py:

    • removed directedgraph.clean() because it's just wrong (might marginally affect @DeepaMahm)
    • added whisker() function to generate whisker-style plots


    shapes.py:

    • added CSpline class, to generate a Cardinal Spline object.

    New examples:

    vedo -r interpolateMeshArray vedo -r interpolateScalar1 vedo -r spline_draw vedo -r mesh_lut vedo -r whiskers

    Source code(tar.gz)
    Source code(zip)
  • 2020.4.0(Aug 26, 2020)

    vedo 2020.4.0

    Main changes

    • mesh and volume data is moved from the package to vedo.embl.es/examples/data https://vedo.embl.es/examples/data/ they are downloaded on the fly and cached

    • 14 new polygonized 3D fonts are available, making the old vtk default obsolete Font: Bongas Font: Calco Font: Comae Font: Glasgo Font: Inversionz Font: Kanopus Font: LionelOfParis Font: LogoType (supports Russian, Japanese and Chinese chars) Font: Normografo Font: Quikhand Font: SmartCouric Font: Theemim Font: VictorMono

      Default font is Normografo, can be changed with e.g. settings.useDefaultFont = "Theemim"

      Latex-like syntax is supported in Text() allowing to use Greek and math symbols in axes and plot titles: Type vedo -r fonts to generate the above tables.

    addons:

    • Ruler(): create a 3D ruler to indicate the distance of two points
    • buildRulerAxes(): a new axis style (7) formed by 3 rulers
    • many improvements to default axis style 1
    • New axis style 11: generates a thin lined square floor

    Plotter:

    • show(..., newplotter=True) -> show(..., new=True)
    • added methods: render(), resetCamera() and backgroundColor(c1, c2, at)
    • can now change transparency using arrow keys instead of "m,./" Pressing -+ cycles through available axes styles.

    utils:

    • added resampleArrays()
    • systemReport()
    • class dotdict: A dictionary supporting dot notation.
    • trimesh2vtk() -> trimesh2vedo() (check @YimingXu1213)
    • vtk2trimesh() -> vedo2trimesh()

    io:

    • can now save and load object transformation to .mat file

    mesh and pointclouds:

    • coloring with pointColors() and cellColors() is merged into method cmap()
    • meshes can be described by new vignette() and caption()
    • useBounds() tells the camera to keep inot account mesh when resetting
    • added gradient() to return the gradient of the input scalar as numpy array

    shapes:

    • convexHull() -> ConvexHull()
    • added VedoLogo() to generate the 3D logo of the package
    • major improvements to Text()

    examples:

    • new or updated examples are: vedo -r isolines vedo -r silhouette2 (thanks to @zhouzq-thu ) vedo -r meshquality vedo -r mesh_smoother2 vedo -r vpolyscope (needs pip install polyscope) vedo -r flag_labels vedo -r customAxes vedo -r fonts3d vedo -r scatter2 vedo -r scatter3 vedo -r covid19 vedo -r caption
    Source code(tar.gz)
    Source code(zip)
  • 2020.3.4(Jun 30, 2020)

    Various improvements

    • new examples: vedo -r multi_viewer vedo -r clone2d vedo -r plot_density
    • read files and scenes from dropbox and/or web links
    • vtkio.py moved to io.py
    • fixed bug @jsanchez679 in cutWithMesh()
    • mesh.normalize() does not shift to origin the mesh anymore
    • improved axes=10 and axes=5 customization
    • requires vtk<=8.1.2 as vtk-9 seems to have a lot of issues
    Source code(tar.gz)
    Source code(zip)
  • 2020.3.3(Jun 17, 2020)

  • 2020.3.1(Jun 13, 2020)

    • Various improvements and fixes
    • better support for tetrahedral meshes
    • non-blocking example added
    • 3d text supports super/subscripts
    • automatically detect spyder environment
    Source code(tar.gz)
    Source code(zip)
  • 2020.3.0(May 4, 2020)

    General changes:

    • addPointScalars and addPointVectors now are merged into new addPointArray() method.
    • addCellScalars and addCellVectors now are merged into new addCellArray() method.
    • added mesh.isobands() to produce color bands for scalars in a mesh, analogous to isolines()
    • completely revised addScalarbar and addScalarBar3D which now works also for volumes.
    • can export a full html page with k3d with exportWindow("page.html")

    New application module contains more elaborated and high level functionalities:

    • Slicer() to generate a Plotter window with slicing planes for the input Volume.
    • Slicer2d() creates a 2D window with a single balck and white slice of a Volume, which can be oriented arbitrarily in space.
    • RayCaster() generates a Plotter window for volume rendering using ray casting.
    • IsosurfaceBrowser() generates a Plotter window for Volume isosurfacing using a slider.
    • Browser() generates a Plotter window to browse a list of objects using a slider.

    In backends module for jupyter notebooks:

    • Updated k3d interface to add mesh and volumes names in the rendering menu
    • Improved rendering for lines.

    In volume module:

    • added slicePlane() to slice a volume in arbitrary orientation
    Source code(tar.gz)
    Source code(zip)
  • 2020.2.4(Apr 15, 2020)

    • Minor improvements.
    • API change in smoothMLS2D() and smoothMLS1D()
    • all examples can be run from command line e.g. vtkplotter -ir covid19 or listed with vtkplotter --list
    Source code(tar.gz)
    Source code(zip)
  • 2020.2.3(Apr 1, 2020)

  • 2020.2.1(Mar 4, 2020)

  • 2020.2.0(Feb 12, 2020)

    • improved vtkplotter.pyplot submodule
    • background color now defaults to white
    • added Mesh.idLabels() to generate cells and point ID labels
    • methods like rotateX().pos() now operate in left-to-right order (as it should be)
    • Text is split into Text2D and Text (for 3D)
    Source code(tar.gz)
    Source code(zip)
  • 2020.1.0(Feb 3, 2020)

    • revised plotting
    • added matplotlib-like syntax as in plot()
    • spherical histograms
    • background color now defaults to white
    • added Mesh.idLabels() to generate cells and point ID labels
    • added new examples and general cleanup
    • circleCI now works for the stable fenics release
    Source code(tar.gz)
    Source code(zip)
  • 2020.0.2(Jan 20, 2020)

    • Added shapes Arrow2D and Arrows2D, SphericGrid, CubicGrid
    • completely revised customizable axes=1 type
      • axes can be created for each object independently
    • quiver plots, scatter plots, error bands plots
    • plotting in spherical coordinates
    • Added type '2d' backend to plot static images in notebooks. Available backends:
    from vtkplotter import *
    # embedWindow('2d')
    # embedWindow('k3d')
    # embedWindow('itk')
    # embedWindow('panel')
    # embedWindow(False)
    
    • Added wavefront format .OBJ writer
    Source code(tar.gz)
    Source code(zip)
  • 2020.0.1(Jan 8, 2020)

    • added type axes=11 (horizontal grid)
    • fix bug by @m-albert on Volume from numpy object
    • fix typos in docs
    • change old fashioned list(zip()) to np.stack()
    • change [0]*len(z) to np.zeros_like(z)
    • add testing directory with circleCI
    • examples and package are now split into two separate repos
    • added possibility to run any example from CLI vtkplotter --run shrink.py or list them all with vtkplotter --list
    • reshuffled methods by splitting actors.py module
    • general improvements and stability
    • some methods are now deprecated: getPoints becomes points() etc.
    • Actor() becomes Mesh()
    • added advanced/centerline.py examples
    Source code(tar.gz)
    Source code(zip)
  • 2019.4.10(Nov 21, 2019)

    • added PDV paraview file reading.
    • PDB protein data bank file reader
    • added error bars in plotxy()
    • fast fitting of 2d circles with utils.fitCircle2D()
    • added flag-style pop-up labels for meshes and volumes
    • added settings for resolving polygonal clashes with mesh edges
    • built in set of parametric surfaces in shapes.py module
    • improved plotting2d with error bars
    • added warpMeshToPoint() method
    • improved texture control, can pass texture coords explicitly
    • fix trimesh problem with coloring vertices
    • can use "panel" backend in notebooks
    Source code(tar.gz)
    Source code(zip)
  • 2019.4.9(Nov 13, 2019)

  • 2019.4.6(Oct 1, 2019)

    • added new window shape descriptor (in examples/basic/multiwindows.py)
    • Kochanek-Bartel splining
    • polygon extrusion
    • select cells within input bounds
    Source code(tar.gz)
    Source code(zip)
  • 2019.4.5(Sep 17, 2019)

Owner
Marco Musy
EMBL
Marco Musy
MLP-Numpy - A simple modular implementation of Multi Layer Perceptron in pure Numpy.

MLP-Numpy A simple modular implementation of Multi Layer Perceptron in pure Numpy. I used the Iris dataset from scikit-learn library for the experimen

Soroush Omranpour 1 Jan 1, 2022
performing moving objects segmentation using image processing techniques with opencv and numpy

Moving Objects Segmentation On this project I tried to perform moving objects segmentation using background subtraction technique. the introduced meth

Mohamed Magdy 15 Dec 12, 2022
DRIFT is a tool for Diachronic Analysis of Scientific Literature.

About DRIFT is a tool for Diachronic Analysis of Scientific Literature. The application offers user-friendly and customizable utilities for two modes:

Rajaswa Patil 108 Dec 12, 2022
Technical Indicators implemented in Python only using Numpy-Pandas as Magic - Very Very Fast! Very tiny! Stock Market Financial Technical Analysis Python library . Quant Trading automation or cryptocoin exchange

MyTT Technical Indicators implemented in Python only using Numpy-Pandas as Magic - Very Very Fast! to Stock Market Financial Technical Analysis Python

dev 34 Dec 27, 2022
A numpy-based implementation of RANSAC for fundamental matrix and homography estimation. The degeneracy updating and local optimization components are included and optional.

Description A numpy-based implementation of RANSAC for fundamental matrix and homography estimation. The degeneracy updating and local optimization co

AoxiangFan 9 Nov 10, 2022
Scientific Computation Methods in C and Python (Open for Hacktoberfest 2021)

Sci - cpy README is a stub. Do expand it. Objective This repository is meant to be a ready reference for scientific computation methods. Do ⭐ it if yo

Sandip Dutta 7 Oct 12, 2022
A scientific and useful toolbox, which contains practical and effective long-tail related tricks with extensive experimental results

Bag of tricks for long-tailed visual recognition with deep convolutional neural networks This repository is the official PyTorch implementation of AAA

Yong-Shun Zhang 181 Dec 28, 2022
Freecodecamp Scientific Computing with Python Certification; Solution for Challenge 2: Time Calculator

Assignment Write a function named add_time that takes in two required parameters and one optional parameter: a start time in the 12-hour clock format

Hellen Namulinda 0 Feb 26, 2022
The fundamental package for scientific computing with Python.

NumPy is the fundamental package needed for scientific computing with Python. Website: https://www.numpy.org Documentation: https://numpy.org/doc Mail

NumPy 22.4k Jan 9, 2023
Devkit for 3D -- Some utils for 3D object detection based on Numpy and Pytorch

D3D Devkit for 3D: Some utils for 3D object detection and tracking based on Numpy and Pytorch Please consider siting my work if you find this library

Jacob Zhong 27 Jul 7, 2022
Rewrite ultralytics/yolov5 v6.0 opencv inference code based on numpy, no need to rely on pytorch

Rewrite ultralytics/yolov5 v6.0 opencv inference code based on numpy, no need to rely on pytorch; pre-processing and post-processing using numpy instead of pytroch.

η‚ΌδΈΉεŽ»δΊ† 21 Dec 12, 2022
xitorch: differentiable scientific computing library

xitorch is a PyTorch-based library of differentiable functions and functionals that can be widely used in scientific computing applications as well as deep learning.

null 24 Apr 15, 2021
SkipGNN: Predicting Molecular Interactions with Skip-Graph Networks (Scientific Reports)

SkipGNN: Predicting Molecular Interactions with Skip-Graph Networks Molecular interaction networks are powerful resources for the discovery. While dee

Kexin Huang 49 Oct 15, 2022
2nd solution of ICDAR 2021 Competition on Scientific Literature Parsing, Task B.

TableMASTER-mmocr Contents About The Project Method Description Dependency Getting Started Prerequisites Installation Usage Data preprocess Train Infe

Jianquan Ye 298 Dec 21, 2022
Official Pytorch implementation of ICLR 2018 paper Deep Learning for Physical Processes: Integrating Prior Scientific Knowledge.

Deep Learning for Physical Processes: Integrating Prior Scientific Knowledge: Official Pytorch implementation of ICLR 2018 paper Deep Learning for Phy

emmanuel 47 Nov 6, 2022
Differentiable scientific computing library

xitorch: differentiable scientific computing library xitorch is a PyTorch-based library of differentiable functions and functionals that can be widely

null 98 Dec 26, 2022
GT4SD, an open-source library to accelerate hypothesis generation in the scientific discovery process.

The GT4SD (Generative Toolkit for Scientific Discovery) is an open-source platform to accelerate hypothesis generation in the scientific discovery process. It provides a library for making state-of-the-art generative AI models easier to use.

Generative Toolkit 4 Scientific Discovery 142 Dec 24, 2022
Citation Intent Classification in scientific papers using the Scicite dataset an Pytorch

Citation Intent Classification Table of Contents About the Project Built With Installation Usage Acknowledgments About The Project Citation Intent Cla

Federico Nocentini 4 Mar 4, 2022