Data-sets from the survey and analysis

Overview

bachelor-thesis

"Umfragewerte.xlsx" contains the orginal survey results. "umfrage_alle.csv" contains the survey results but one participant is canceled due to response to the survey before publication time (trial run). Additionally the coloumn names have been changed to a nomenclatur-scheme which is used in the analysis part of the bachelor-thesis, describing the compared maps.

bar_all.py includes var_all.png

bar_laien_vs_erf_vs_exp.py includes bar_mittlere_std

For some plots the installation of "altair" is necessary. Using Sypder (Python 3.9) its necessary to enable the "altair_viewer" (delete the # in line 4) in all_vs_all.py using:

alt.renderers.enable('altair_viewer')

Altair can be installed, along with the example datasets in vega_datasets, using:

$ pip install altair vega_datasets $ pip install altair_viewer

If you are using the conda package manager, the equivalent is:

$ conda install -c conda-forge altair vega_datasets

You might also like...
A collection of learning outcomes data analysis using Python and SQL, from DQLab.

Data Analyst with PYTHON Data Analyst berperan dalam menghasilkan analisa data serta mempresentasikan insight untuk membantu proses pengambilan keputu

This tool parses log data and allows to define analysis pipelines for anomaly detection.

logdata-anomaly-miner This tool parses log data and allows to define analysis pipelines for anomaly detection. It was designed to run the analysis wit

 A real data analysis and modeling project - restaurant inspections
A real data analysis and modeling project - restaurant inspections

A real data analysis and modeling project - restaurant inspections Jafar Pourbemany 9/27/2021 This project represents data analysis and modeling of re

Tools for the analysis, simulation, and presentation of Lorentz TEM data.

ltempy ltempy is a set of tools for Lorentz TEM data analysis, simulation, and presentation. Features Single Image Transport of Intensity Equation (SI

Driver Analysis with Factors and Forests: An Automated Data Science Tool using Python

Driver Analysis with Factors and Forests: An Automated Data Science Tool using Python 📊

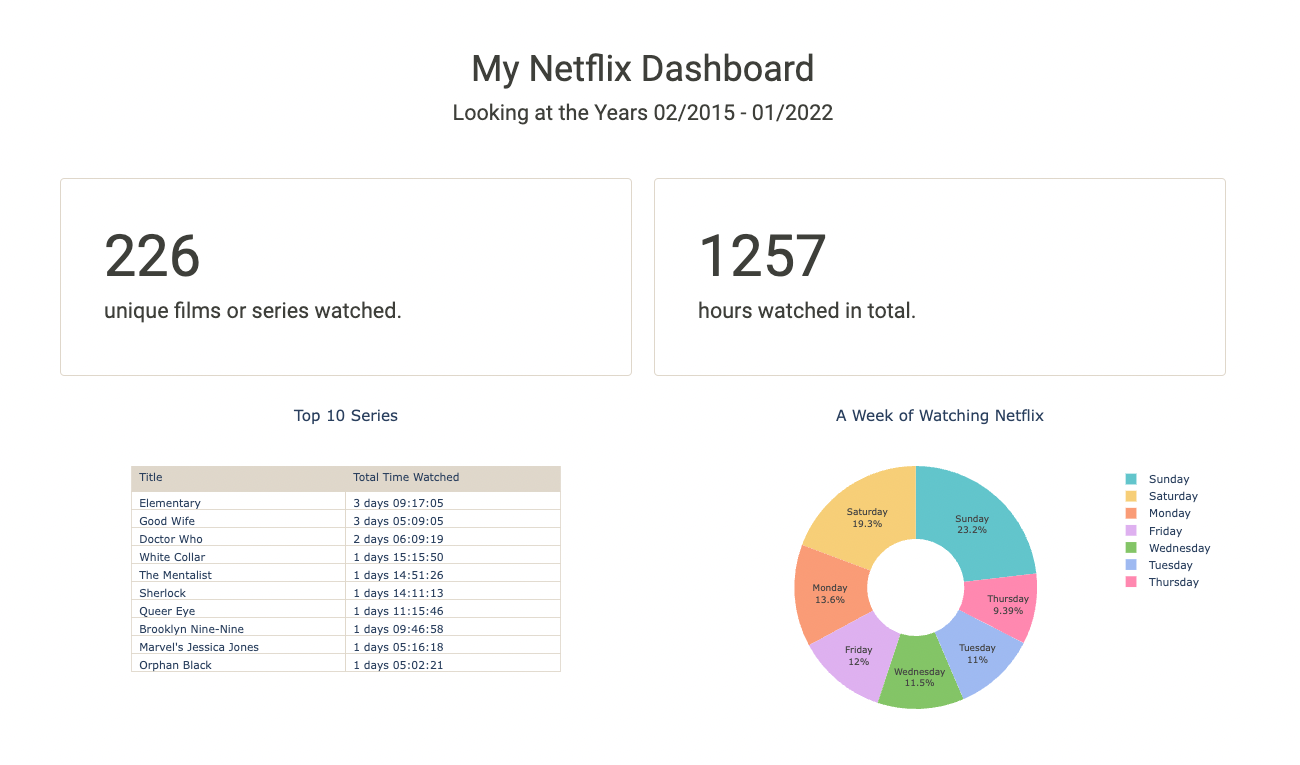
Project: Netflix Data Analysis and Visualization with Python

Project: Netflix Data Analysis and Visualization with Python Table of Contents General Info Installation Demo Usage and Main Functionalities Contribut

Amundsen is a metadata driven application for improving the productivity of data analysts, data scientists and engineers when interacting with data.

Amundsen is a metadata driven application for improving the productivity of data analysts, data scientists and engineers when interacting with data.

Flenser is a simple, minimal, automated exploratory data analysis tool.

Flenser Have you ever been handed a dataset you've never seen before? Flenser is a simple, minimal, automated exploratory data analysis tool. It runs

Visions provides an extensible suite of tools to support common data analysis operations

Visions And these visions of data types, they kept us up past the dawn. Visions provides an extensible suite of tools to support common data analysis

Owner
null
Mining the Stack Overflow Developer Survey

Mining the Stack Overflow Developer Survey A prototype data mining application to compare the accuracy of decision tree and random forest regression m

null 1 Nov 16, 2021
🧪 Panel-Chemistry - exploratory data analysis and build powerful data and viz tools within the domain of Chemistry using Python and HoloViz Panel.

???? ??. The purpose of the panel-chemistry project is to make it really easy for you to do DATA ANALYSIS and build powerful DATA AND VIZ APPLICATIONS within the domain of Chemistry using using Python and HoloViz Panel.

Marc Skov Madsen 97 Dec 8, 2022
A set of functions and analysis classes for solvation structure analysis

SolvationAnalysis The macroscopic behavior of a liquid is determined by its microscopic structure. For ionic systems, like batteries and many enzymes,

MDAnalysis 19 Nov 24, 2022
Python data processing, analysis, visualization, and data operations

Python This is a Python data processing, analysis, visualization and data operations of the source code warehouse, book ISBN: 9787115527592 Descriptio

FangWei 1 Jan 16, 2022
Larch: Applications and Python Library for Data Analysis of X-ray Absorption Spectroscopy (XAS, XANES, XAFS, EXAFS), X-ray Fluorescence (XRF) Spectroscopy and Imaging

Larch: Data Analysis Tools for X-ray Spectroscopy and More Documentation: http://xraypy.github.io/xraylarch Code: http://github.com/xraypy/xraylarch L

xraypy 95 Dec 13, 2022
Tablexplore is an application for data analysis and plotting built in Python using the PySide2/Qt toolkit.

Tablexplore is an application for data analysis and plotting built in Python using the PySide2/Qt toolkit.

Damien Farrell 81 Dec 26, 2022
A data analysis using python and pandas to showcase trends in school performance.

A data analysis using python and pandas to showcase trends in school performance. A data analysis to showcase trends in school performance using Panda

Jimmy Faccioli 0 Sep 7, 2021
Toolchest provides APIs for scientific and bioinformatic data analysis.

Toolchest Python Client Toolchest provides APIs for scientific and bioinformatic data analysis. It allows you to abstract away the costliness of runni

Toolchest 11 Jun 30, 2022
Additional tools for particle accelerator data analysis and machine information

PyLHC Tools This package is a collection of useful scripts and tools for the Optics Measurements and Corrections group (OMC) at CERN. Documentation Au

PyLHC 3 Apr 13, 2022