Python beta calculator that retrieves stock and market data and provides linear regressions.

Overview

Stock and Index Beta Calculator

Python script that calculates the beta (β) of a stock against the chosen index. The script retrieves the data and resamples it to provide the beta for 6 different timeframes and frequencies. The beta is calculated boy using both a formula and linear regression. The betas calculated are:

  • Monthly 5 Years
  • Weekly 5 Years
  • Monthly 3 Years
  • Weekly 3 Years
  • Weekly 1 Year
  • Daily 1 Year

Background

The beta of a stock measures the volatility of its price in relation to the market or index. The return on a stock with a beta of 2.0 would generate a return twice that of the market - if the market goes up 2%, the stock price would be expected to increase by 4%. This measure of volatiltiy is also called systematic risk, undiversifiable risk or market risk. Some major uses of beta are:

  • Measuring the risk of a portfolio to the market
  • Measuring the volatiltiy of an industry compared to the market
  • Estimating the required return on equity of stock in the Capital Asset Pricing Model (CAPM) or Weighted-Average Cost of Captial (WACC)
  • Estimating the effects of debt on a company's volatility (beta re-levering)

Process

There are two methods used to calculated beta.

  1. Using the formala, β = Cov(ri, rm)/σ^2m i.e. the covariance between the returns of the stock and the market divided by the volatility of the market.
  2. Running a linear regression of the returns of the market against the returns of the stock, the slope of the regression line is the calculated beta.

The script displays the results from the first method in the console and used the second model to generate graphs.

Usage

The function beta() uses the following paramaters:

Name Symbol Description
Stock Ticker ['ticker1', 'ticker2', ... 'tickern'] The tickers of the stocks beta is to be calculated for
Index/Market Symbol market The symbol of the index beta is to be measured against, S&P500 (^GSPC) by default
Adjustment adjusted The number of times beta will be adjusted (0 by default)

The function retrieves data from yahoo finance using Pandas DataReader, index codes must match the codes on their website (linked below), major codes are listed below.

Country Major Index Ticker Suffix
Australia ^AXJO for ASX200 .AX, 'CBA.AX'
Canada ^GSPTSE for S&P/TSX .TO, 'RY.TO'
Hong Kong ^HSI for Hang Sang Index .HK, '1299.HK'
Japan ^N225 for Nikkei 225 .T, '7203.T'
United Kingdom ^FTSE for FTSE100 .L, 'ULVR.L'
United States ^GSPC for S&P500 N/A, 'AAPL'

List of all indexes: https://finance.yahoo.com/world-indices

Typically beta is adjusted to better estimate the security's future beta. Typically, betas are mean-reverting and will approach to the market value of 1.0 overtime. Typically beta will be adjusted once in practice.

Required Libraries

  • datetime
  • dateutil
  • itertools
  • matplotlib
  • numpy
  • pandas_datareader
  • scipy

Related Projects

Binomial Option Pricing Calculator: https://github.com/sammuhrai/binomial_option_pricing_calculator

Disclaimer

Script is for educational purposes and is not to be taken as financial advice.

You might also like...
wikirepo is a Python package that provides a framework to easily source and leverage standardized Wikidata information

Python based Wikidata framework for easy dataframe extraction wikirepo is a Python package that provides a framework to easily source and leverage sta

Amundsen is a metadata driven application for improving the productivity of data analysts, data scientists and engineers when interacting with data.

Amundsen is a metadata driven application for improving the productivity of data analysts, data scientists and engineers when interacting with data.

Elementary is an open-source data reliability framework for modern data teams. The first module of the framework is data lineage.

Data lineage made simple, reliable, and automated. Effortlessly track the flow of data, understand dependencies and analyze impact. Features Visualiza

 🧪 Panel-Chemistry - exploratory data analysis and build powerful data and viz tools within the domain of Chemistry using Python and HoloViz Panel.
🧪 Panel-Chemistry - exploratory data analysis and build powerful data and viz tools within the domain of Chemistry using Python and HoloViz Panel.

🧪📈 🐍. The purpose of the panel-chemistry project is to make it really easy for you to do DATA ANALYSIS and build powerful DATA AND VIZ APPLICATIONS within the domain of Chemistry using using Python and HoloViz Panel.

Python data processing, analysis, visualization, and data operations

Python This is a Python data processing, analysis, visualization and data operations of the source code warehouse, book ISBN: 9787115527592 Descriptio

Tuplex is a parallel big data processing framework that runs data science pipelines written in Python at the speed of compiled code

Tuplex is a parallel big data processing framework that runs data science pipelines written in Python at the speed of compiled code. Tuplex has similar Python APIs to Apache Spark or Dask, but rather than invoking the Python interpreter, Tuplex generates optimized LLVM bytecode for the given pipeline and input data set.

Catalogue data - A Python Scripts to prepare catalogue data

catalogue_data Scripts to prepare catalogue data. Setup Clone this repo. Install

Created covid data pipeline using PySpark and MySQL that collected data stream from API and do some processing and store it into MYSQL database.

Created covid data pipeline using PySpark and MySQL that collected data stream from API and do some processing and store it into MYSQL database.

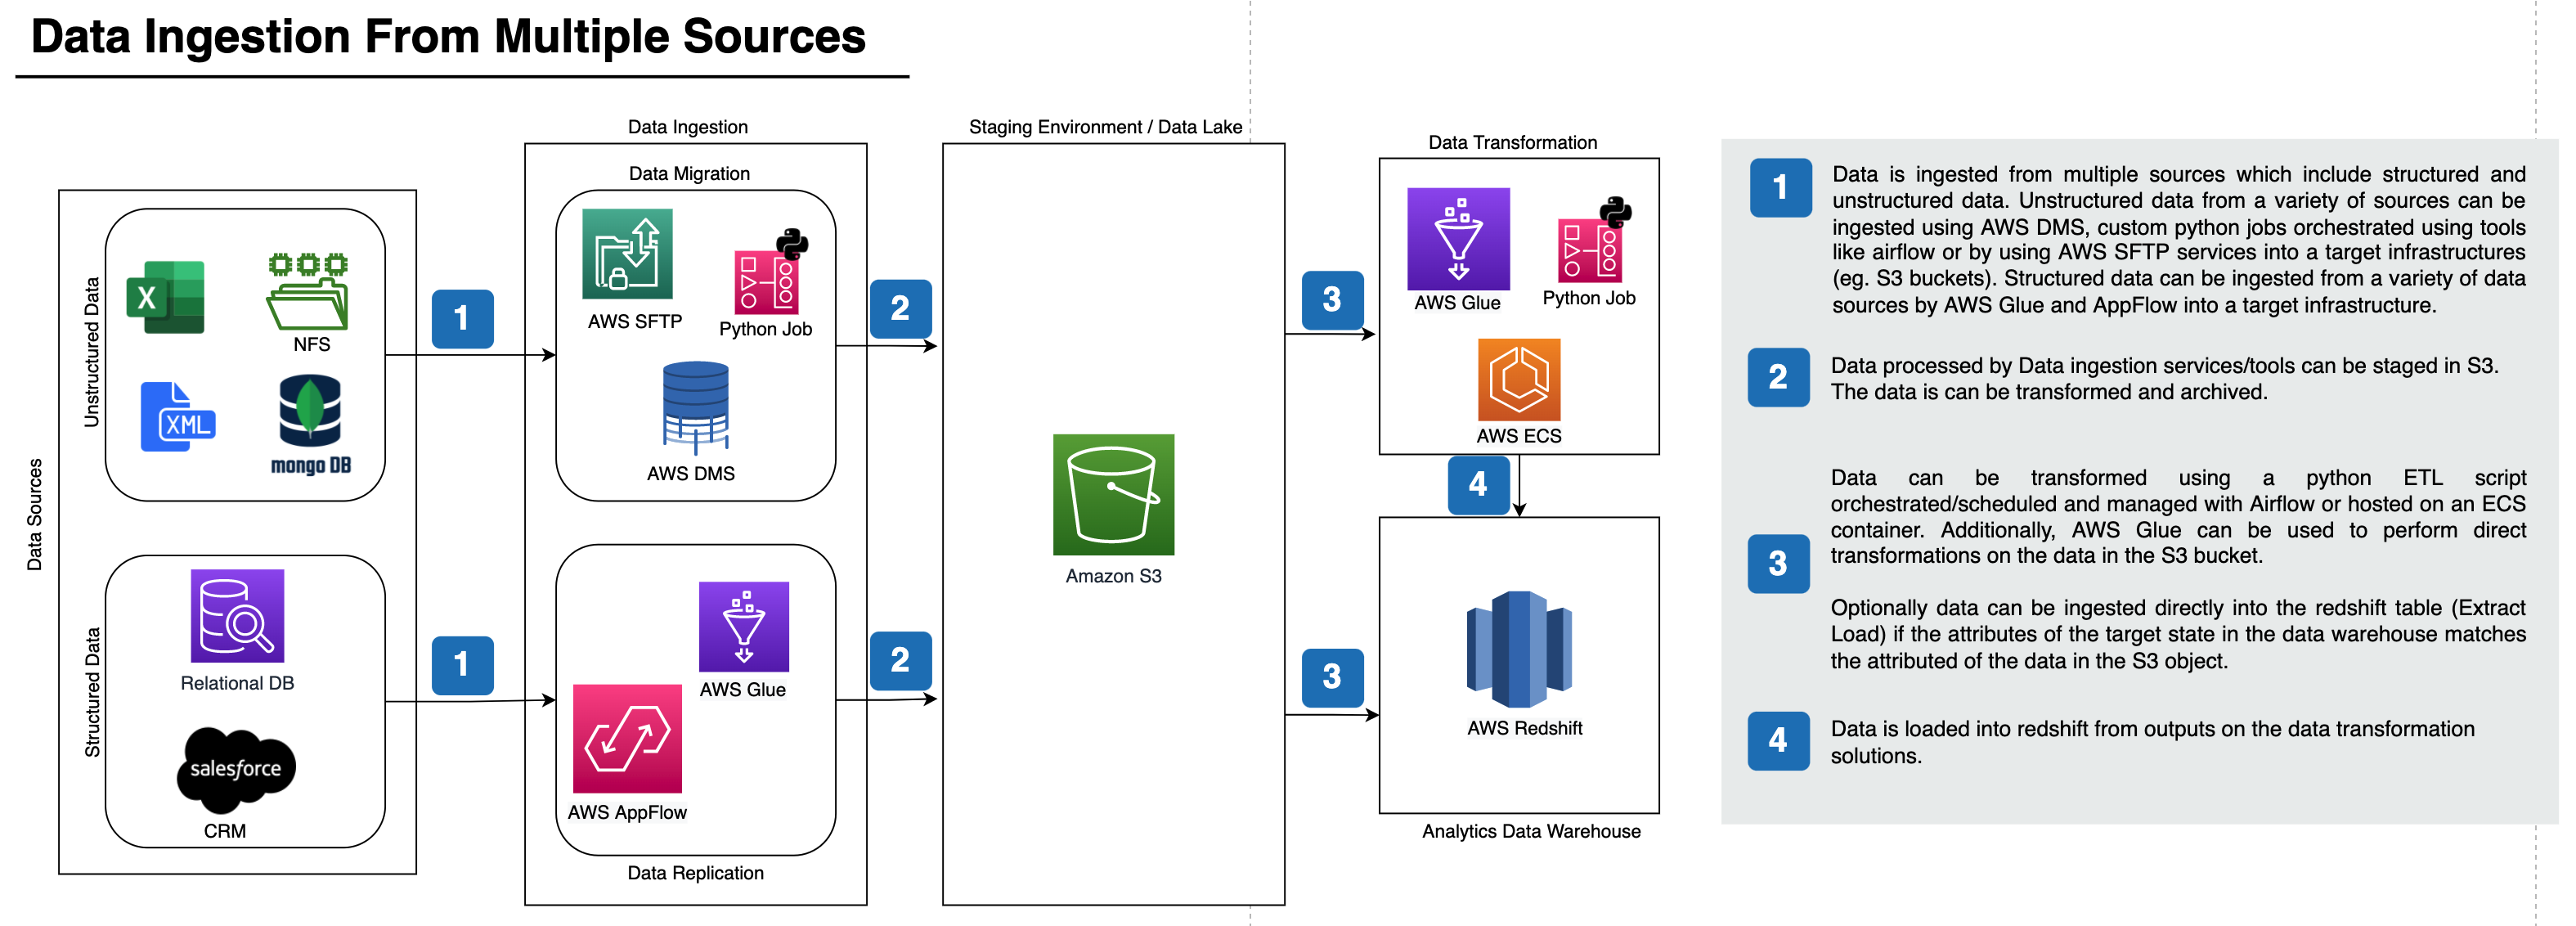
PrimaryBid - Transform application Lifecycle Data and Design and ETL pipeline architecture for ingesting data from multiple sources to redshift

Transform application Lifecycle Data and Design and ETL pipeline architecture for ingesting data from multiple sources to redshift This project is composed of two parts: Part1 and Part2

Owner
sammuhrai
sammuhrai
Data Scientist in Simple Stock Analysis of PT Bukalapak.com Tbk for Long Term Investment

Data Scientist in Simple Stock Analysis of PT Bukalapak.com Tbk for Long Term Investment Brief explanation of PT Bukalapak.com Tbk Bukalapak was found

Najibulloh Asror 2 Feb 10, 2022
OpenARB is an open source program aiming to emulate a free market while encouraging players to participate in arbitrage in order to increase working capital.

Overview OpenARB is an open source program aiming to emulate a free market while encouraging players to participate in arbitrage in order to increase

Tom 3 Feb 12, 2022
Stock Analysis dashboard Using Streamlit and Python

StDashApp Stock Analysis Dashboard Using Streamlit and Python If you found the content useful and want to support my work, you can buy me a coffee! Th

StreamAlpha 27 Dec 9, 2022
Supply a wrapper ``StockDataFrame`` based on the ``pandas.DataFrame`` with inline stock statistics/indicators support.

Stock Statistics/Indicators Calculation Helper VERSION: 0.3.2 Introduction Supply a wrapper StockDataFrame based on the pandas.DataFrame with inline s

Cedric Zhuang 1.1k Dec 28, 2022
Performance analysis of predictive (alpha) stock factors

Alphalens Alphalens is a Python Library for performance analysis of predictive (alpha) stock factors. Alphalens works great with the Zipline open sour

Quantopian, Inc. 2.5k Jan 9, 2023
A tax calculator for stocks and dividends activities.

Revolut Stocks calculator for Bulgarian National Revenue Agency Information Processing and calculating the required information about stock possession

Doino Gretchenliev 200 Oct 25, 2022
Option Pricing Calculator using the Binomial Pricing Method (No Libraries Required)

Binomial Option Pricing Calculator Option Pricing Calculator using the Binomial Pricing Method (No Libraries Required) Background A derivative is a fi

sammuhrai 1 Nov 29, 2021
A Numba-based two-point correlation function calculator using a grid decomposition

A Numba-based two-point correlation function (2PCF) calculator using a grid decomposition. Like Corrfunc, but written in Numba, with simplicity and hackability in mind.

Lehman Garrison 3 Aug 24, 2022
Toolchest provides APIs for scientific and bioinformatic data analysis.

Toolchest Python Client Toolchest provides APIs for scientific and bioinformatic data analysis. It allows you to abstract away the costliness of runni

Toolchest 11 Jun 30, 2022
Visions provides an extensible suite of tools to support common data analysis operations

Visions And these visions of data types, they kept us up past the dawn. Visions provides an extensible suite of tools to support common data analysis

null 168 Dec 28, 2022