Sci palettes for matplotlib/seaborn

Overview

sci palettes for matplotlib/seaborn

Installation

python3 -m pip install sci-palettes

Usage

import seaborn as sns
import matplotlib.pyplot as plt
import sci_palettes


print(sci_palettes.PALETTES.keys())

sci_palettes.register_cmap()          # register all palettes
sci_palettes.register_cmap('aaas')    # register a special palette

# methods for setting palette
plt.set_cmap('aaas')
plt.style.use('aaas')
sns.set_theme(palette='aaas')
sns.set_palette('aaas')

sns.scatterplot(...)

# set palette when plotting
sns.scatterplot(..., palette='aaas')

Full examples in examples
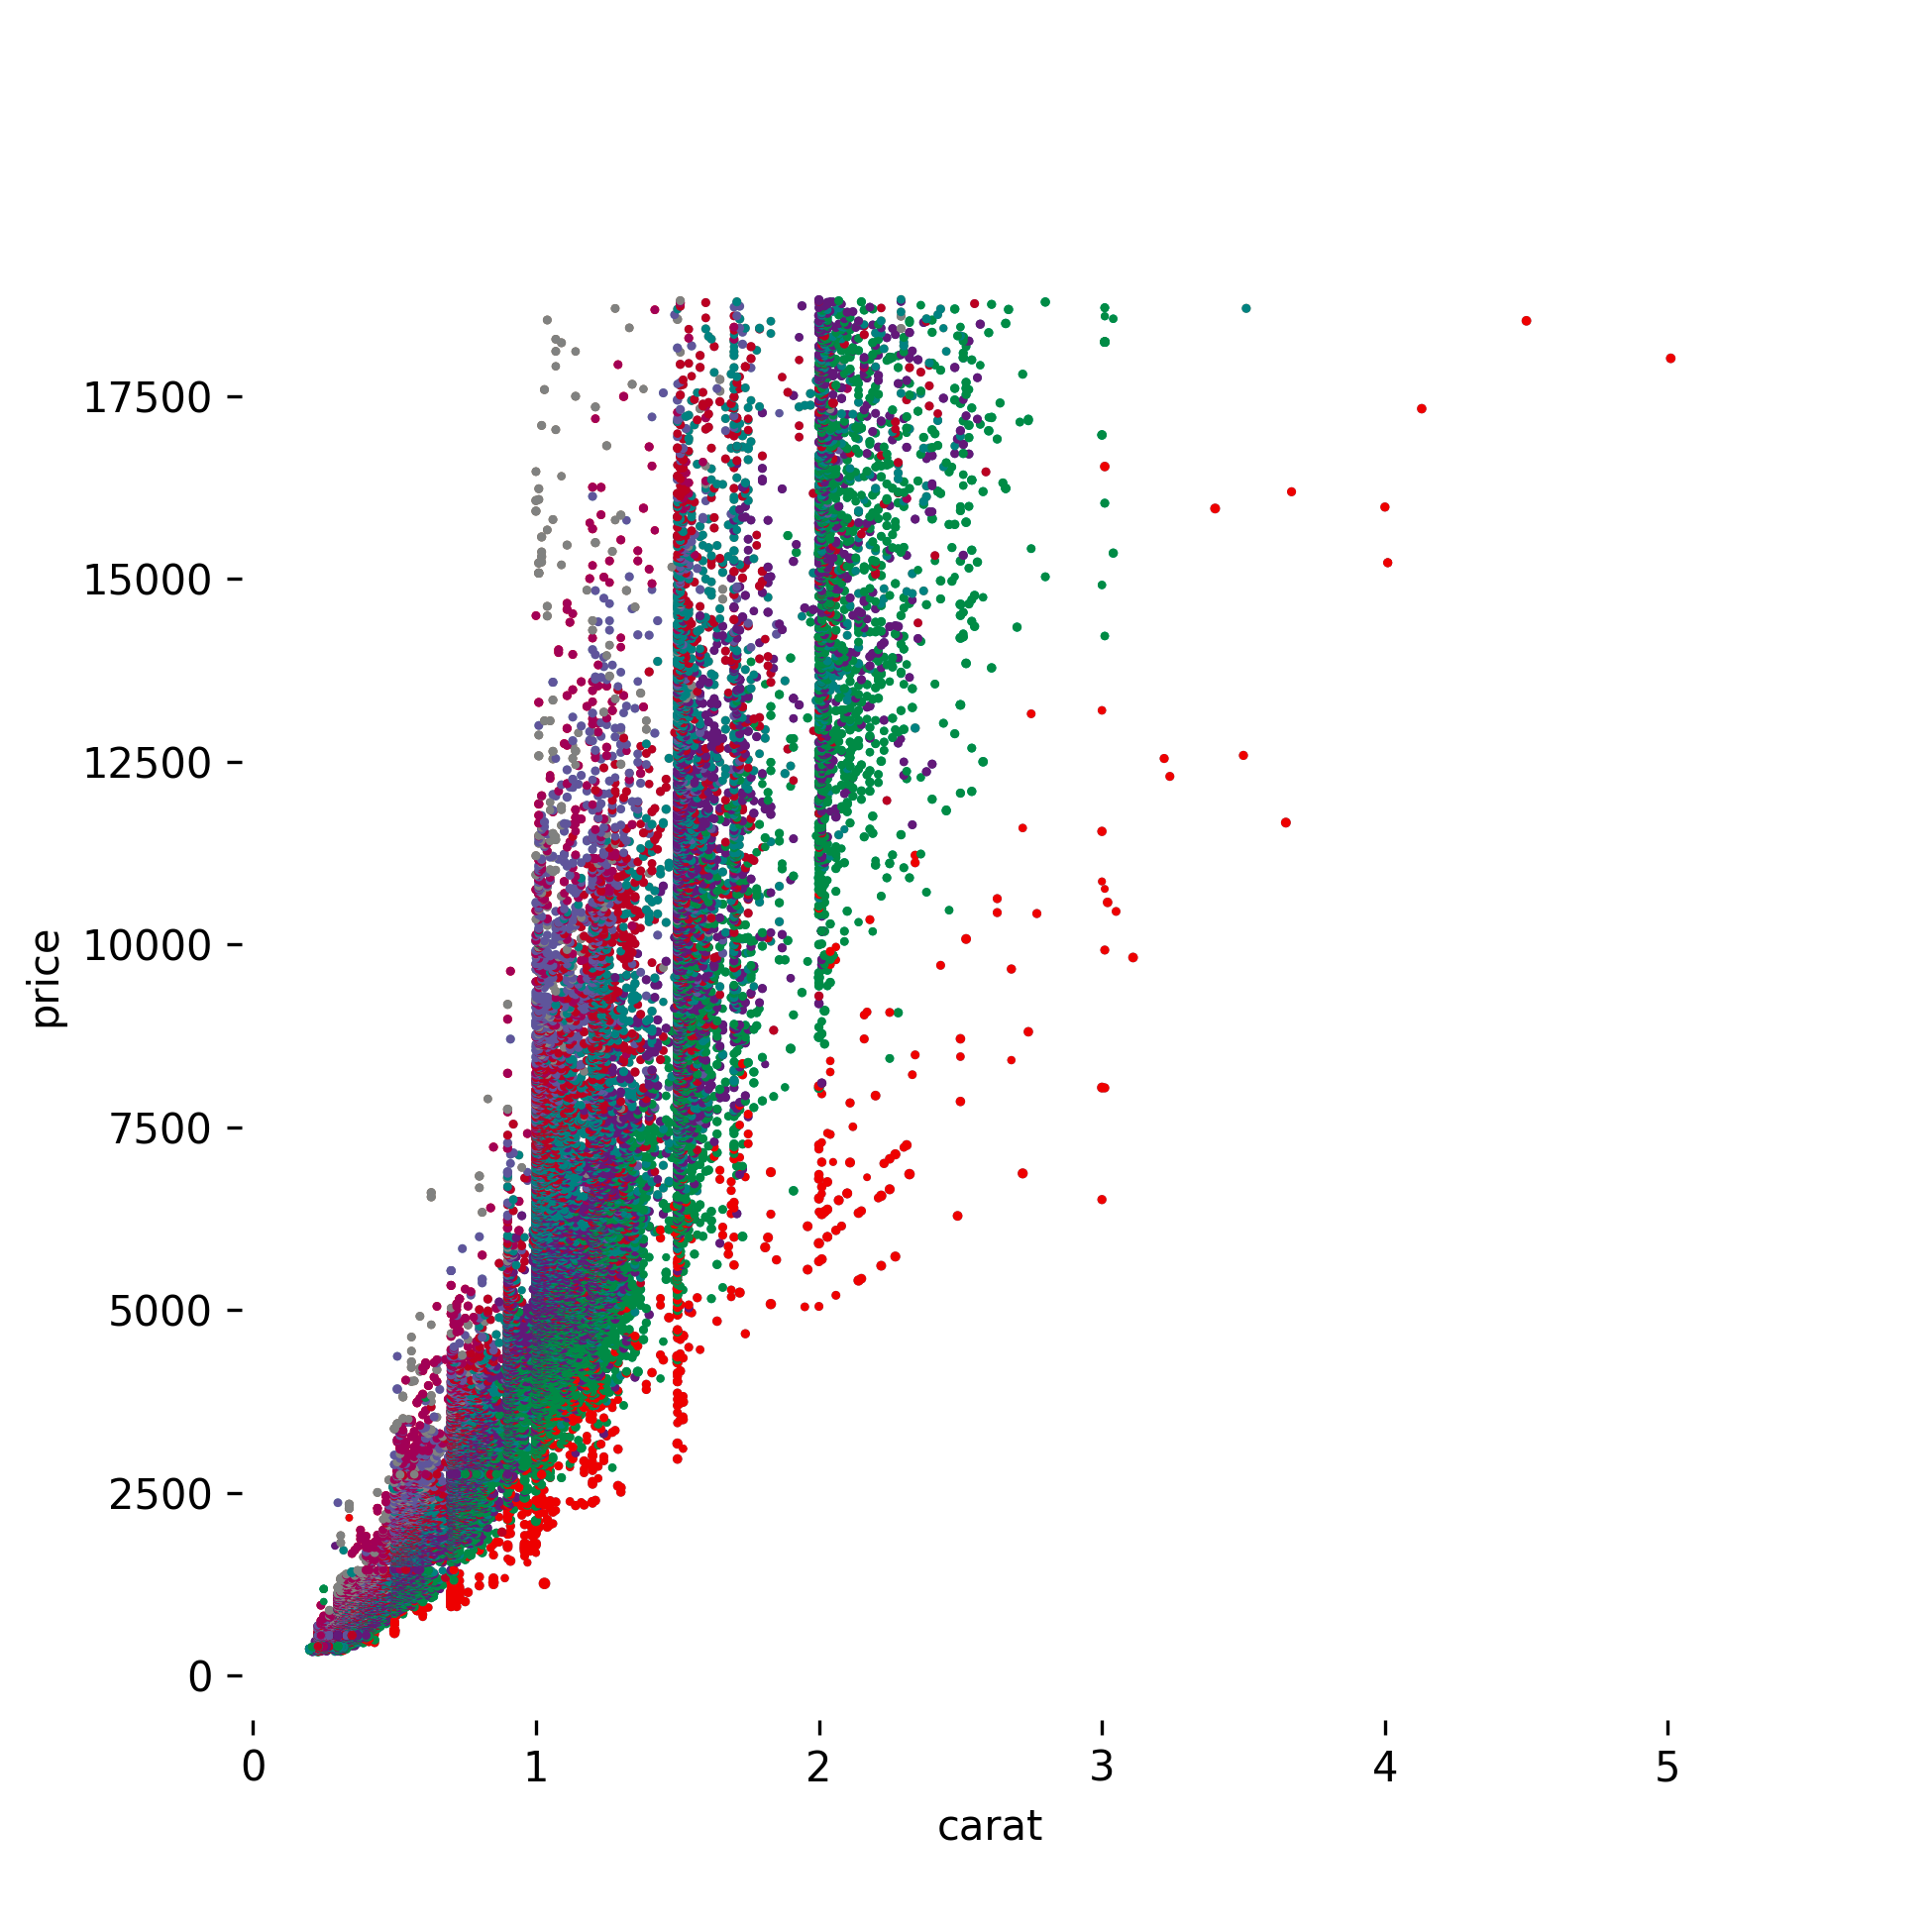
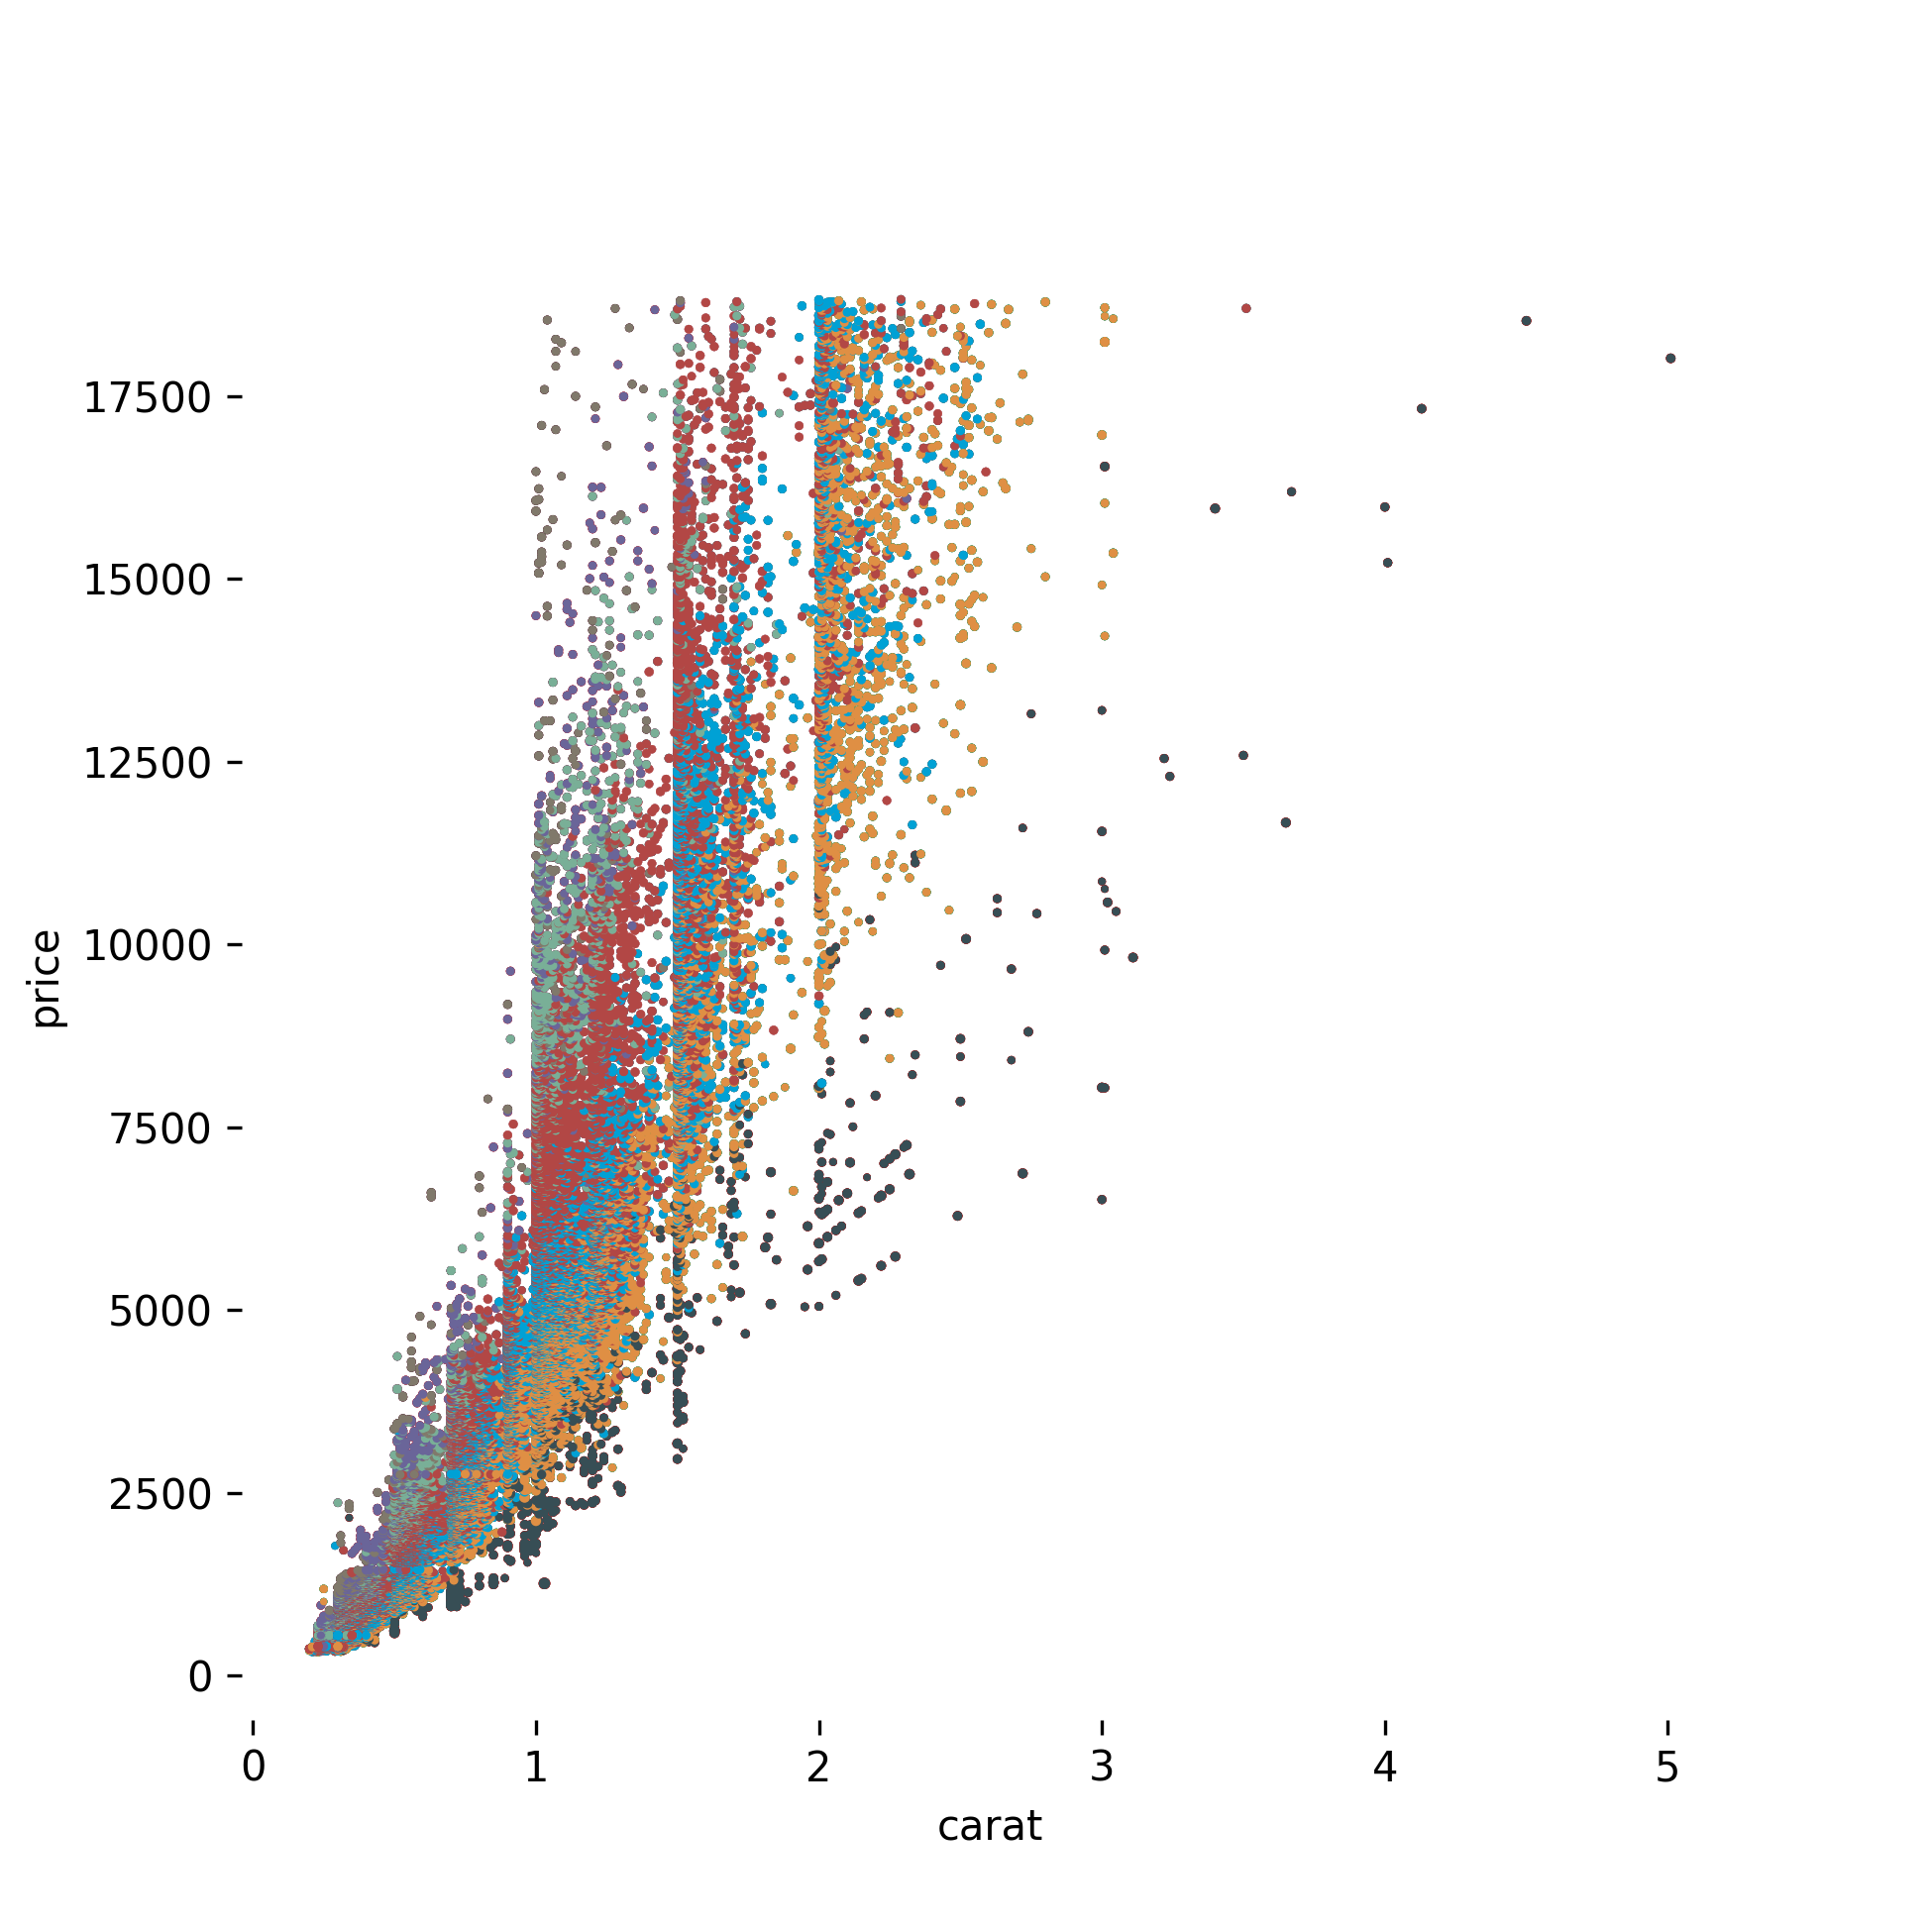
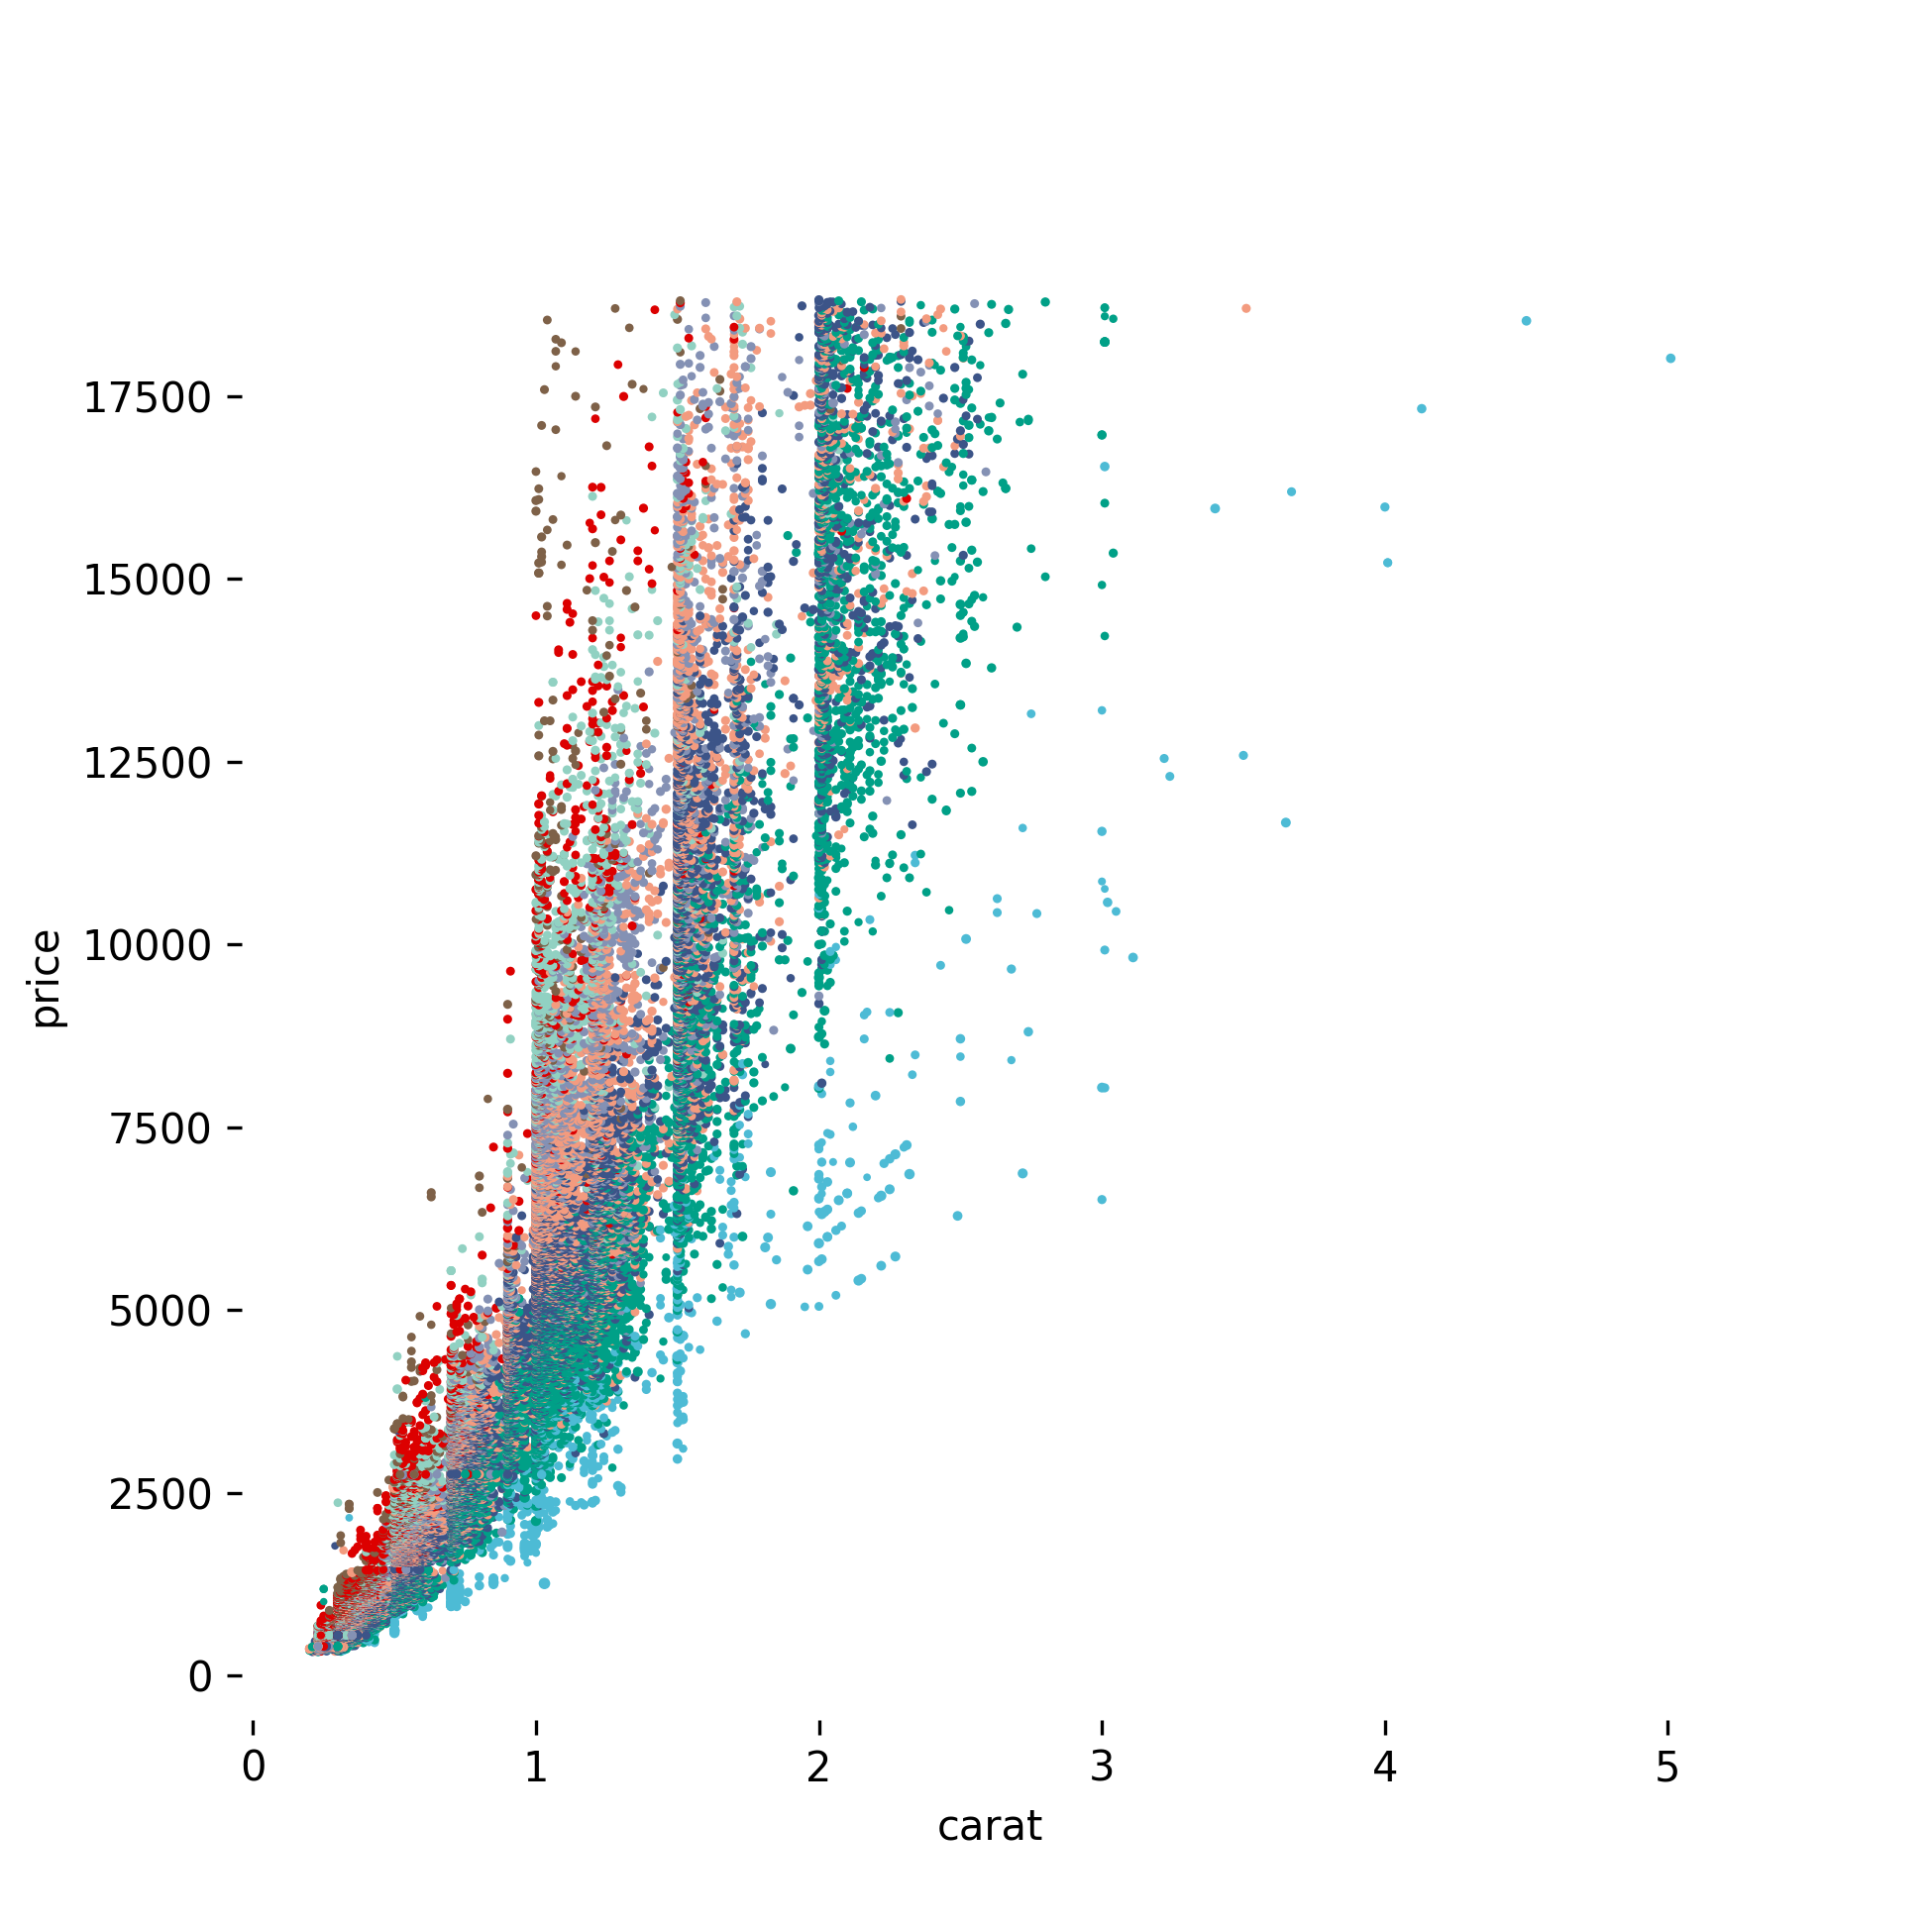
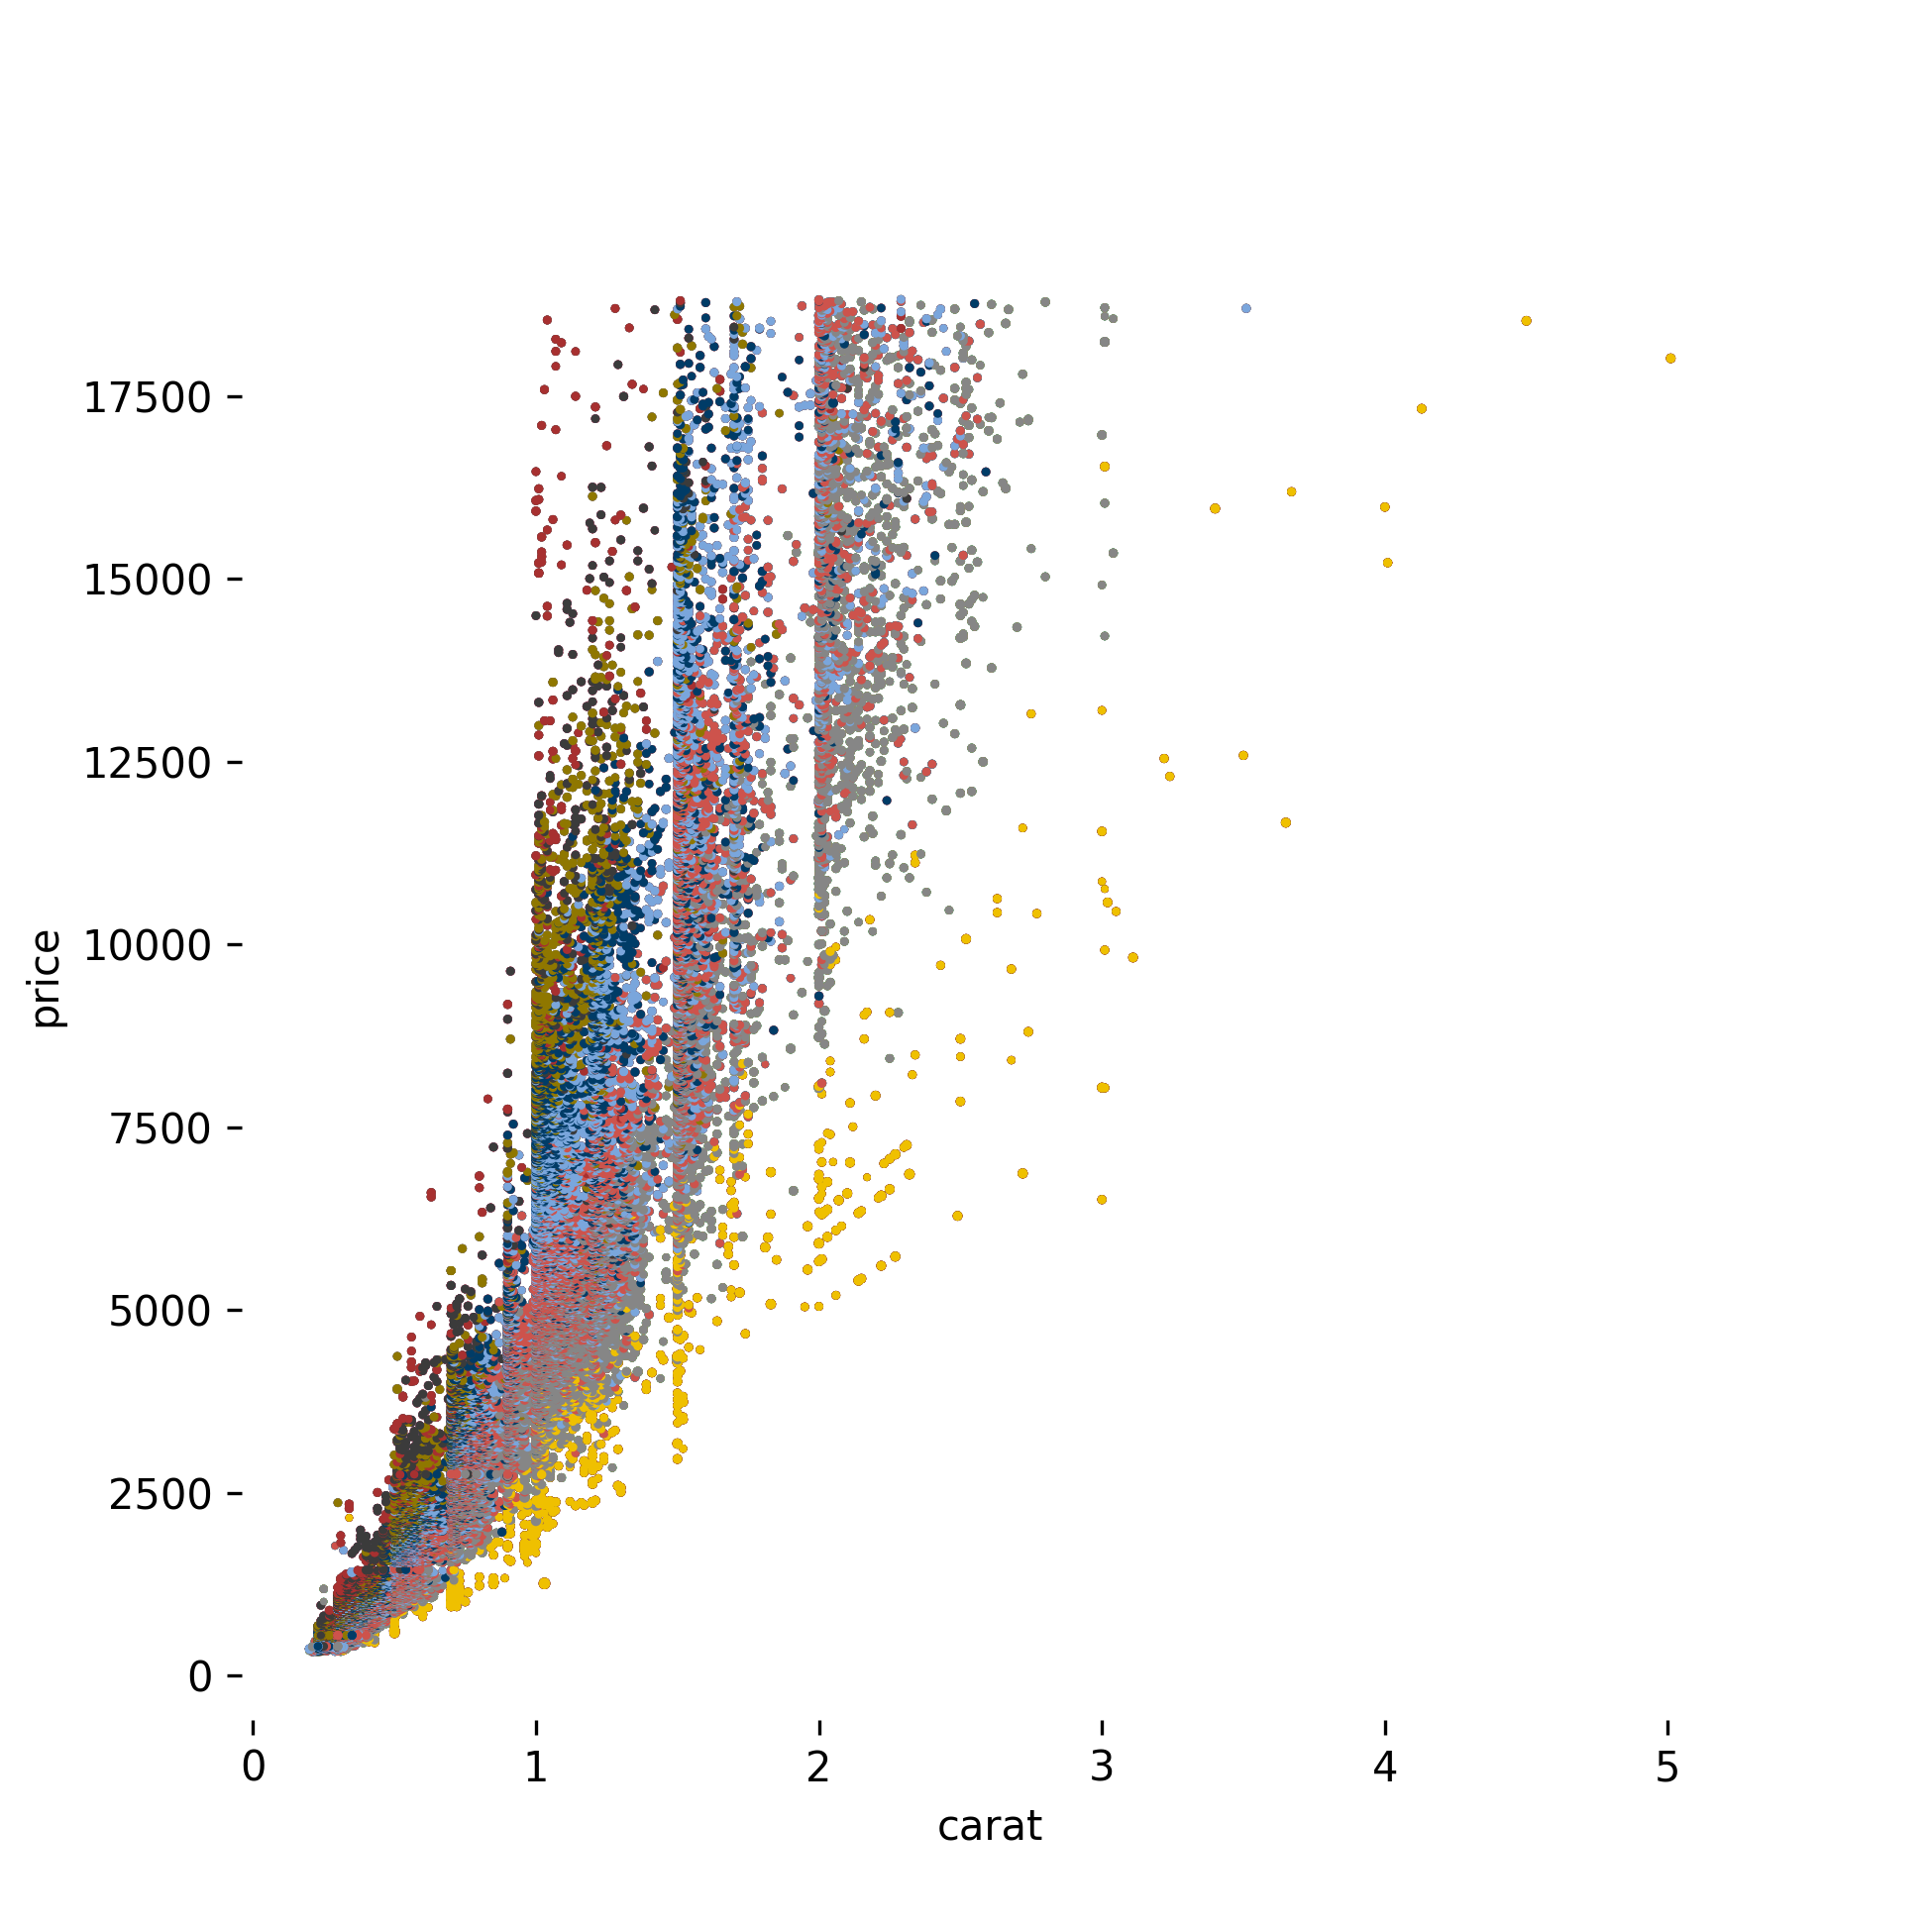
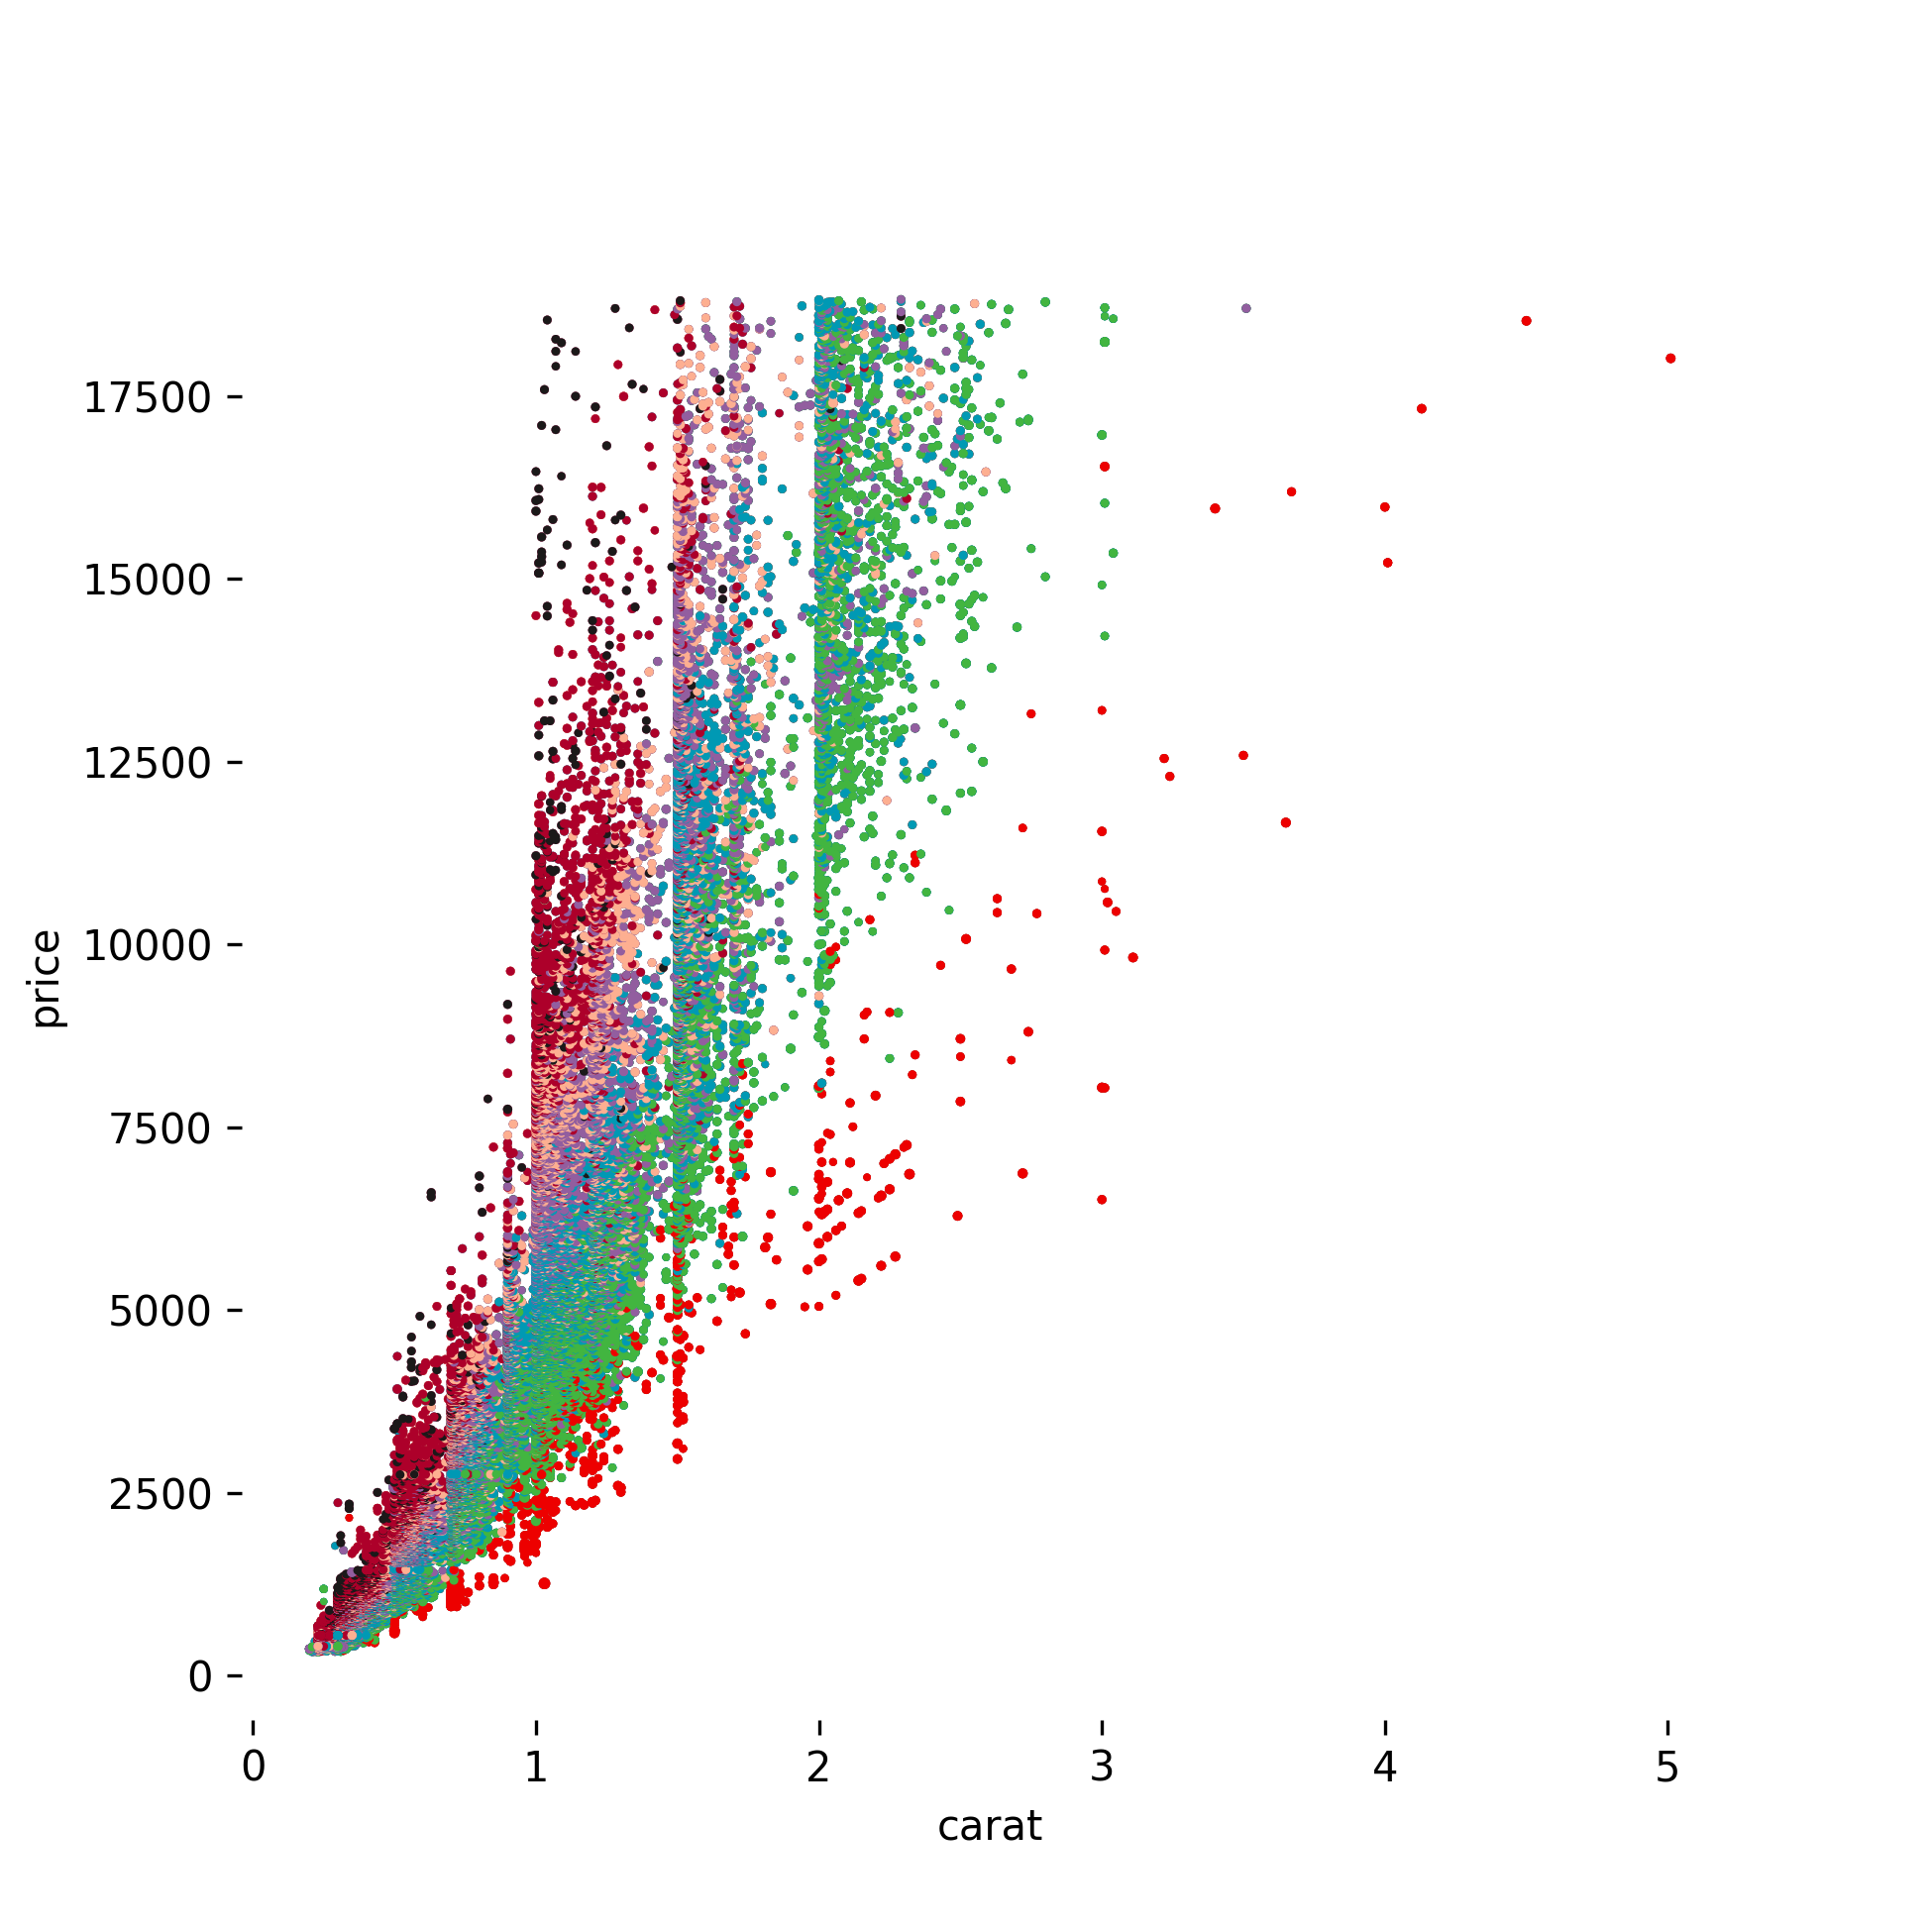
Gallery

展开查看

AAAS

JAMA

NPG

JCO

LANCET

Inspired by the R Package ggsci

You might also like...
matplotlib: plotting with Python

Matplotlib is a comprehensive library for creating static, animated, and interactive visualizations in Python. Check out our home page for more inform

Statistical data visualization using matplotlib

seaborn: statistical data visualization Seaborn is a Python visualization library based on matplotlib. It provides a high-level interface for drawing

:small_red_triangle: Ternary plotting library for python with matplotlib

python-ternary This is a plotting library for use with matplotlib to make ternary plots plots in the two dimensional simplex projected onto a two dime

Joyplots in Python with matplotlib & pandas :chart_with_upwards_trend:

JoyPy JoyPy is a one-function Python package based on matplotlib + pandas with a single purpose: drawing joyplots (a.k.a. ridgeline plots). The code f

A python package for animating plots build on matplotlib.

animatplot A python package for making interactive as well as animated plots with matplotlib. Requires Python = 3.5 Matplotlib = 2.2 (because slider

Painlessly create beautiful matplotlib plots.

Announcement Thank you to everyone who has used prettyplotlib and made it what it is today! Unfortunately, I no longer have the bandwidth to maintain

basemap - Plot on map projections (with coastlines and political boundaries) using matplotlib.

Basemap Plot on map projections (with coastlines and political boundaries) using matplotlib. ⚠️ Warning: this package is being deprecated in favour of

Easily convert matplotlib plots from Python into interactive Leaflet web maps.

mplleaflet mplleaflet is a Python library that converts a matplotlib plot into a webpage containing a pannable, zoomable Leaflet map. It can also embe

Design your own matplotlib stylefile interactively

Tired of playing with font sizes and other matplotlib parameters every time you start a new project or write a new plotting function? Want all you plots have the same style? Use matplotlib configuration files!

Owner
Qingdong Su
Love Python, Love Programming, Love Life.
Qingdong Su
Peloton Stats to Google Sheets with Data Visualization through Seaborn and Plotly

Peloton Stats to Google Sheets with Data Visualization through Seaborn and Plotly Problem: 2 peloton users were looking for a way to track their metri

null 9 Jul 22, 2022
Cartopy - a cartographic python library with matplotlib support

Cartopy is a Python package designed to make drawing maps for data analysis and visualisation easy. Table of contents Overview Get in touch License an

null 1.2k Jan 1, 2023
Statistical data visualization using matplotlib

seaborn: statistical data visualization Seaborn is a Python visualization library based on matplotlib. It provides a high-level interface for drawing

Michael Waskom 10.2k Dec 30, 2022
The windML framework provides an easy-to-use access to wind data sources within the Python world, building upon numpy, scipy, sklearn, and matplotlib. Renewable Wind Energy, Forecasting, Prediction

windml Build status : The importance of wind in smart grids with a large number of renewable energy resources is increasing. With the growing infrastr

Computational Intelligence Group 125 Dec 24, 2022
NorthPitch is a python soccer plotting library that sits on top of Matplotlib

NorthPitch is a python soccer plotting library that sits on top of Matplotlib.

Devin Pleuler 30 Feb 22, 2022
matplotlib: plotting with Python

Matplotlib is a comprehensive library for creating static, animated, and interactive visualizations in Python. Check out our home page for more inform

Matplotlib Developers 16.7k Jan 8, 2023
Statistical data visualization using matplotlib

seaborn: statistical data visualization Seaborn is a Python visualization library based on matplotlib. It provides a high-level interface for drawing

Michael Waskom 8.1k Feb 13, 2021
:small_red_triangle: Ternary plotting library for python with matplotlib

python-ternary This is a plotting library for use with matplotlib to make ternary plots plots in the two dimensional simplex projected onto a two dime

Marc 611 Dec 29, 2022
Joyplots in Python with matplotlib & pandas :chart_with_upwards_trend:

JoyPy JoyPy is a one-function Python package based on matplotlib + pandas with a single purpose: drawing joyplots (a.k.a. ridgeline plots). The code f

Leonardo Taccari 462 Jan 2, 2023
A python package for animating plots build on matplotlib.

animatplot A python package for making interactive as well as animated plots with matplotlib. Requires Python >= 3.5 Matplotlib >= 2.2 (because slider

Tyler Makaro 394 Dec 18, 2022