Please:
- [x] Check for duplicate issues. Please file separate requests as separate issues.
- [x] Describe how to reproduce the bug.
- [x] Use the latest versions of Vega and Vega-Lite. - using latest version of altair
- [x] Provide an minimal, reproducible example spec in JSON, wrapped by triple backticks like this:
{
  "$schema": "https://vega.github.io/schema/vega-lite/v4.17.0.json",
  "data": {"name": "data-0c37a591ceae41251602063922514f84"},
  "datasets": {
    "data-0c37a591ceae41251602063922514f84": [
      {
        "day": "2022-04-01T00:00:00",
        "metric": "Nodulation of legumes",
        "sample": "Arch Field: Hedge",
        "value_float": 0.5
      },
      {
        "day": "2022-07-27T00:00:00",
        "metric": "Nodulation of legumes",
        "sample": "Arch Field: Hedge",
        "value_float": 0.5
      }
    ]
  },
  "layer": [
    {
      "encoding": {
        "detail": {"field": "sample", "type": "nominal"},
        "opacity": {
          "condition": {"selection": "selector001", "value": 1},
          "value": 0.1
        },
        "x": {
          "axis": {"format": "%b %d", "title": null},
          "field": "day",
          "type": "temporal"
        },
        "y": {
          "axis": {"title": "Nodulation of legumes"},
          "field": "value_float",
          "scale": {"zero": false},
          "type": "quantitative"
        }
      },
      "mark": "line",
      "selection": {
        "selector001": {
          "bind": "legend",
          "fields": ["sample"],
          "toggle": "true",
          "type": "multi"
        }
      }
    },
    {
      "encoding": {
        "color": {"field": "sample", "type": "nominal"},
        "detail": {"field": "sample", "type": "nominal"},
        "opacity": {
          "condition": {"selection": "selector001", "value": 1},
          "value": 0.1
        },
        "tooltip": [
          {"field": "sample", "title": "Soil sample", "type": "nominal"},
          {"field": "day", "title": "Date", "type": "temporal"},
          {"field": "value_float", "title": "Value", "type": "quantitative"}
        ],
        "x": {"field": "day", "type": "temporal"},
        "y": {
          "field": "value_float",
          "scale": {"zero": false},
          "type": "quantitative"
        }
      },
      "mark": {"opacity": 1, "size": 50, "type": "circle"}
    }
  ],
  "title": "",
  "width": "container"
}
Hello! I have found some strange behaviour when representing a small dataset that includes a single data entry with a decimal point value. Here is a simplified version of the code I have to reproduce the bug:
def get_chart(df, dt_format, y_title):
	chart_base = alt.Chart(df)

	line_chart = chart_base.mark_line().encode(
	    x=alt.X("day", axis=alt.Axis(title=None, format=dt_format)),
	    y=alt.Y(
	        "value_float",
	        axis=alt.Axis(title=y_title),
	        scale=alt.Scale(zero=False),
	    ),
	)

	chart = alt.layer(line_chart).properties(width="container", title="")

	return chart.to_json()
The df is:
  day         metric             	sample  				value_float
0 2022-04-01  Nodulation of legumes  Arch Field: Hedge          0.5
1 2022-07-27  Nodulation of legumes  Arch Field: Hedge          0.5
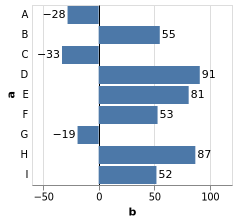
And the chart looks like this:

I would expect the scale on the y axis to be labeled 0.5 rather than 1!
If we try the same code with a slightly bigger dataset, it works as expected.
df
  day              metric              	sample                value_float
0 2022-05-06  Nodulation of legumes  Mud Mead: Sample 1          1.5
1 2022-07-29  Nodulation of legumes  Mud Mead: Sample 1          0.5
2 2022-08-12  Nodulation of legumes  Mud Mead: Sample 1          0.5
3 2022-09-28  Nodulation of legumes  Mud Mead: Sample 1          1.5
4 2022-11-28  Nodulation of legumes  Mud Mead: Sample 1          1.5

I'm not sure if it's relevant to the issue, but I am using a django template the display the chart. Here is the code from the template in case it is relevant:
<div id="chart" class="vega-plot col-12"></div>
<script type="text/javascript">
	window.addEventListener('DOMContentLoaded', function() {
	  vegaEmbed('#chart', {{ chart|safe }}, {renderer: 'svg'})
	})
</script>
Where chart is the chart.to_json() returned above.
Thanks for your help! Let me know if you need any more information.
- [] If applicable, include error messages and screenshots, GIF videos (e.g. using https://www.cockos.com/licecap/), or working examples (e.g. by clicking share in the Vega-Editor or https://bit.ly/vega-lite-blocks)
Bug :bug:


