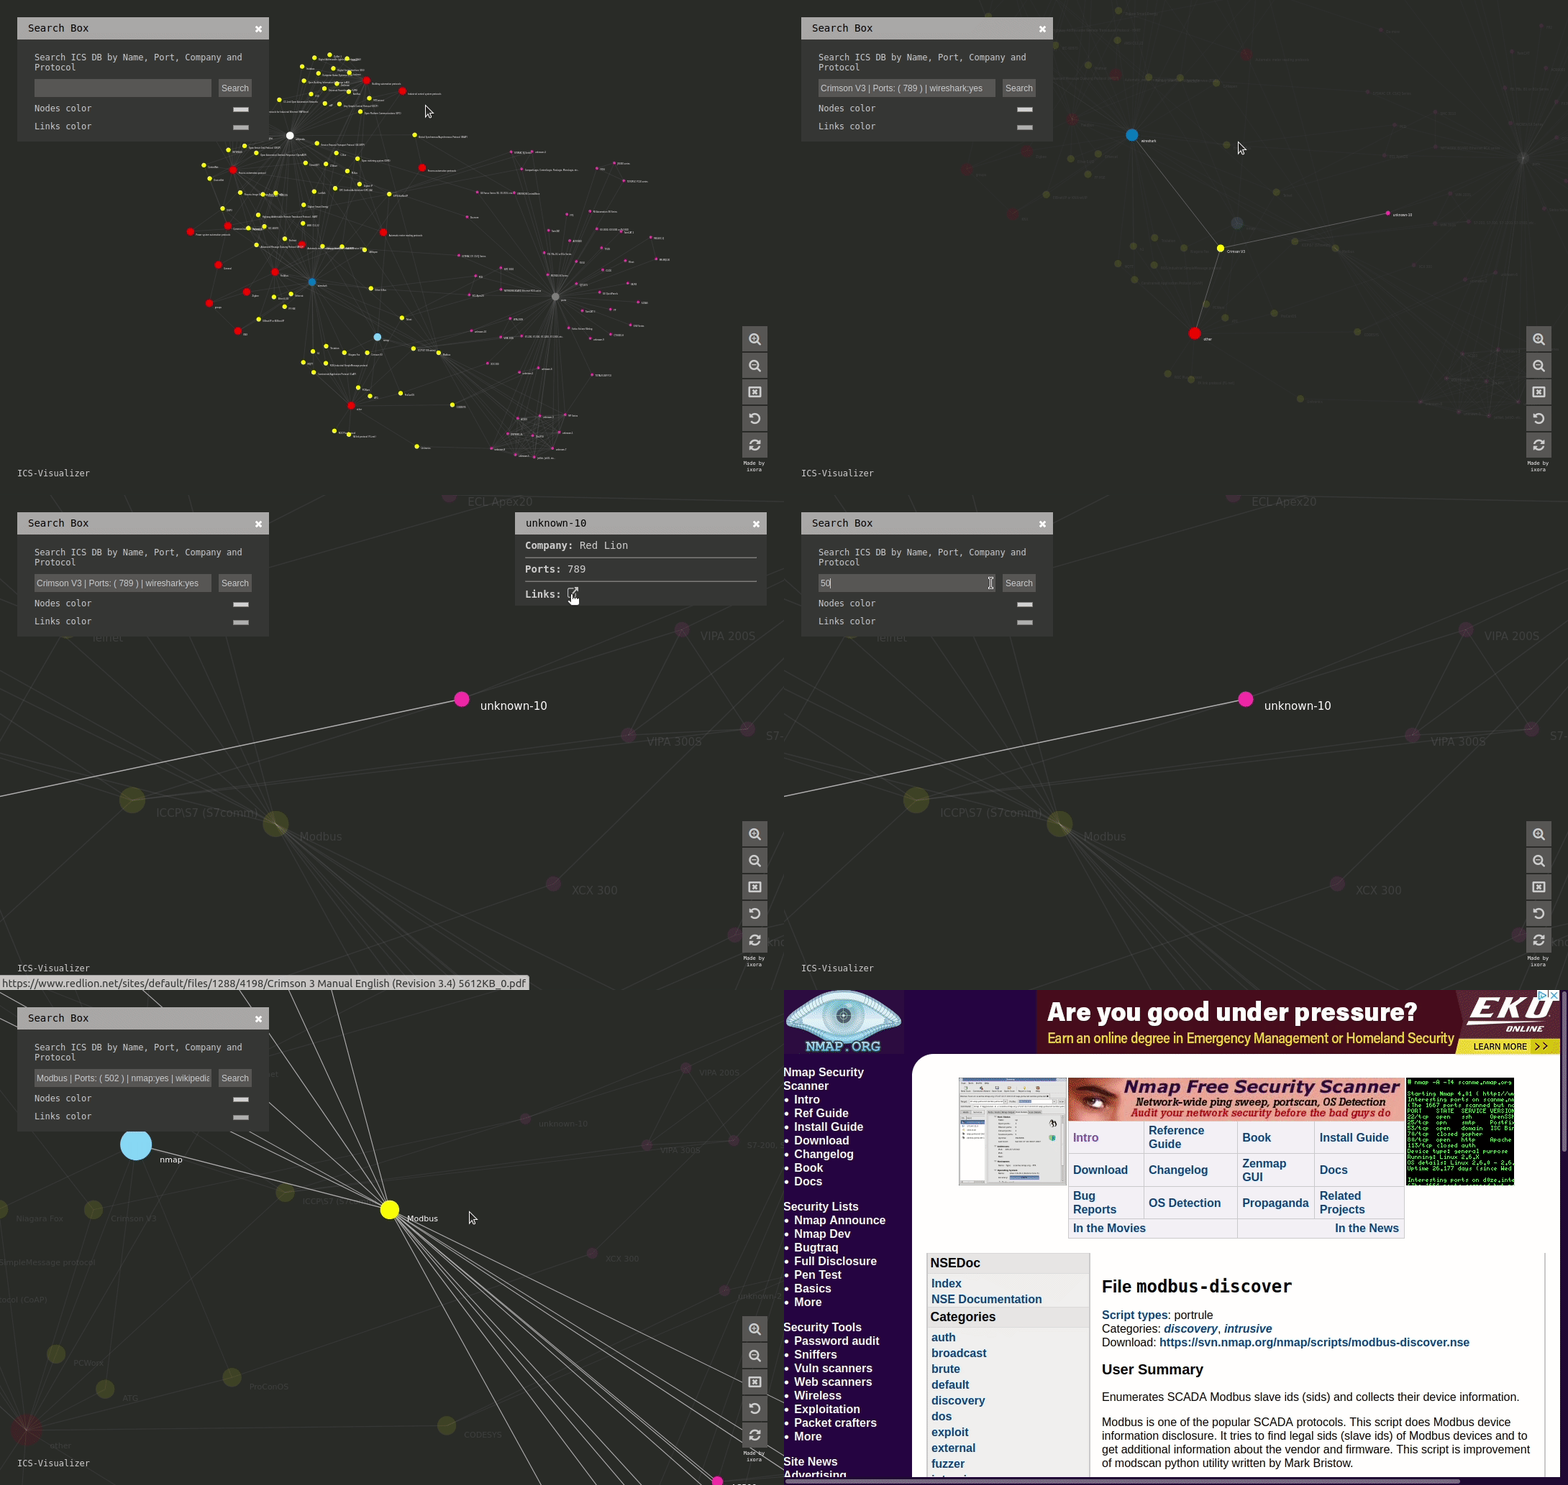
ICS-Visualizer is an interactive Industrial Control Systems (ICS) network graph that contains up-to-date ICS metadata

Overview

Generic badge Generic badge Generic badge Generic badge

ICS-Visualizer is an interactive Industrial Control Systems (ICS) network graph that contains up-to-date ICS metadata (Name, company, port, user manuals, external links, and mapped wireshark\namp modules and scripts).

Interface

Live

https://qeeqbox.github.io/ics-visualizer/

Features

  • ICS metadata (Name, company, port and info)
  • Mapped Wireshark and NMAP modules\scripts
  • External links to great ICS resources (Articles, manuals and projects)
  • Optimized canvas (Fast interaction)
  • Search function (Target item will be highlighted)
  • Zoom-in, zoom-out & reset options

Notes

  • ICS metadata db was compiled using my previous experience with ICS and a lot of great external articles\researches\projects (Do not forget to check them out!)

Resources

d3js.org wikipedia wireshark nmap and more

Other Licenses

By using this framework, you are accepting the license terms of each package listed below: D3, fontawesome, jQuery & JavaScript

Other Projects

You might also like...
This project is an Algorithm Visualizer where a user can visualize algorithms like Bubble Sort, Merge Sort, Quick Sort, Selection Sort, Linear Search and Binary Search.

Algo_Visualizer This project is an Algorithm Visualizer where a user can visualize common algorithms like "Bubble Sort", "Merge Sort", "Quick Sort", "

LabGraph is a a Python-first framework used to build sophisticated research systems with real-time streaming, graph API, and parallelism.

LabGraph is a a Python-first framework used to build sophisticated research systems with real-time streaming, graph API, and parallelism.

WebApp served by OAK PoE device to visualize various streams, metadata and AI results

DepthAI PoE WebApp | Bootstrap 4 & Vue.js SPA Dashboard Based on dashmin (https:

In-memory Graph Database and Knowledge Graph with Natural Language Interface, compatible with Pandas

CogniPy for Pandas - In-memory Graph Database and Knowledge Graph with Natural Language Interface Whats in the box Reasoning, exploration of RDF/OWL,

Generate a roam research like Network Graph view from your Notion pages.

Notion Graph View Export Notion pages to a Roam Research like graph view.

Interactive Data Visualization in the browser, from  Python
Interactive Data Visualization in the browser, from Python

Bokeh is an interactive visualization library for modern web browsers. It provides elegant, concise construction of versatile graphics, and affords hi

An interactive GUI for WhiteboxTools in a Jupyter-based environment

whiteboxgui An interactive GUI for WhiteboxTools in a Jupyter-based environment GitHub repo: https://github.com/giswqs/whiteboxgui Documentation: http

The interactive graphing library for Python (includes Plotly Express) :sparkles:

plotly.py Latest Release User forum PyPI Downloads License Data Science Workspaces Our recommended IDE for Plotly’s Python graphing library is Dash En

Interactive Data Visualization in the browser, from  Python
Interactive Data Visualization in the browser, from Python

Bokeh is an interactive visualization library for modern web browsers. It provides elegant, concise construction of versatile graphics, and affords hi

Owner
QeeqBox
Security Projects for Red, Blue and Purple Teams
QeeqBox
2D maze path solver visualizer implemented with python

2D maze path solver visualizer implemented with python

SS 14 Dec 21, 2022
Data Visualizer for Super Mario Kart (SNES)

Data Visualizer for Super Mario Kart (SNES)

MrL314 21 Nov 20, 2022
Log visualizer for whirl-framework

Lumberjack Log visualizer for whirl-framework Установка pip install -r requirements.txt Как пользоваться python3 lumberjack.py -l <путь до лога> -o <

Vladimir Malinovskii 2 Dec 19, 2022
This is a sorting visualizer made with Tkinter.

Sorting-Visualizer This is a sorting visualizer made with Tkinter. Make sure you've installed tkinter in your system to use this visualizer pip instal

Vishal Choubey 7 Jul 6, 2022
Alternative layout visualizer for ZSA Moonlander keyboard

General info This is a keyboard layout visualizer for ZSA Moonlander keyboard (because I didn't find their Oryx or their training tool particularly us

null 10 Jul 19, 2022
Decision Border Visualizer for Classification Algorithms

dbv Decision Border Visualizer for Classification Algorithms Project description A python package for Machine Learning Engineers who want to visualize

Sven Eschlbeck 1 Nov 1, 2021
A filler visualizer built using python

filler-visualizer 42 filler のログをビジュアライズしてスポーツさながら楽しむことができます! Usage (標準入力でvisualizer.pyに渡せばALL OK) 1. 既にあるログをビジュアライズする $ ./filler_vm -t 3 -p1 john_fill

Takumi Hara 1 Nov 4, 2021
ScisorWiz: Differential Isoform Visualizer for Long-Read RNA Sequencing Data

ScisorWiz: Vizualizer for Differential Isoform Expression README ScisorWiz is a linux-based R-package for visualizing differential isoform expression

Alexander Stein 6 Oct 4, 2022
Graphical visualizer for spectralyze by Lauchmelder23

spectralyze visualizer Graphical visualizer for spectralyze by Lauchmelder23 Install Install matplotlib and ffmpeg. Put ffmpeg.exe in same folder as v

Matthew 1 Dec 21, 2021
Time series visualizer is a flexible extension that provides filling world map by country from real data.

Time-series-visualizer Time series visualizer is a flexible extension that provides filling world map by country from csv or json file. You can know d

Long Ng 3 Jul 9, 2021