Collection of data visualizing projects through Tableau, Data Wrapper, and Power BI

Overview

Data-Visualization-Projects

Collection of data visualizing projects through Tableau, Data Wrapper, and Power BI

Indigenous-Brands-Social-Movements

Python(Pandas, NumPy, Re, Matplotlib), Data Visualization(Data Wrapper)

Selected as a part of competitive UC Berkeley Data Discovery Research Programs, "Indigenous Brands & Social Movements"

  • Cleaned datasets of trademarks owned by Native American Tribes through eliminating unnecessary columns, filling NAs with 0 other values
  • Based on the cleaned datasets, visualized locations of the trademarks on maps through usage of data visualization tool called DataWrapper

Research Program Description

Have you noticed how many brands in the marketplace use indigenous/Native American - oriented terms and imagery? From the notorious Washington Team to the logo on Land of Lakes butter, indigenous imagery and appropriation is everywhere, and worthy of serious study and data analysis. This project aims to bring the work of social movements and activism to a data-intensive study of First Nations brands and trademarks in order to chart a path forward. In this project, we will study how many of these terms are owned by native vs. non-native entities, study how these brands have changed over time, and how the law might be better deployed to protect ownership of indigenously oriented trademarks, and encourage retiring marks that are considered offensive or appropriative.

  • University of California, Berkeley / Data Discovery Research Program Project

Visualization of Homeless in the States using Tableau

Screen Shot 2021-08-18 at 9 07 04 PM

  • Dataset of statistics of homeless from Kaggle and Github

  • This dashboard answers the followings:

    • Which state has the most number of homeless?
    • Is there a difference of the number of homeless between 2012 and 2013?
    • In what state and how many of homeless people of each type(Unsheltered, families, veterans, unaccompanied children, and chronic) are there?
  • This dashboard is composed of the followings:

    • Bubbles of the number of homeless by the States
    • Map of the United States by the number of homeless
    • Stacked bar of the number of homeless for each type with selected State
    • Side-by-Side bar chart of the number of homeless in 2012 and 2013
  • Individual Project by Jinwoo(Roy) Yoon

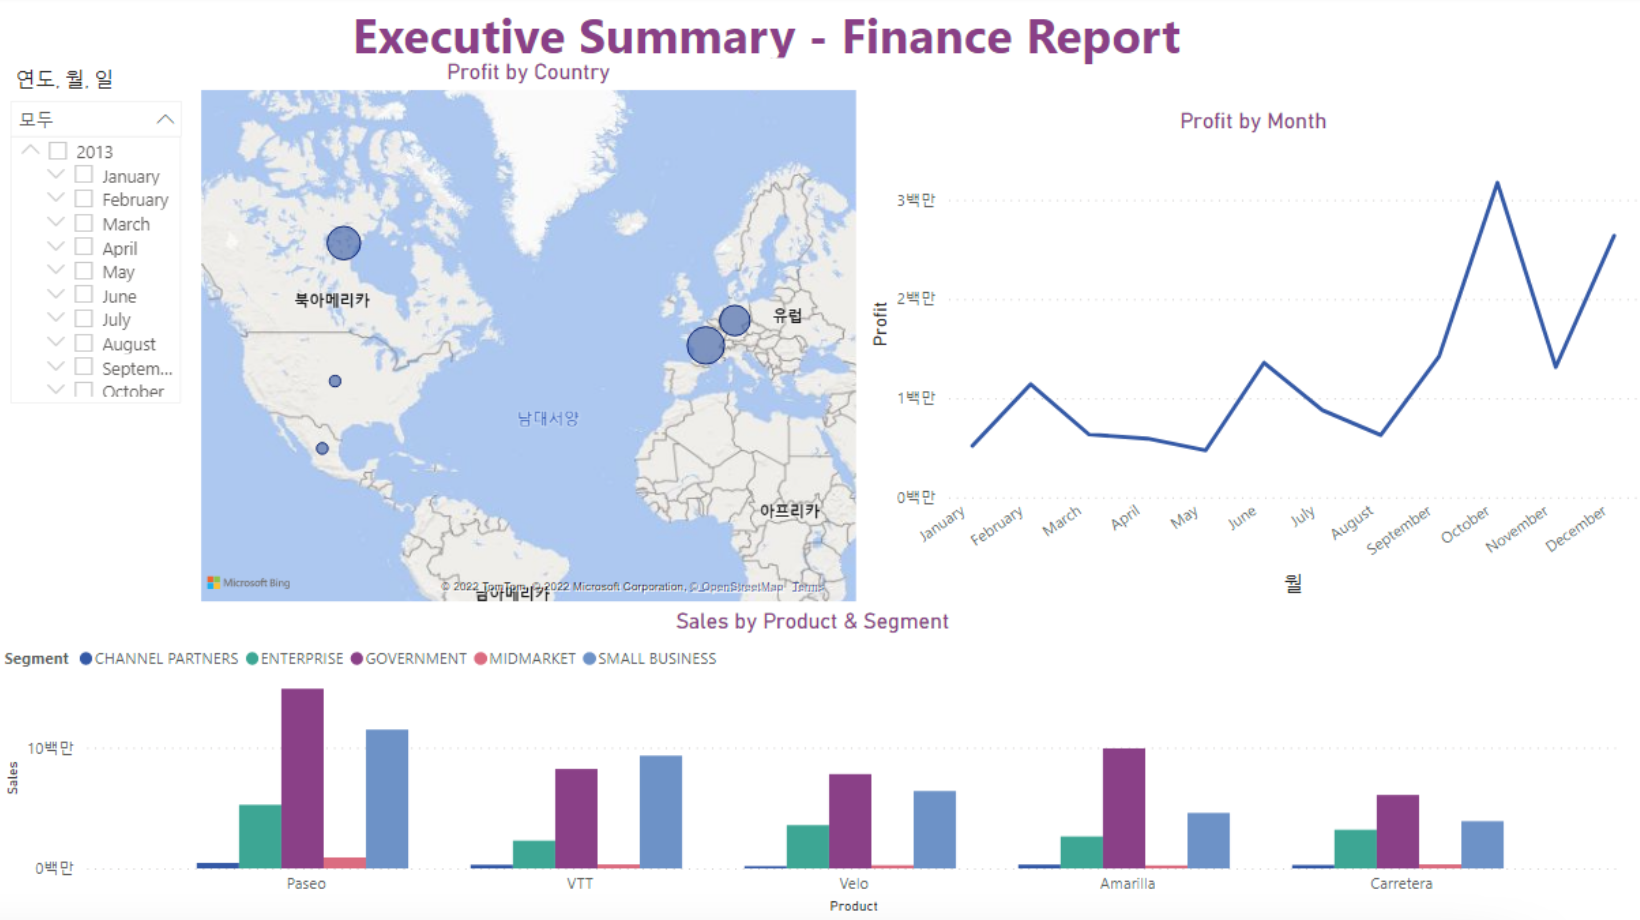
Finance Report using PowerBI

Screen Shot 2022-02-05 at 3 47 12 PM

  • Sample dataset (From Power BI) of a company's sales of products with various countries and dates
  • This dashboard answers the followings:
    • Which month/year was the most profitable?
    • In which country was the most profitable?
    • Which segment should the company invest more?
  • This dashboard is composed of the followings:
    • Map of the North America and Europe showing the amount of sales
    • Graph of profit from sales by months
    • Bar chart of sales by products/segments
  • Individual Project by Jinwoo(Roy) Yoon
You might also like...
HM02: Visualizing Interesting Datasets

HM02: Visualizing Interesting Datasets This is a homework assignment for CSCI 40 class at Claremont McKenna College. Go to the project page to learn m

HW 2: Visualizing interesting datasets

HW 2: Visualizing interesting datasets Check out the project instructions here! Mean Earnings per Hour for Males and Females My first graph uses data

Generate SVG (dark/light) images visualizing (private/public) GitHub repo statistics for profile/website.

Generate daily updated visualizations of GitHub user and repository statistics from the GitHub API using GitHub Actions for any combination of private and public repositories, whether owned or contributed to - no server required.

Backend app for visualizing CANedge log files in Grafana (directly from local disk or S3)

CANedge Grafana Backend - Visualize CAN/LIN Data in Dashboards This project enables easy dashboard visualization of log files from the CANedge CAN/LIN

Rubrix is a free and open-source tool for exploring and iterating on data for artificial intelligence projects.

Open-source tool for exploring, labeling, and monitoring data for AI projects

metedraw is a project mainly for data visualization projects of Atmospheric Science, Marine Science, Environmental Science or other majors

It is mainly for data visualization projects of Atmospheric Science, Marine Science, Environmental Science or other majors.

Peloton Stats to Google Sheets with Data Visualization through Seaborn and Plotly

Peloton Stats to Google Sheets with Data Visualization through Seaborn and Plotly Problem: 2 peloton users were looking for a way to track their metri

Splore - a simple graphical interface for scrolling through and exploring data sets of molecules

Scroll through and exPLORE molecule sets The splore framework aims to offer a si

This is a small repository for me to implement my simply Data Visualisation skills through Python.

Data Visualisations This is a small repository for me to implement my simply Data Visualisation skills through Python. Steam Population Chart from 10/

Owner
Jinwoo(Roy) Yoon
Rising Senior at University of California, Berkeley Data Science (May 2023)
Jinwoo(Roy) Yoon
Tools for calculating and visualizing Elo-like ratings of MLB teams using Retosheet data

Overview This project uses historical baseball games data to calculate an Elo-like rating for MLB teams based on regular season match ups. The Elo rat

Lukas Owens 0 Aug 25, 2021
Keir&'s Visualizing Data on Life Expectancy

Keir's Visualizing Data on Life Expectancy Below is information on life expectancy in the United States from 1900-2017. You will also find information

null 9 Jun 6, 2022
Leyna's Visualizing Data With Python

Leyna's Visualizing Data Below is information on the number of bilingual students in three school districts in Massachusetts. You will also find infor

null 11 Oct 28, 2021
A command line tool for visualizing CSV/spreadsheet-like data

PerfPlotter Read data from CSV files using pandas and generate interactive plots using bokeh, which can then be embedded into HTML pages and served by

Gino Mempin 0 Jun 25, 2022
A python-generated website for visualizing the novel coronavirus (COVID-19) data for Greece.

COVID-19-Greece A python-generated website for visualizing the novel coronavirus (COVID-19) data for Greece. Data sources Data provided by Johns Hopki

Isabelle Viktoria Maciohsek 23 Jan 3, 2023
eoplatform is a Python package that aims to simplify Remote Sensing Earth Observation by providing actionable information on a wide swath of RS platforms and provide a simple API for downloading and visualizing RS imagery

An Earth Observation Platform Earth Observation made easy. Report Bug | Request Feature About eoplatform is a Python package that aims to simplify Rem

Matthew Tralka 4 Aug 11, 2022
Python toolkit for defining+simulating+visualizing+analyzing attractors, dynamical systems, iterated function systems, roulette curves, and more

Attractors A small module that provides functions and classes for very efficient simulation and rendering of iterated function systems; dynamical syst

null 1 Aug 4, 2021
Visualizing weather changes across the world using third party APIs and Python.

WEATHER FORECASTING ACROSS THE WORLD Overview Python scripts were created to visualize the weather for over 500 cities across the world at varying di

G Johnson 0 Jun 12, 2021
Pydrawer: The Python package for visualizing curves and linear transformations in a super simple way

pydrawer ?? The Python package for visualizing curves and linear transformations in a super simple way. ✏️ Installation Install pydrawer package with

Dylan Tintenfich 56 Dec 30, 2022
Curvipy - The Python package for visualizing curves and linear transformations in a super simple way

Curvipy - The Python package for visualizing curves and linear transformations in a super simple way

Dylan Tintenfich 55 Dec 28, 2022