Python toolkit for defining+simulating+visualizing+analyzing attractors, dynamical systems, iterated function systems, roulette curves, and more

Overview

Attractors

A small module that provides functions and classes for very efficient simulation and rendering of iterated function systems; dynamical systems, roulette curves, (strange) attractors, and so on.

Installation

Clone this repository and install with pip or another package manager. Alternatively, just clone/download the repo and use a relative import to include the scripts in your project.

Dependencies

  • Numba
  • NumPy
  • Matplotlib
  • SciPy (optional, only needed for image postprocessing)
  • nbdev (if building from source/developing)

Documentation

A brief overview of the project's main features is given below. For a more comprehensive API reference, documentation of specific classes, and functions, etc., see https://generic-github-user.github.io/attractors/.

Usage

attractors tries to conform to the principle of least astonishment wherever possible (and variable names, classes, parameters etc. aim to be readable), so using the tools should be fairly intuitive.

If we want to make a new RouletteCurve, for instance, the following will initialize one with the default parameters (including randomized arm lengths/rotation speeds):

R = RouletteCurve(num_sections=2)

Then, we can run simulate and render; function chaining is usually available since most class methods return the class instance ("self"):

R.simulate_accelerated(steps=10000).render(mode='hist', hist_args=dict(bins=150))


png

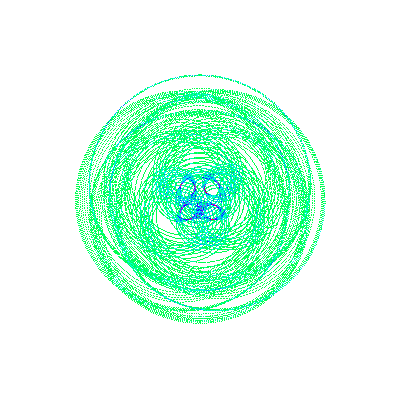
Other rendering modes are available; line will trace between each generated point.

RouletteCurve(num_sections=2).simulate_accelerated(steps=200).render(mode='line')


png

A softer render can be achieved using dist (and an optional falloff value that corresponds to the norm order when generating the brush).

RouletteCurve(num_sections=3).simulate_accelerated(steps=10000).render(mode='dist', falloff=3)
[[0.31748021 0.37475618 0.39893899 0.39893899 0.37475618]
 [0.37475618 0.52913368 0.65863376 0.65863376 0.52913368]
 [0.39893899 0.65863376 1.58740105 1.58740105 0.65863376]
 [0.39893899 0.65863376 1.58740105 1.58740105 0.65863376]
 [0.37475618 0.52913368 0.65863376 0.65863376 0.52913368]]


png

License

This project is licensed under GPL v2.0. The license file may be viewed here.

Tools

attractors is built using nbdev and Jupyter Lab, two open-source projects whose developers are owed much credit for making the development process highly efficient and enjoyable.

You might also like...
Collection of data visualizing projects through Tableau, Data Wrapper, and Power BI

Data-Visualization-Projects Collection of data visualizing projects through Tableau, Data Wrapper, and Power BI Indigenous-Brands-Social-Movements Pyt

HM02: Visualizing Interesting Datasets

HM02: Visualizing Interesting Datasets This is a homework assignment for CSCI 40 class at Claremont McKenna College. Go to the project page to learn m

Keir&'s Visualizing Data on Life Expectancy

Keir's Visualizing Data on Life Expectancy Below is information on life expectancy in the United States from 1900-2017. You will also find information

HW 2: Visualizing interesting datasets

HW 2: Visualizing interesting datasets Check out the project instructions here! Mean Earnings per Hour for Males and Females My first graph uses data

A command line tool for visualizing CSV/spreadsheet-like data

PerfPlotter Read data from CSV files using pandas and generate interactive plots using bokeh, which can then be embedded into HTML pages and served by

Generate SVG (dark/light) images visualizing (private/public) GitHub repo statistics for profile/website.

Generate daily updated visualizations of GitHub user and repository statistics from the GitHub API using GitHub Actions for any combination of private and public repositories, whether owned or contributed to - no server required.

Backend app for visualizing CANedge log files in Grafana (directly from local disk or S3)

CANedge Grafana Backend - Visualize CAN/LIN Data in Dashboards This project enables easy dashboard visualization of log files from the CANedge CAN/LIN

a python function to plot a geopandas dataframe

Pretty GeoDataFrame A minimum python function (~60 lines) to draw pretty geodataframe. Based on matplotlib, shapely, descartes. Installation just use

A Python function that makes flower plots.

Flower plot A Python 3.9+ function that makes flower plots. Installation This package requires at least Python 3.9. pip install

Comments
  • Add function for evolving visually interesting attractor systems

    Add function for evolving visually interesting attractor systems

    The same optimization process (probably evolutionary in this case) could probably be used for both this and optimizing based on an objective function (i.e., attractor/dynamical system inference)

    opened by generic-github-user 0
  • Allow incremental rendering

    Allow incremental rendering

    This may not be useful (or possible) for every rendering method (especially since rendering is usually much quicker than simulation), but could make rapid previewing/interactive iteration faster

    opened by generic-github-user 0
Owner
I work primarily on experiments & tools for machine learning, data analysis/visualization, and simulations. Check my README for a list of current projects.
null
Pydrawer: The Python package for visualizing curves and linear transformations in a super simple way

pydrawer ?? The Python package for visualizing curves and linear transformations in a super simple way. ✏️ Installation Install pydrawer package with

Dylan Tintenfich 56 Dec 30, 2022
Curvipy - The Python package for visualizing curves and linear transformations in a super simple way

Curvipy - The Python package for visualizing curves and linear transformations in a super simple way

Dylan Tintenfich 55 Dec 28, 2022
The Timescale NFT Starter Kit is a step-by-step guide to get up and running with collecting, storing, analyzing and visualizing NFT data from OpenSea, using PostgreSQL and TimescaleDB.

Timescale NFT Starter Kit The Timescale NFT Starter Kit is a step-by-step guide to get up and running with collecting, storing, analyzing and visualiz

Timescale 102 Dec 24, 2022
A program that analyzes data from inertia measurement units installed in aircraft and generates g-exceedance curves.

A program that analyzes data from inertia measurement units installed in aircraft and generates g-exceedance curves.

Pooya 1 Dec 2, 2021
This is my favourite function - the Rastrigin function.

This is my favourite function - the Rastrigin function. What sparked my curiosity and interest in the function was its complexity in terms of many local optimum points, which makes it particularly interesting and useful for testing any optimisation algorithms.

null 1 Dec 27, 2021
eoplatform is a Python package that aims to simplify Remote Sensing Earth Observation by providing actionable information on a wide swath of RS platforms and provide a simple API for downloading and visualizing RS imagery

An Earth Observation Platform Earth Observation made easy. Report Bug | Request Feature About eoplatform is a Python package that aims to simplify Rem

Matthew Tralka 4 Aug 11, 2022
Visualizing weather changes across the world using third party APIs and Python.

WEATHER FORECASTING ACROSS THE WORLD Overview Python scripts were created to visualize the weather for over 500 cities across the world at varying di

G Johnson 0 Jun 12, 2021
Leyna's Visualizing Data With Python

Leyna's Visualizing Data Below is information on the number of bilingual students in three school districts in Massachusetts. You will also find infor

null 11 Oct 28, 2021
A python-generated website for visualizing the novel coronavirus (COVID-19) data for Greece.

COVID-19-Greece A python-generated website for visualizing the novel coronavirus (COVID-19) data for Greece. Data sources Data provided by Johns Hopki

Isabelle Viktoria Maciohsek 23 Jan 3, 2023
Tools for calculating and visualizing Elo-like ratings of MLB teams using Retosheet data

Overview This project uses historical baseball games data to calculate an Elo-like rating for MLB teams based on regular season match ups. The Elo rat

Lukas Owens 0 Aug 25, 2021