23 Repositories
Python bokeh Libraries

A workshop on data visualization in Python with notebooks and exercises for following along.
Beyond the Basics: Data Visualization in Python The human brain excels at finding patterns in visual representations, which is why data visualizations
Reinforcement learning algorithms in RLlib
raylab Reinforcement learning algorithms in RLlib and PyTorch. Installation pip install raylab Quickstart Raylab provides agents and environments to b

JupyterHub extension for ContainDS Dashboards
ContainDS Dashboards for JupyterHub A Dashboard publishing solution for Data Science teams to share results with decision makers. Run a private on-pre
Python’s bokeh, holoviews, matplotlib, plotly, seaborn package-based visualizations about COVID statistics eventually hosted as a web app on Heroku
COVID-Watch-NYC-Python-Visualization-App Python’s bokeh, holoviews, matplotlib, plotly, seaborn package-based visualizations about COVID statistics ev

web application for flight log analysis & review
Flight Review This is a web application for flight log analysis. It allows users to upload ULog flight logs, and analyze them through the browser. It

Resources for teaching & learning practical data visualization with python.
Practical Data Visualization with Python Overview All views expressed on this site are my own and do not represent the opinions of any entity with whi

A real-time financial data streaming pipeline and visualization platform using Apache Kafka, Cassandra, and Bokeh.
Realtime Financial Market Data Visualization and Analysis Introduction This repo shows my project about real-time stock data pipeline. All the code is
A Bokeh project developed for learning and teaching Bokeh interactive plotting!
Bokeh-Python-Visualization A Bokeh project developed for learning and teaching Bokeh interactive plotting! See my medium blog posts about making bokeh

A set of useful perceptually uniform colormaps for plotting scientific data
Colorcet: Collection of perceptually uniform colormaps Build Status Coverage Latest dev release Latest release Docs What is it? Colorcet is a collecti

A streamlit component for bi-directional communication with bokeh plots.
Streamlit Bokeh Events A streamlit component for bi-directional communication with bokeh plots. Its just a workaround till streamlit team releases sup

A command line tool for visualizing CSV/spreadsheet-like data
PerfPlotter Read data from CSV files using pandas and generate interactive plots using bokeh, which can then be embedded into HTML pages and served by

Convolutional neural network web app trained to track our infant’s sleep schedule using our Google Nest camera.
Machine Learning Sleep Schedule Tracker What is it? Convolutional neural network web app trained to track our infant’s sleep schedule using our Google

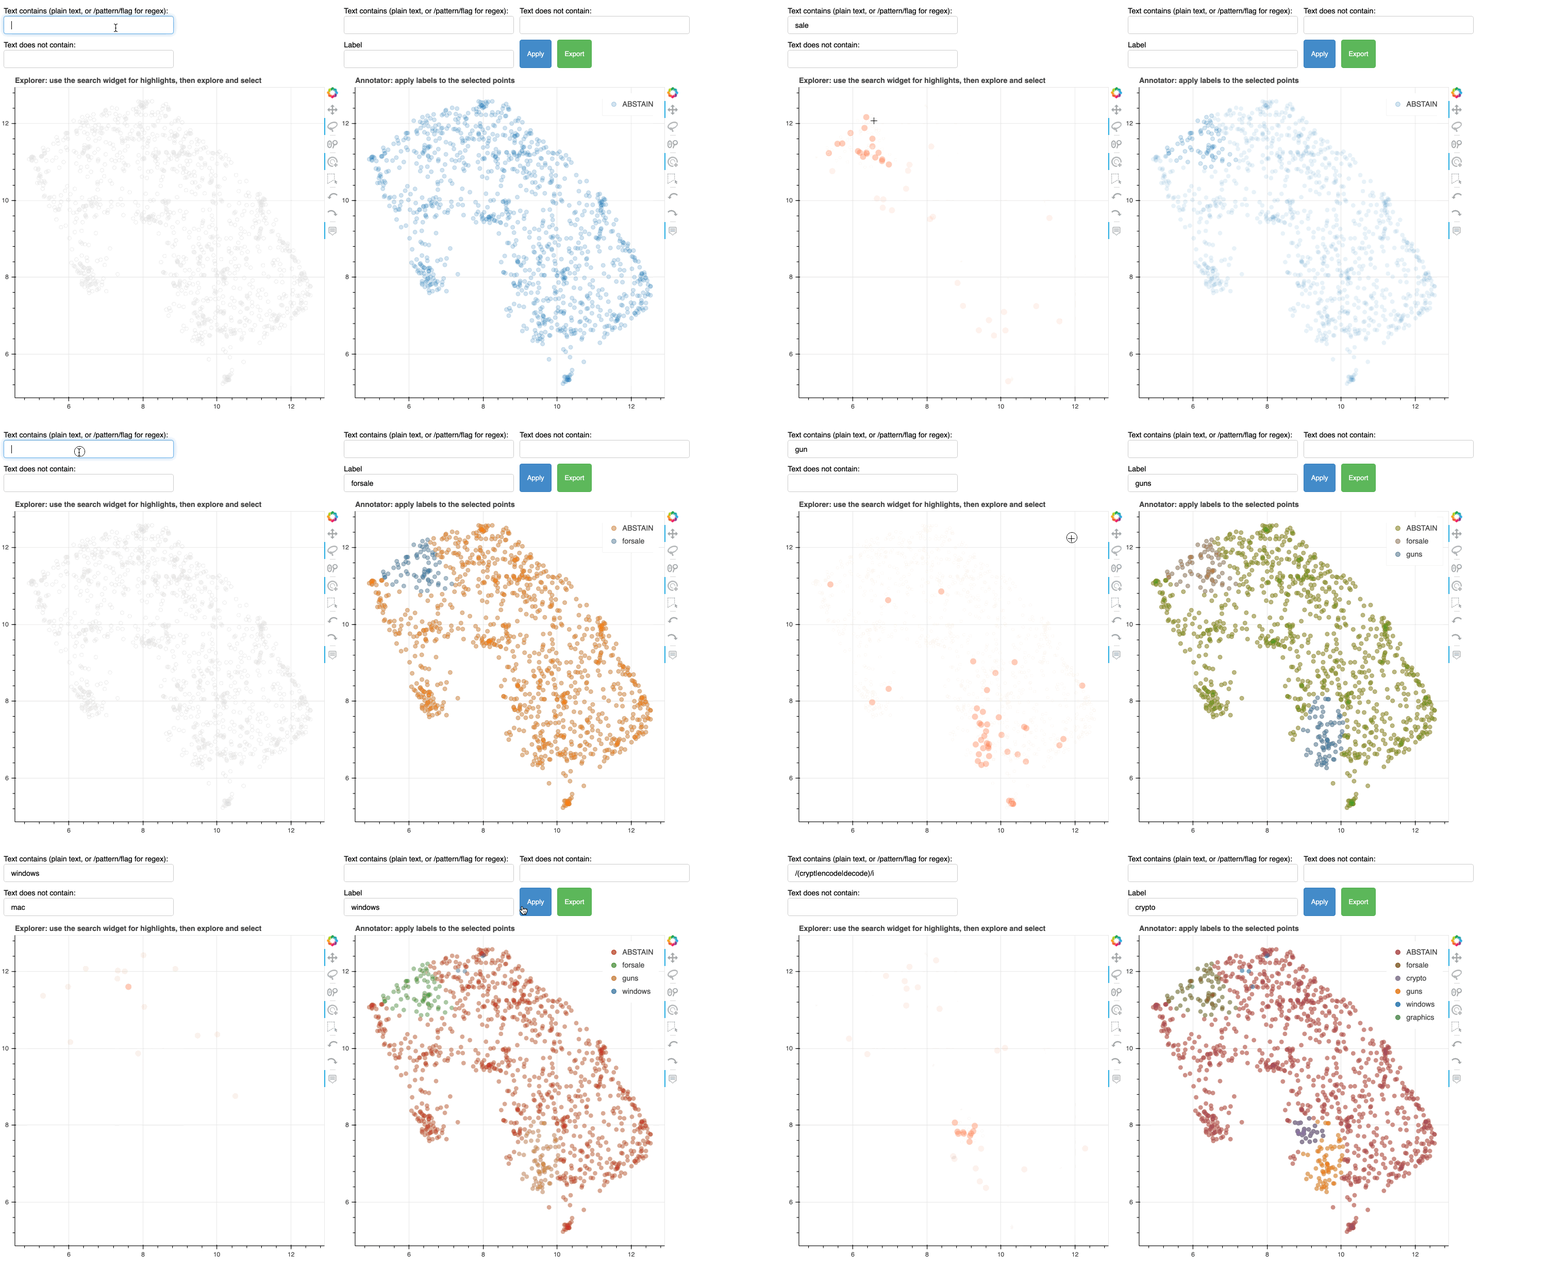
This repository demonstrates the usage of hover to understand and supervise a machine learning task.
Hover Example Apps (works out-of-the-box on Binder) This repository demonstrates the usage of hover to understand and supervise a machine learning tas

Personal IMDB Graphs with Bokeh
Personal IMDB Graphs with Bokeh Do you like watching movies and also rate all of them in IMDB? Would you like to look at your IMDB stats based on your
Simple HTML and PDF document generator for Python - with built-in support for popular data analysis and plotting libraries.
Esparto is a simple HTML and PDF document generator for Python. Its primary use is for generating shareable single page reports with content from popular analytics and data science libraries.

Python library that makes it easy for data scientists to create charts.
Chartify Chartify is a Python library that makes it easy for data scientists to create charts. Why use Chartify? Consistent input data format: Spend l

Bokeh Plotting Backend for Pandas and GeoPandas
Pandas-Bokeh provides a Bokeh plotting backend for Pandas, GeoPandas and Pyspark DataFrames, similar to the already existing Visualization feature of

Python library that makes it easy for data scientists to create charts.
Chartify Chartify is a Python library that makes it easy for data scientists to create charts. Why use Chartify? Consistent input data format: Spend l
Interactive Data Visualization in the browser, from Python
Bokeh is an interactive visualization library for modern web browsers. It provides elegant, concise construction of versatile graphics, and affords hi

Bokeh Plotting Backend for Pandas and GeoPandas
Pandas-Bokeh provides a Bokeh plotting backend for Pandas, GeoPandas and Pyspark DataFrames, similar to the already existing Visualization feature of

Python library that makes it easy for data scientists to create charts.
Chartify Chartify is a Python library that makes it easy for data scientists to create charts. Why use Chartify? Consistent input data format: Spend l
Interactive Data Visualization in the browser, from Python
Bokeh is an interactive visualization library for modern web browsers. It provides elegant, concise construction of versatile graphics, and affords hi
Interactive Data Visualization in the browser, from Python
Bokeh is an interactive visualization library for modern web browsers. It provides elegant, concise construction of versatile graphics, and affords hi