Visualize the bitcoin blockchain from your local node

Overview

Project Overview

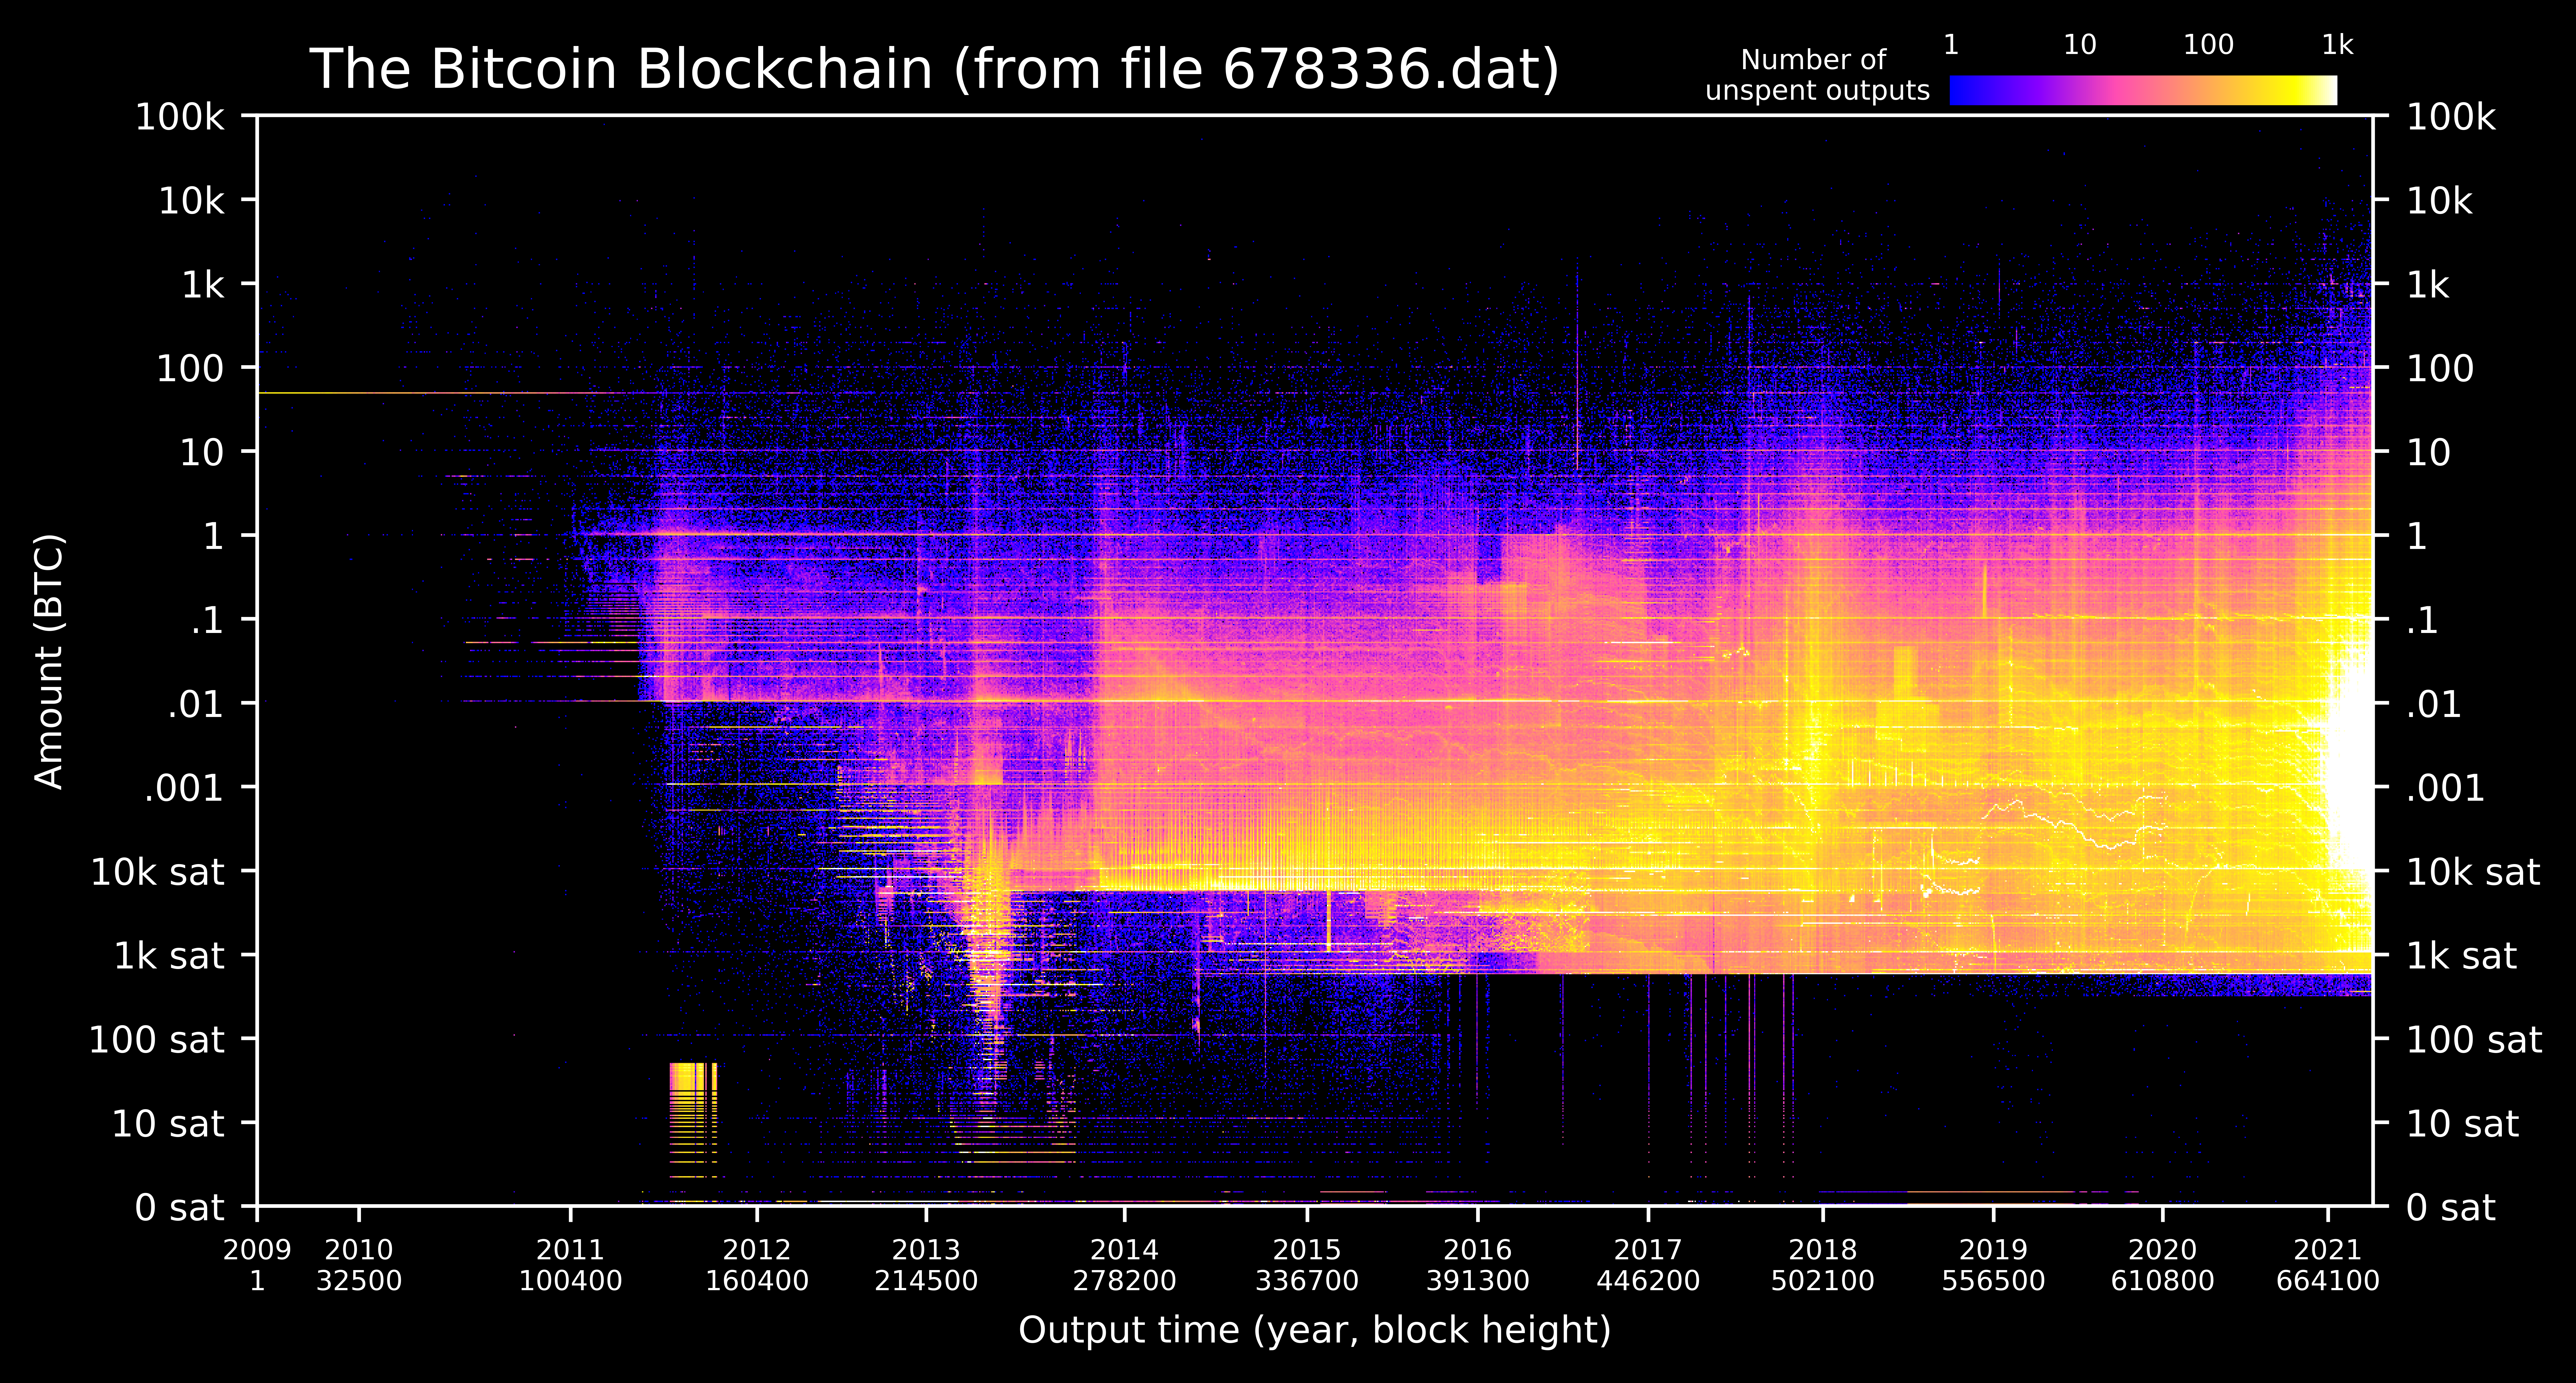
A new feature in Bitcoin Core 0.20 allows users to dump the state of the blockchain (the UTXO set) using the command dumptxoutset. I've written a python script utxo-live.py that takes the ouput of dumptxoutset and generates a heatmap of the blockchain via the UTXO set. Thus all of the active bitcoin in the blockchain is visualized in a single image from your own node.


Logo

Figure description: The heatmap is a two dimensional histogram showing the output date (x-axis), BTC amount (y-axis), and number of unspent outputs (color map) in each histogram bin. The BTC amounts on the y-axis are log scale and there are 100 bins in each log decade (e.g. 100 bins between 1 and 10 BTC). The bin size of output dates is one day. Zooming in to the image usually reveals more detail. A daily updating version of this image is running at utxo.live.

Privacy & Security

With the new dumptxouset command, the python script no longer requires an RPC password to access Core's databases. The script simply reads the dump file without interacting with Core at all. No private keys, passwords, xpubs, or wallet addresses are exchanged between Core and the python script.

Requirements

  • Bitcoin Core version 0.20 or higher
  • Python3 (comes standard on all operating systems)

Instructions for experienced users

  • Create a folder called utxo-live in a familiar location
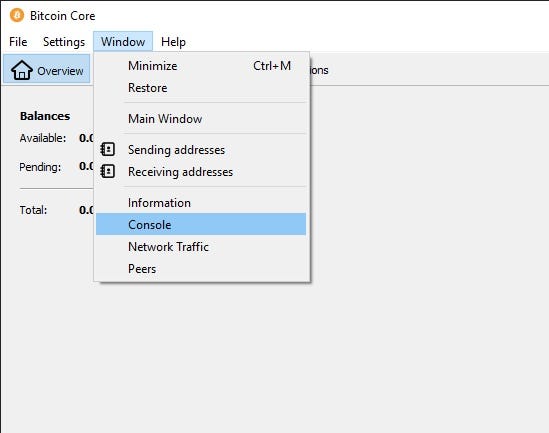
  • Dump the utxo set bitcoin-cli dumptxoutset /xxxxxx.dat where xxxxxxx is the current block height (10-20 min) (Note: bitcoin-cli doesn't ship with Core on Mac OS, use Window->Console instead)
  • Install two python dependencies python3 -m pip install numpy matplotlib
  • Download utxo-live.py to your utxo-live folder and run it python3 utxo-live.py (20 min)

Step by step instructions

  1. Make sure Bitcoin Core (version 0.20 or higher) is running and synchronized.

  2. Create a new folder called utxo-live in a familiar location on your machine (e.g. in your Documents folder).

  3. Open a terminal window and display the current folder path. Do this by:

  • Windows: open a terminal (Start -> Command Prompt) and type:
echo %cd%
  • Mac/Linux: open a terminal (Mac: Applications -> Utilities -> Terminal) and type:
pwd
  1. Navigate to the utxo-live folder using the change directory cd command. For example if you're currently in Users/Steve/ (or on Windows C:\Users\Steve\) and you've created the folder Steve/Documents/bitcoin-tools/utxo-live/ then type:
cd Document/bitcoin-tools/utxo-live/

Note: Windows sometimes requires forward slashes / instead of back slashes \.

  1. Again display the current folder (Step 3) and copy to your clipboard the full path to the utxo-live folder. We will be pasting this path into Bitcoin Core soon.

  2. Leave the terminal window momentarily, and open the Bitcoin Core console window. (Alternatively for bitcoin-cli users, open another terminal window and type the console commands in the next steps as bitcoin-cli commands.)

Open Console Pic

  1. Get the current block count by typing in the console window:
getblockcount

and hitting enter. The output will look like:

  1. Dump the current utxo set by typing in the console window:
  dumptxoutset <PATH to utxo-live>/<xxxxxx.dat>

where is copy-pasted from Step 5, and is the block count. For example if the block count is 678505, the command (for my path) is:

  dumptxoutset /Users/Steve/Documents/bitcoin-tools/utxo-live/678505.dat

If there are no error messages after hitting enter, then it's working. It will take 10-20 minutes. Look in your utxo-live folder and you should see the file being created as xxxxxx.dat.incomplete.

  1. While the utxo file is dumping, download utxo-live.py and install two python dependencies. To do this:
  • Right click on utxo-live.py, choose "Save Link As" and select the utxo-live folder.

  • In the terminal window (not the Bitcoin console), type the following command to install two python dependencies:

  python3 -m pip install numpy matplotlib

Note: you might already have these installed, but running the command won't hurt anything.

  1. If 10-20 minutes have passed, check that the utxo dump is completed. Do this in two ways:
  • Check that the file no longer has .incomplete after xxxxxx.dat
  • Check that the Bitcoin Core console displays the results of the dump as something like:

  1. If the dump file is finished and Step 9 is completed (utxo-live.py is downloaded and python dependencies were installed), then run utxo-live.py by typing in the terminal:
  python3 utxo-live.py
  1. The program will take 20-30 minutes to complete and it will update you on the progress. If there are multiple xxxxxxx.dat files in the folder, it will ask you which one you'd like to process. When finished the image is stored in the folder as utxo_heatmap_xxxxxx.png.

Acknowledgements

I'm indebted to three main projects for the code, understanding, and inspiration for this project. The python functions that parse and decode the utxo dump file were adapted from Bitcoin_Tools. I learned how Core serializes utxos from Bitcoin-UTXO-Dump . An inspiring project that visualizes changes in the UTXO set as a movie is BitcoinUtxoVisualizer .
You might also like...
This is  a web application to visualize various famous technical indicators and stocks tickers from user
This is a web application to visualize various famous technical indicators and stocks tickers from user

Visualizing Technical Indicators Using Python and Plotly. Currently facing issues hosting the application on heroku. As soon as I am able to I'll like

Visualize the training curve from the *.csv file (tensorboard format).

Training-Curve-Vis Visualize the training curve from the *.csv file (tensorboard format). Feature Custom labels Curve smoothing Support for multiple c

Python package to Create, Read, Write, Edit, and Visualize GSFLOW models

pygsflow pyGSFLOW is a python package to Create, Read, Write, Edit, and Visualize GSFLOW models API Documentation pyGSFLOW API documentation can be fo

A small collection of tools made by me, that you can use to visualize atomic orbitals in both 2D and 3D in different aspects.

Orbitals in Python A small collection of tools made by me, that you can use to visualize atomic orbitals in both 2D and 3D in different aspects, and o

 Flame Graphs visualize profiled code
Flame Graphs visualize profiled code

Flame Graphs visualize profiled code

Visualize data of Vietnam's regions with interactive maps.

Plotting Vietnam Development Map This is my personal project that I use plotly to analyse and visualize data of Vietnam's regions with interactive map

Minimalistic tool to visualize how the routes to a given target domain change over time, feat. Python 3.10 & mermaid.js

Minimalistic tool to visualize how the routes to a given target domain change over time, feat. Python 3.10 & mermaid.js

 Epagneul is a tool to visualize and investigate windows event logs
Epagneul is a tool to visualize and investigate windows event logs

epagneul Epagneul is a tool to visualize and investigate windows event logs. Dep

This project is an Algorithm Visualizer where a user can visualize algorithms like Bubble Sort, Merge Sort, Quick Sort, Selection Sort, Linear Search and Binary Search.

Algo_Visualizer This project is an Algorithm Visualizer where a user can visualize common algorithms like "Bubble Sort", "Merge Sort", "Quick Sort", "

Owner
null
Visualize your pandas data with one-line code

PandasEcharts 简介 基于pandas和pyecharts的可视化工具 安装 pip 安装 $ pip install pandasecharts 源码安装 $ git clone https://github.com/gamersover/pandasecharts $ cd pand

陈华杰 2 Apr 13, 2022
Visualize and compare datasets, target values and associations, with one line of code.

In-depth EDA (target analysis, comparison, feature analysis, correlation) in two lines of code! Sweetviz is an open-source Python library that generat

Francois Bertrand 2.3k Jan 5, 2023
Automatically Visualize any dataset, any size with a single line of code. Created by Ram Seshadri. Collaborators Welcome. Permission Granted upon Request.

AutoViz Automatically Visualize any dataset, any size with a single line of code. AutoViz performs automatic visualization of any dataset with one lin

AutoViz and Auto_ViML 1k Jan 2, 2023
Visualize and compare datasets, target values and associations, with one line of code.

In-depth EDA (target analysis, comparison, feature analysis, correlation) in two lines of code! Sweetviz is an open-source Python library that generat

Francois Bertrand 1.2k Feb 18, 2021
Automatically Visualize any dataset, any size with a single line of code. Created by Ram Seshadri. Collaborators Welcome. Permission Granted upon Request.

AutoViz Automatically Visualize any dataset, any size with a single line of code. AutoViz performs automatic visualization of any dataset with one lin

AutoViz and Auto_ViML 299 Feb 13, 2021
Generate graphs with NetworkX, natively visualize with D3.js and pywebview

webview_d3 This is some PoC code to render graphs created with NetworkX natively using D3.js and pywebview. The main benifit of this approac

byt3bl33d3r 68 Aug 18, 2022
Visualize tensors in a plain Python REPL using Sparklines

Visualize tensors in a plain Python REPL using Sparklines

Shawn Presser 43 Sep 3, 2022
Import, visualize, and analyze SpiderFoot OSINT data in Neo4j, a graph database

SpiderFoot Neo4j Tools Import, visualize, and analyze SpiderFoot OSINT data in Neo4j, a graph database Step 1: Installation NOTE: This installs the sf

Black Lantern Security 42 Dec 26, 2022
Extract and visualize information from Gurobi log files

GRBlogtools Extract information from Gurobi log files and generate pandas DataFrames or Excel worksheets for further processing. Also includes a wrapp

Gurobi Optimization 56 Nov 17, 2022
A gui application to visualize various sorting algorithms using pure python.

Sorting Algorithm Visualizer A gui application to visualize various sorting algorithms using pure python. Language : Python 3 Libraries required Tkint

Rajarshi Banerjee 19 Nov 30, 2022