Fast scatter density plots for Matplotlib

Overview

Azure Status Coverage Status

About

Plotting millions of points can be slow. Real slow... 😴

So why not use density maps?

The mpl-scatter-density mini-package provides functionality to make it easy to make your own scatter density maps, both for interactive and non-interactive use. Fast. The following animation shows real-time interactive use with 10 million points, but interactive performance is still good even with 100 million points (and more if you have enough RAM).

Demo of mpl-scatter-density with NY taxi data

When panning, the density map is shown at a lower resolution to keep things responsive (though this is customizable).

To install, simply do:

pip install mpl-scatter-density

This package requires Numpy, Matplotlib, and fast-histogram - these will be installed by pip if they are missing. Both Python 2.7 and Python 3.x are supported, and the package should work correctly on Linux, MacOS X, and Windows.

Usage

There are two main ways to use mpl-scatter-density, both of which are explained below.

scatter_density method

The easiest way to use this package is to simply import mpl_scatter_density, then create Matplotlib axes as usual but adding a projection='scatter_density' option (if your reaction is 'wait, what?', see here). This will return a ScatterDensityAxes instance that has a scatter_density method in addition to all the usual methods (scatter, plot, etc.).

import numpy as np
import mpl_scatter_density
import matplotlib.pyplot as plt

# Generate fake data

N = 10000000
x = np.random.normal(4, 2, N)
y = np.random.normal(3, 1, N)

# Make the plot - note that for the projection option to work, the
# mpl_scatter_density module has to be imported above.

fig = plt.figure()
ax = fig.add_subplot(1, 1, 1, projection='scatter_density')
ax.scatter_density(x, y)
ax.set_xlim(-5, 10)
ax.set_ylim(-5, 10)
fig.savefig('gaussian.png')

Which gives:

Result from the example script

The scatter_density method takes the same options as imshow (for example cmap, alpha, norm, etc.), but also takes the following optional arguments:

  • dpi: this is an integer that is used to determine the resolution of the density map. By default, this is 72, but you can change it as needed, or set it to None to use the default for the Matplotlib backend you are using.
  • downres_factor: this is an integer that is used to determine how much to downsample the density map when panning in interactive mode. Set this to 1 if you don't want any downsampling.
  • color: this can be set to any valid matplotlib color, and will be used to automatically make a monochromatic colormap based on this color. The colormap will fade to transparent, which means that this mode is ideal when showing multiple density maps together.

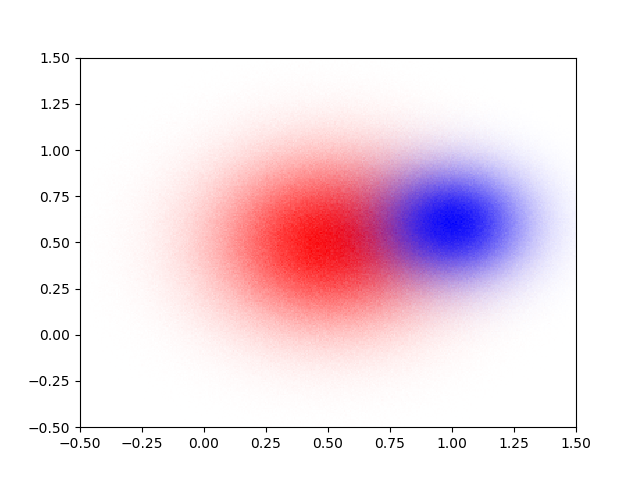
Here is an example of using the color option:

import numpy as np
import matplotlib.pyplot as plt
import mpl_scatter_density  # noqa

fig = plt.figure()
ax = fig.add_subplot(1, 1, 1, projection='scatter_density')

n = 10000000

x = np.random.normal(0.5, 0.3, n)
y = np.random.normal(0.5, 0.3, n)

ax.scatter_density(x, y, color='red')

x = np.random.normal(1.0, 0.2, n)
y = np.random.normal(0.6, 0.2, n)

ax.scatter_density(x, y, color='blue')

ax.set_xlim(-0.5, 1.5)
ax.set_ylim(-0.5, 1.5)

fig.savefig('double.png')

Which produces the following output:

Result from the example script

ScatterDensityArtist

If you are a more experienced Matplotlib user, you might want to use the ScatterDensityArtist directly (this is used behind the scenes in the above example). To use this, initialize the ScatterDensityArtist with the axes as first argument, followed by any arguments you would have passed to scatter_density above (you can also take a look at the docstring for ScatterDensityArtist). You should then add the artist to the axes:

from mpl_scatter_density import ScatterDensityArtist
a = ScatterDensityArtist(ax, x, y)
ax.add_artist(a)

Advanced

Non-linear stretches for high dynamic range plots

In some cases, your density map might have a high dynamic range, and you might therefore want to show the log of the counts rather than the counts. You can do this by passing a matplotlib.colors.Normalize object to the norm argument in the same wasy as for imshow. For example, the astropy package includes a nice framework for making such a Normalize object for different functions. The following example shows how to show the density map on a log scale:

import numpy as np
import mpl_scatter_density
import matplotlib.pyplot as plt

# Make the norm object to define the image stretch
from astropy.visualization import LogStretch
from astropy.visualization.mpl_normalize import ImageNormalize
norm = ImageNormalize(vmin=0., vmax=1000, stretch=LogStretch())

N = 10000000
x = np.random.normal(4, 2, N)
y = np.random.normal(3, 1, N)

fig = plt.figure()
ax = fig.add_subplot(1, 1, 1, projection='scatter_density')
ax.scatter_density(x, y, norm=norm)
ax.set_xlim(-5, 10)
ax.set_ylim(-5, 10)
fig.savefig('gaussian_log.png')

Which produces the following output:

Result from the example script

Adding a colorbar

You can show a colorbar in the same way as you would for an image - the following example shows how to do it:

import numpy as np
import mpl_scatter_density
import matplotlib.pyplot as plt

N = 10000000
x = np.random.normal(4, 2, N)
y = np.random.normal(3, 1, N)

fig = plt.figure()
ax = fig.add_subplot(1, 1, 1, projection='scatter_density')
density = ax.scatter_density(x, y)
ax.set_xlim(-5, 10)
ax.set_ylim(-5, 10)
fig.colorbar(density, label='Number of points per pixel')
fig.savefig('gaussian_colorbar.png')

Which produces the following output:

Result from the example script

Color-coding 'markers' with individual values

In the same way that a 1-D array of values can be passed to Matplotlib's scatter function/method, a 1-D array of values can be passed to scatter_density using the c= argument:

import numpy as np
import mpl_scatter_density
import matplotlib.pyplot as plt

N = 10000000
x = np.random.normal(4, 2, N)
y = np.random.normal(3, 1, N)
c = x - y + np.random.normal(0, 5, N)

fig = plt.figure()
ax = fig.add_subplot(1, 1, 1, projection='scatter_density')
ax.scatter_density(x, y, c=c, vmin=-10, vmax=+10, cmap=plt.cm.RdYlBu)
ax.set_xlim(-5, 13)
ax.set_ylim(-5, 11)
fig.savefig('gaussian_color_coded.png')

Which produces the following output:

Result from the example script

Note that to keep performance as good as possible, the values from the c attribute are averaged inside each pixel of the density map, then the colormap is applied. This is a little different to what scatter would converge to in the limit of many points (since in that case it would apply the color to all the markers than average the colors).

Q&A

Isn't this basically the same as datashader?

This follows the same ideas as datashader, but the aim of mpl-scatter-density is specifically to bring datashader-like functionality to Matplotlib users. Furthermore, mpl-scatter-density is intended to be very easy to install - for example it can be installed with pip. But if you have datashader installed and regularly use bokeh, mpl-scatter-density won't do much for you. Note that if you are interested in datashader and Matplotlib together, there is a work in progress (pull request) by @tacaswell to create a Matplotlib artist similar to that in this package but powered by datashader.

What about vaex?

Vaex is a powerful package to visualize large datasets on N-dimensional grids, and therefore has some functionality that overlaps with what is here. However, the aim of mpl-scatter-density is just to provide a lightweight solution to make it easy for users already using Matplotlib to add scatter density maps to their plots rather than provide a complete environment for data visualization. I highly recommend that you take a look at Vaex and determine which approach is right for you!

Why on earth have you defined scatter_density as a projection?

If you are a Matplotlib developer: I truly am sorry for distorting the intended purpose of projection 😊 . But you have to admit that it's a pretty convenient way to have users get a custom Axes sub-class even if it has nothing to do with actual projection!

Where do you see this going?

There are a number of things we could add to this package, for example a way to plot density maps as contours, or a way to color code each point by a third quantity and have that reflected in the density map. If you have ideas, please open issues, and even better contribute a pull request! 😄

Can I contribute?

I'm glad you asked - of course you are very welcome to contribute! If you have some ideas, you can open issues or create a pull request directly. Even if you don't have time to contribute actual code changes, I would love to hear from you if you are having issues using this package.

[![Build Status](https://dev.azure.com/thomasrobitaille/mpl-scatter-density/_apis/build/status/astrofrog.mpl-scatter-density?branchName=master)](https://dev.azure.com/thomasrobitaille/mpl-scatter-density/_build/latest?definitionId=17&branchName=master)

Running tests

To run the tests, you will need pytest and the pytest-mpl plugin. You can then run the tests with:

pytest mpl_scatter_density --mpl
Comments
  • Change resolution when resizing window

    Change resolution when resizing window

    This is a WIP. Remaining to-dos:

    • [x] Figure out how to avoid segfault on MacOS X backend: https://github.com/matplotlib/matplotlib/issues/9655
    • [x] Only set up this behavior for an interactive backend
    enhancements 
    opened by astrofrog 4
  • Examples do not work in the jupyter notebook

    Examples do not work in the jupyter notebook

    Very interesting mini module. Thank you for this.

    Examples do not appear to work in the jupyter notebook. I had no problem executing them in the ipython shell

    Here is the traceback (Jupyter 5.0.0, python 3.6.1, ipython 5.3.0):

    ---------------------------------------------------------------------------
    TypeError                                 Traceback (most recent call last)
    /usr/lib/python3.6/site-packages/IPython/core/formatters.py in __call__(self, obj)
        305                 pass
        306             else:
    --> 307                 return printer(obj)
        308             # Finally look for special method names
        309             method = get_real_method(obj, self.print_method)
    
    /usr/lib/python3.6/site-packages/IPython/core/pylabtools.py in <lambda>(fig)
        238 
        239     if 'png' in formats:
    --> 240         png_formatter.for_type(Figure, lambda fig: print_figure(fig, 'png', **kwargs))
        241     if 'retina' in formats or 'png2x' in formats:
        242         png_formatter.for_type(Figure, lambda fig: retina_figure(fig, **kwargs))
    
    /usr/lib/python3.6/site-packages/IPython/core/pylabtools.py in print_figure(fig, fmt, bbox_inches, **kwargs)
        122 
        123     bytes_io = BytesIO()
    --> 124     fig.canvas.print_figure(bytes_io, **kw)
        125     data = bytes_io.getvalue()
        126     if fmt == 'svg':
    
    /usr/lib/python3.6/site-packages/matplotlib/backend_bases.py in print_figure(self, filename, dpi, facecolor, edgecolor, orientation, format, **kwargs)
       2208                 bbox_filtered = []
       2209                 for a in bbox_artists:
    -> 2210                     bbox = a.get_window_extent(renderer)
       2211                     if a.get_clip_on():
       2212                         clip_box = a.get_clip_box()
    
    /usr/lib/python3.6/site-packages/matplotlib/image.py in get_window_extent(self, renderer)
        755 
        756     def get_window_extent(self, renderer=None):
    --> 757         x0, x1, y0, y1 = self._extent
        758         bbox = Bbox.from_extents([x0, y0, x1, y1])
        759         return bbox.transformed(self.axes.transData)
    
    TypeError: 'NoneType' object is not iterable
    
    bug 
    opened by lbignone 4
  • matplotlib markers?

    matplotlib markers?

    Have you considered using markers for this? Replacing the rasterized scatter calls in example.py with:

    ax.plot(x, y, '+', markersize=2, markeredgecolor='red', antialiased=False)

    runs in about 2.1s, on my machine. rasterized_scatter runs in about 1.9s, so it is slightly faster, but not by much.

    The interactive performance of matplotlib markers is actually better because it isn't reallocating an image buffer on each pan and zoom.

    About the only time to use scatter over marker is when the size of the symbol changes with each instance.

    If rasterized output in the file is what you want, you can call "set_rasterized(True)" on the Line2D objects.

    opened by mdboom 4
  • Adaptable density vmin/vmax functions

    Adaptable density vmin/vmax functions

    I propose a small change, where the constructor of the GenericDensityArtist accepts the 'density_vmin', and 'density_vmax' arguments. These then set:

    self._density_vmin = density_vmin
    self._density_vmax = density_vmax
    

    they have the default values of np.nanmin and np.nanmax, as is hardcoded at the moment.

    I, for example, pass the following values for vmin and vmax:

    density_vmin = 0
    density_vmax = vmax_function
    

    where:

    def vmax_function(array):
        from astropy.stats import sigma_clip
        masked_array = sigma_clip(array[array != 0], sigma=4.0)
        values = masked_array.compressed()
        return np.nanmax(values)
    

    I did this because some datasets were invisible with the standard min and max interval, perhaps because of outliers in the density.

    opened by samverstocken 2
  • Add update_while_panning option

    Add update_while_panning option

    Add compute_on_pan to control whether to compute histograms even when panning, and histogram2d_callable to override the default fast-histogram computation.

    enhancements 
    opened by astrofrog 2
  • Downsample when resizing plot window

    Downsample when resizing plot window

    It would be nice to downsample in cases where an interactive window is resized. The issue is that there is no such thing as a 'start resize' and 'end resize' events in matplotlib, so instead we may have to have some kind of timer that gets started on resize events and gets reset at every resize event, and if the timer gets to the pre-defined time (e.g. 0.5 seconds) without another resize event, then the data is upsampled again.

    enhancements 
    opened by astrofrog 2
  • AttributeError: 'NoneType' object has no attribute 'vmin'

    AttributeError: 'NoneType' object has no attribute 'vmin'

    Hi there, the library looks awesome, but was getting error even when using the simple example:

    Jupyter Lab Matplotlib version: 3.3.0 Python version: 3.8.3 Windows 10

    Will be trying out different versions of Python / Matplotlib to see if the error occurs

    import numpy as np
    import mpl_scatter_density
    import matplotlib.pyplot as plt
    
    N = 10000000
    x = np.random.normal(4, 2, N)
    y = np.random.normal(3, 1, N)
    
    fig = plt.figure()
    ax = fig.add_subplot(1, 1, 1, projection='scatter_density')
    density = ax.scatter_density(x, y)
    ax.set_xlim(-5, 10)
    ax.set_ylim(-5, 10)
    fig.colorbar(density, label='Number of points per pixel')
    fig.savefig('gaussian_colorbar.png')
    

    Error:

    ---------------------------------------------------------------------------
    AttributeError                            Traceback (most recent call last)
    <ipython-input-18-7c56861efce8> in <module>
         10 fig = plt.figure()
         11 ax = fig.add_subplot(1, 1, 1, projection='scatter_density')
    ---> 12 density = ax.scatter_density(x, y)
         13 ax.set_xlim(-5, 10)
         14 ax.set_ylim(-5, 10)
    
    ~\.conda\envs\TestPythonProject\lib\site-packages\mpl_scatter_density\scatter_density_axes.py in scatter_density(self, x, y, dpi, downres_factor, color, cmap, alpha, norm, **kwargs)
         51         self.set_ylim(np.min(y), np.max(y))
         52 
    ---> 53         scatter = ScatterDensityArtist(self, x, y, dpi=dpi, downres_factor=downres_factor,
         54                                        color=color, cmap=cmap,
         55                                        alpha=alpha, norm=norm, **kwargs)
    
    ~\.conda\envs\TestPythonProject\lib\site-packages\mpl_scatter_density\scatter_density_artist.py in __init__(self, ax, x, y, downres_factor, c, **kwargs)
         56     def __init__(self, ax, x, y, downres_factor=4, c=None, **kwargs):
         57         self.histogram2d_helper = FixedDataDensityHelper(ax, x, y, c=c, downres_factor=downres_factor)
    ---> 58         super(ScatterDensityArtist, self).__init__(ax, histogram2d_func=self.histogram2d_helper, **kwargs)
         59 
         60     def set_xy(self, x, y):
    
    ~\.conda\envs\TestPythonProject\lib\site-packages\mpl_scatter_density\generic_density_artist.py in __init__(self, ax, dpi, color, vmin, vmax, norm, histogram2d_func, update_while_panning, **kwargs)
         54         self._density_vmax = np.nanmax
         55 
    ---> 56         super(GenericDensityArtist, self).__init__(ax, array_func=histogram2d_func, dpi=dpi, update_while_panning=update_while_panning, **kwargs)
         57 
         58         if color is not None:
    
    ~\.conda\envs\TestPythonProject\lib\site-packages\mpl_scatter_density\base_image_artist.py in __init__(self, ax, dpi, array_func, update_while_panning, **kwargs)
         54     def __init__(self, ax, dpi=72, array_func=None, update_while_panning=True, **kwargs):
         55 
    ---> 56         super(BaseImageArtist, self).__init__(ax, **kwargs)
         57 
         58         self._array_func = array_func
    
    ~\.conda\envs\TestPythonProject\lib\site-packages\matplotlib\image.py in __init__(self, ax, cmap, norm, interpolation, origin, extent, filternorm, filterrad, resample, **kwargs)
        895         self._extent = extent
        896 
    --> 897         super().__init__(
        898             ax,
        899             cmap=cmap,
    
    ~\.conda\envs\TestPythonProject\lib\site-packages\matplotlib\image.py in __init__(self, ax, cmap, norm, interpolation, origin, filternorm, filterrad, resample, **kwargs)
        242                  ):
        243         martist.Artist.__init__(self)
    --> 244         cm.ScalarMappable.__init__(self, norm, cmap)
        245         if origin is None:
        246             origin = mpl.rcParams['image.origin']
    
    ~\.conda\envs\TestPythonProject\lib\site-packages\matplotlib\cm.py in __init__(self, norm, cmap)
        232         self._A = None
        233         self.norm = None  # So that the setter knows we're initializing.
    --> 234         self.set_norm(norm)  # The Normalize instance of this ScalarMappable.
        235         self.cmap = None  # So that the setter knows we're initializing.
        236         self.set_cmap(cmap)  # The Colormap instance of this ScalarMappable.
    
    ~\.conda\envs\TestPythonProject\lib\site-packages\mpl_scatter_density\generic_density_artist.py in set_norm(self, norm)
         89 
         90     def set_norm(self, norm):
    ---> 91         if norm.vmin is not None:
         92             self._density_vmin = norm.vmin
         93         if norm.vmax is not None:
    
    AttributeError: 'NoneType' object has no attribute 'vmin'
    
    opened by NicksonYap 1
  • Make it possible to specify a color for each marker based on a third value

    Make it possible to specify a color for each marker based on a third value

    Matplotlib's scatter method allows one to pass a c= argument which takes an array of values that is then mapped to color via a colormap. We could so something similar here. I think this could be done as follows:

    • Implement support for weights in fast-histogram
    • Call the histogram with c as the weights
    • Map the result with the specified colormap

    This is an approximation - in practice there's no reason that the average color in a pixel would be the color of the average, but the above is by far the fastest way to do this.

    enhancements 
    opened by astrofrog 1
  • Is it possible to parser change marker size?

    Is it possible to parser change marker size?

    I encountered the following error when parsing markersize:

    ---------------------------------------------------------------------------
    AttributeError                            Traceback (most recent call last)
    <ipython-input-8-cfa7c3067ad6> in <module>
         14 fig = plt.figure(figsize=(8, 6), dpi=100)
         15 ax = fig.add_subplot(1, 1, 1, projection="scatter_density")
    ---> 16 density = ax.scatter_density(y_hat, y, cmap=white_viridis, markersize=10)
         17 fig.colorbar(density, label='Number of points per pixel')
         18 ax.grid()
    
    ~/miniconda3/envs/yields/lib/python3.6/site-packages/mpl_scatter_density/scatter_density_axes.py in scatter_density(self, x, y, dpi, downres_factor, color, cmap, alpha, norm, **kwargs)
         51         scatter = ScatterDensityArtist(self, x, y, dpi=dpi, downres_factor=downres_factor,
         52                                        color=color, cmap=cmap,
    ---> 53                                        alpha=alpha, norm=norm, **kwargs)
         54         self.add_artist(scatter)
         55 
    
    ~/miniconda3/envs/yields/lib/python3.6/site-packages/mpl_scatter_density/scatter_density_artist.py in __init__(self, ax, x, y, downres_factor, c, **kwargs)
         57         super(ScatterDensityArtist, self).__init__(ax,
         58                                                    histogram2d_func=self.histogram2d_helper,
    ---> 59                                                    **kwargs)
         60 
         61     def set_xy(self, x, y):
    
    ~/miniconda3/envs/yields/lib/python3.6/site-packages/mpl_scatter_density/generic_density_artist.py in __init__(self, ax, dpi, color, vmin, vmax, norm, histogram2d_func, update_while_panning, **kwargs)
         57                                                    dpi=dpi,
         58                                                    update_while_panning=update_while_panning,
    ---> 59                                                    **kwargs)
         60 
         61         if color is not None:
    
    ~/miniconda3/envs/yields/lib/python3.6/site-packages/mpl_scatter_density/base_image_artist.py in __init__(self, ax, dpi, array_func, update_while_panning, **kwargs)
         52     def __init__(self, ax, dpi=72, array_func=None, update_while_panning=True, **kwargs):
         53 
    ---> 54         super(BaseImageArtist, self).__init__(ax, **kwargs)
         55 
         56         self._array_func = array_func
    
    ~/miniconda3/envs/yields/lib/python3.6/site-packages/matplotlib/image.py in __init__(self, ax, cmap, norm, interpolation, origin, extent, filternorm, filterrad, resample, **kwargs)
        897             filterrad=filterrad,
        898             resample=resample,
    --> 899             **kwargs
        900         )
        901 
    
    ~/miniconda3/envs/yields/lib/python3.6/site-packages/matplotlib/image.py in __init__(self, ax, cmap, norm, interpolation, origin, filternorm, filterrad, resample, **kwargs)
        259         self._imcache = None
        260 
    --> 261         self.update(kwargs)
        262 
        263     def __getstate__(self):
    
    ~/miniconda3/envs/yields/lib/python3.6/site-packages/matplotlib/artist.py in update(self, props)
       1004 
       1005         with cbook._setattr_cm(self, eventson=False):
    -> 1006             ret = [_update_property(self, k, v) for k, v in props.items()]
       1007 
       1008         if len(ret):
    
    ~/miniconda3/envs/yields/lib/python3.6/site-packages/matplotlib/artist.py in <listcomp>(.0)
       1004 
       1005         with cbook._setattr_cm(self, eventson=False):
    -> 1006             ret = [_update_property(self, k, v) for k, v in props.items()]
       1007 
       1008         if len(ret):
    
    ~/miniconda3/envs/yields/lib/python3.6/site-packages/matplotlib/artist.py in _update_property(self, k, v)
       1000                 if not callable(func):
       1001                     raise AttributeError('{!r} object has no property {!r}'
    -> 1002                                          .format(type(self).__name__, k))
       1003                 return func(v)
       1004 
    
    AttributeError: 'ScatterDensityArtist' object has no property 'markersize'
    

    The code is like this, where y and y_hat can be replaced by random lists for reproduction purpose:

    from matplotlib.colors import LinearSegmentedColormap
    
    # "Viridis-like" colormap with white background
    white_viridis = LinearSegmentedColormap.from_list('white_viridis', [
        (0, '#ffffff'),
        (1e-20, '#440053'),
        (0.2, '#404388'),
        (0.4, '#2a788e'),
        (0.6, '#21a784'),
        (0.8, '#78d151'),
        (1, '#fde624'),
    ], N=256)
    
    fig = plt.figure(figsize=(8, 6), dpi=100)
    ax = fig.add_subplot(1, 1, 1, projection="scatter_density")
    density = ax.scatter_density(y_hat, y, cmap=white_viridis, markersize=10)
    fig.colorbar(density, label='Number of points per pixel')
    ax.grid()
    ax.set_xlim(0, 100)
    ax.set_ylim(0, 100)
    ax.set_xlabel("Predicted yields(Yield-BERT)")
    ax.set_ylabel("Observed yields")
    

    Thanks!

    opened by LiuCMU 0
  • Spurious(?) all-NaN slice RuntimeWarning

    Spurious(?) all-NaN slice RuntimeWarning

    For example, the first example given in the README (using the 'scatter_density' method) currently emits

    .../lib/python3.9/site-packages/mpl_scatter_density/generic_density_artist.py:77: RuntimeWarning: All-NaN slice encountered
      vmin = self._density_vmin(array)
    .../lib/python3.9/site-packages/mpl_scatter_density/generic_density_artist.py:82: RuntimeWarning: All-NaN slice encountered
      vmax = self._density_vmax(array)
    

    when run with numpy 1.20.1, matplotlib 3.3.0, mpl-scatter-density 0.7.

    opened by anntzer 1
  • Symlog scale does not work with mpl-scatter-density

    Symlog scale does not work with mpl-scatter-density

    Hello, first off thanks for developing such a useful tool.

    I am trying to make a density plot using mpl-scatter-density and rescale the xaxis using the symlog scale. This scale is available with matplotlib but it fails when using mpl-scatter-density.

    I am not sure how to address this issue.

    Thanks

    To reproduce the issue

    fig=plt.figure()

    x=np.linspace(1,10,100)

    ax=fig.add_subplot(1, 1, 1,projection='scatter_density') ax.scatter_density(x,x) ax.set_xscale('symlog')

    error: ValueError: Unexpected xscale: symlog

    opened by fabienpaulot 0
  • Histogram Equalization

    Histogram Equalization

    Hi!

    I was thinking about how one would use histogram equalization stretch instead of logarithmic stretch?

    As far as I can see it needs the data as input but I couldn't figure out how one extracts that from the ScatterDensityArtist object.

    Cheers,

    opened by ChristianMichelsen 0
  • Interpretation of colors with multiple density maps together

    Interpretation of colors with multiple density maps together

    Hi all,

    I was wondering how to interpret the colors when one is plotting multiple density maps together, does anyone know this? Say e.g. the example in the README: multiple density maps

    How does one interpret the color in the middle? Is it possible to quantify the color by a color scale? For example, if there are three blue dots in a pixel and two reds, does that make a purple pixel?

    Thanks a lot!

    Cheers,

    opened by ChristianMichelsen 0
Owner
Thomas Robitaille
Thomas Robitaille
A python package for animating plots build on matplotlib.

animatplot A python package for making interactive as well as animated plots with matplotlib. Requires Python >= 3.5 Matplotlib >= 2.2 (because slider

Tyler Makaro 356 Feb 16, 2021
Painlessly create beautiful matplotlib plots.

Announcement Thank you to everyone who has used prettyplotlib and made it what it is today! Unfortunately, I no longer have the bandwidth to maintain

Olga Botvinnik 1.6k Jan 6, 2023
Easily convert matplotlib plots from Python into interactive Leaflet web maps.

mplleaflet mplleaflet is a Python library that converts a matplotlib plot into a webpage containing a pannable, zoomable Leaflet map. It can also embe

Jacob Wasserman 502 Dec 28, 2022
This package creates clean and beautiful matplotlib plots that work on light and dark backgrounds

This package creates clean and beautiful matplotlib plots that work on light and dark backgrounds. Inspired by the work of Edward Tufte.

Nico Schlömer 205 Jan 7, 2023
MPL Plotter is a Matplotlib based Python plotting library built with the goal of delivering publication-quality plots concisely.

MPL Plotter is a Matplotlib based Python plotting library built with the goal of delivering publication-quality plots concisely.

Antonio López Rivera 162 Nov 11, 2022
The plottify package is makes matplotlib plots more legible

plottify The plottify package is makes matplotlib plots more legible. It's a thin wrapper around matplotlib that automatically adjusts font sizes, sca

Andy Jones 97 Nov 4, 2022
Python implementation of the Density Line Chart by Moritz & Fisher.

PyDLC - Density Line Charts with Python Python implementation of the Density Line Chart (Moritz & Fisher, 2018) to visualize large collections of time

Charles L. Bérubé 10 Jan 6, 2023
ecoglib: visualization and statistics for high density microecog signals

ecoglib: visualization and statistics for high density microecog signals This library contains high-level analysis tools for "topos" and "chronos" asp

null 1 Nov 17, 2021
Make sankey, alluvial and sankey bump plots in ggplot

The goal of ggsankey is to make beautiful sankey, alluvial and sankey bump plots in ggplot2

David Sjoberg 156 Jan 3, 2023
Python scripts to manage Chia plots and drive space, providing full reports. Also monitors the number of chia coins you have.

Chia Plot, Drive Manager & Coin Monitor (V0.5 - April 20th, 2021) Multi Server Chia Plot and Drive Management Solution Be sure to ⭐ my repo so you can

null 338 Nov 25, 2022
Example scripts for generating plots of Bohemian matrices

Bohemian Eigenvalue Plotting Examples This repository contains examples of generating plots of Bohemian eigenvalues. The examples in this repository a

Bohemian Matrices 5 Nov 12, 2022
Moscow DEG 2021 elections plots

Построение графиков на основе публичных данных о ДЭГ в Москве в 2021г. Описание Скрипты в данном репозитории позволяют собственноручно построить графи

null 9 Jul 15, 2022
This plugin plots the time you spent on a tag as a histogram.

This plugin plots the time you spent on a tag as a histogram.

Tom Dörr 7 Sep 9, 2022
A minimal Python package that produces slice plots through h5m DAGMC geometry files

A minimal Python package that produces slice plots through h5m DAGMC geometry files Installation pip install dagmc_geometry_slice_plotter Python API U

Fusion Energy 4 Dec 2, 2022
Generate "Jupiter" plots for circular genomes

jupiter Generate "Jupiter" plots for circular genomes Description Python scripts to generate plots from ViennaRNA output. Written in "pidgin" python w

Robert Edgar 2 Nov 29, 2021
A Python function that makes flower plots.

Flower plot A Python 3.9+ function that makes flower plots. Installation This package requires at least Python 3.9. pip install

Thomas Roder 4 Jun 12, 2022
Standardized plots and visualizations in Python

Standardized plots and visualizations in Python pltviz is a Python package for standardized visualization. Routine and novel plotting approaches are f

Andrew Tavis McAllister 0 Jul 9, 2022
YOPO is an interactive dashboard which generates various standard plots.

YOPO is an interactive dashboard which generates various standard plots.you can create various graphs and charts with a click of a button. This tool uses Dash and Flask in backend.

ADARSH C 38 Dec 20, 2022
This component provides a wrapper to display SHAP plots in Streamlit.

streamlit-shap This component provides a wrapper to display SHAP plots in Streamlit.

Snehan Kekre 30 Dec 10, 2022