Functions for easily making publication-quality figures with matplotlib.

Overview

Data-viz utils ๐Ÿ“ˆ

Functions for data visualization in matplotlib

๐Ÿ“š API

Can be installed using pip install dvu and then imported with import dvu.

You can also just copy the relatively short source code for the functions (easily viewable here).

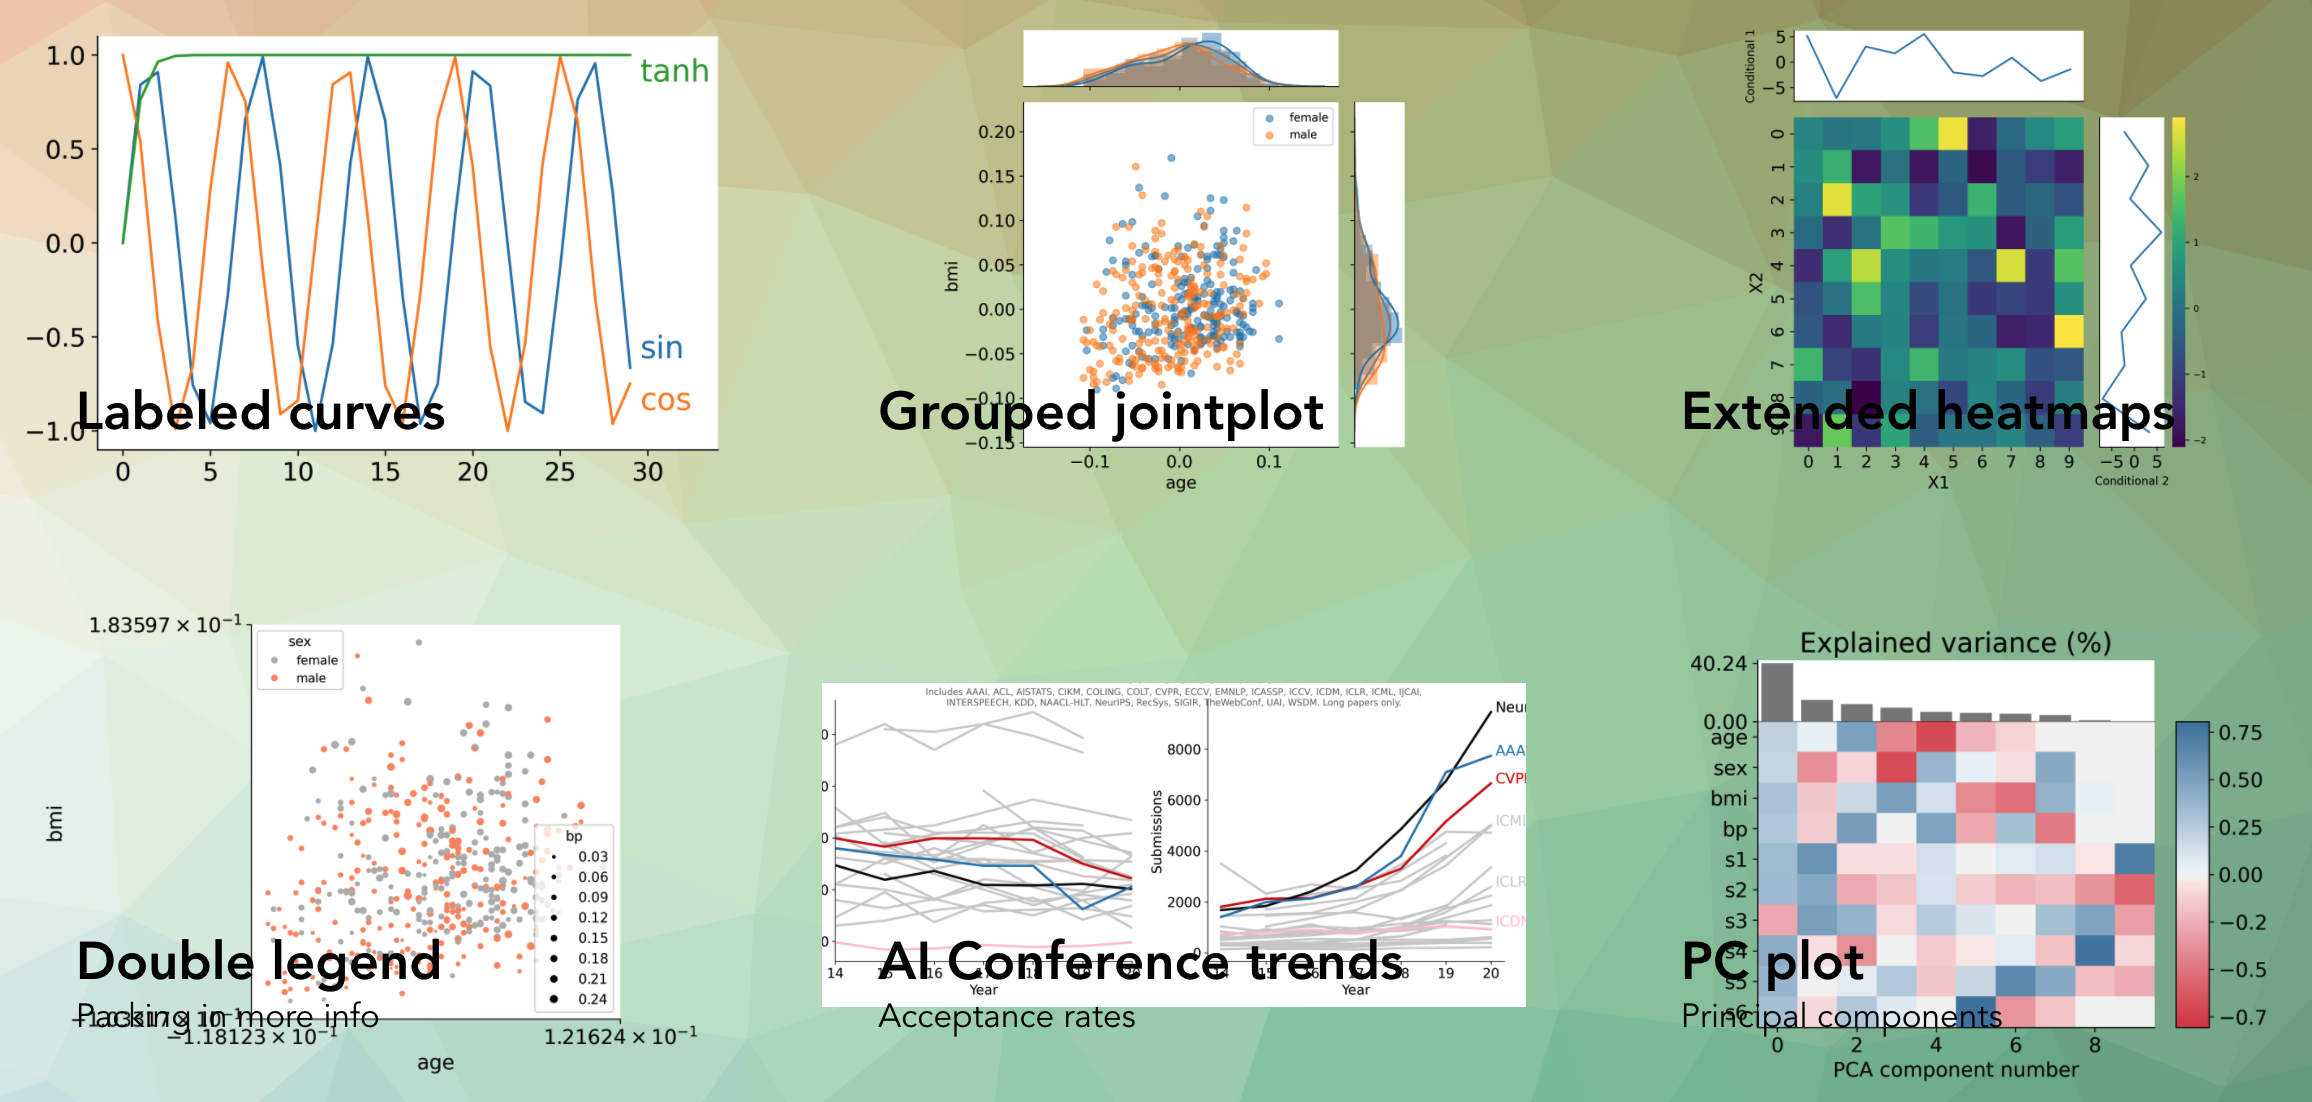
Helps create a bunch of different plots such as these:

One particularly useful function is dvu.line_legend() which replaces a typical matplotlib legend with labels for each line:

Using plt.legend() Using dvu.line_legend()
plt_legend dvu_legend

Another one is dvu.invert_plot() which can be called after generating a plot to invert everything besides the line colors

Original plot After dvu.invert_plot()
plt_legend dvu_legend

Reference

You might also like...
:small_red_triangle: Ternary plotting library for python with matplotlib

python-ternary This is a plotting library for use with matplotlib to make ternary plots plots in the two dimensional simplex projected onto a two dime

Joyplots in Python with matplotlib & pandas :chart_with_upwards_trend:

JoyPy JoyPy is a one-function Python package based on matplotlib + pandas with a single purpose: drawing joyplots (a.k.a. ridgeline plots). The code f

A python package for animating plots build on matplotlib.

animatplot A python package for making interactive as well as animated plots with matplotlib. Requires Python = 3.5 Matplotlib = 2.2 (because slider

matplotlib: plotting with Python

Matplotlib is a comprehensive library for creating static, animated, and interactive visualizations in Python. Check out our home page for more inform

Statistical data visualization using matplotlib

seaborn: statistical data visualization Seaborn is a Python visualization library based on matplotlib. It provides a high-level interface for drawing

:small_red_triangle: Ternary plotting library for python with matplotlib

python-ternary This is a plotting library for use with matplotlib to make ternary plots plots in the two dimensional simplex projected onto a two dime

Joyplots in Python with matplotlib & pandas :chart_with_upwards_trend:

JoyPy JoyPy is a one-function Python package based on matplotlib + pandas with a single purpose: drawing joyplots (a.k.a. ridgeline plots). The code f

A python package for animating plots build on matplotlib.

animatplot A python package for making interactive as well as animated plots with matplotlib. Requires Python = 3.5 Matplotlib = 2.2 (because slider

Painlessly create beautiful matplotlib plots.

Announcement Thank you to everyone who has used prettyplotlib and made it what it is today! Unfortunately, I no longer have the bandwidth to maintain

Owner
Chandan Singh
Working on interpretable machine learning across domains ๐Ÿง โš•๏ธ๐Ÿฆ  Let's do good with models.
Chandan Singh
Matplotlib JOTA style for making figures

Matplotlib JOTA style for making figures This repo has Matplotlib JOTA style to format plots and figures for publications and presentation.

JOTA JORNALISMO 2 May 5, 2022
MPL Plotter is a Matplotlib based Python plotting library built with the goal of delivering publication-quality plots concisely.

MPL Plotter is a Matplotlib based Python plotting library built with the goal of delivering publication-quality plots concisely.

Antonio Lรณpez Rivera 162 Nov 11, 2022
Collection of scripts for making high quality beautiful math-related posters.

Poster Collection of scripts for making high quality beautiful math-related posters. The poster can have as large printing size as 3x2 square feet wit

Nattawut Phetmak 3 Jun 9, 2022
Easily convert matplotlib plots from Python into interactive Leaflet web maps.

mplleaflet mplleaflet is a Python library that converts a matplotlib plot into a webpage containing a pannable, zoomable Leaflet map. It can also embe

Jacob Wasserman 502 Dec 28, 2022
Cartopy - a cartographic python library with matplotlib support

Cartopy is a Python package designed to make drawing maps for data analysis and visualisation easy. Table of contents Overview Get in touch License an

null 1.2k Jan 1, 2023
Statistical data visualization using matplotlib

seaborn: statistical data visualization Seaborn is a Python visualization library based on matplotlib. It provides a high-level interface for drawing

Michael Waskom 10.2k Dec 30, 2022
The windML framework provides an easy-to-use access to wind data sources within the Python world, building upon numpy, scipy, sklearn, and matplotlib. Renewable Wind Energy, Forecasting, Prediction

windml Build status : The importance of wind in smart grids with a large number of renewable energy resources is increasing. With the growing infrastr

Computational Intelligence Group 125 Dec 24, 2022
NorthPitch is a python soccer plotting library that sits on top of Matplotlib

NorthPitch is a python soccer plotting library that sits on top of Matplotlib.

Devin Pleuler 30 Feb 22, 2022
matplotlib: plotting with Python

Matplotlib is a comprehensive library for creating static, animated, and interactive visualizations in Python. Check out our home page for more inform

Matplotlib Developers 16.7k Jan 8, 2023
Statistical data visualization using matplotlib

seaborn: statistical data visualization Seaborn is a Python visualization library based on matplotlib. It provides a high-level interface for drawing

Michael Waskom 8.1k Feb 13, 2021