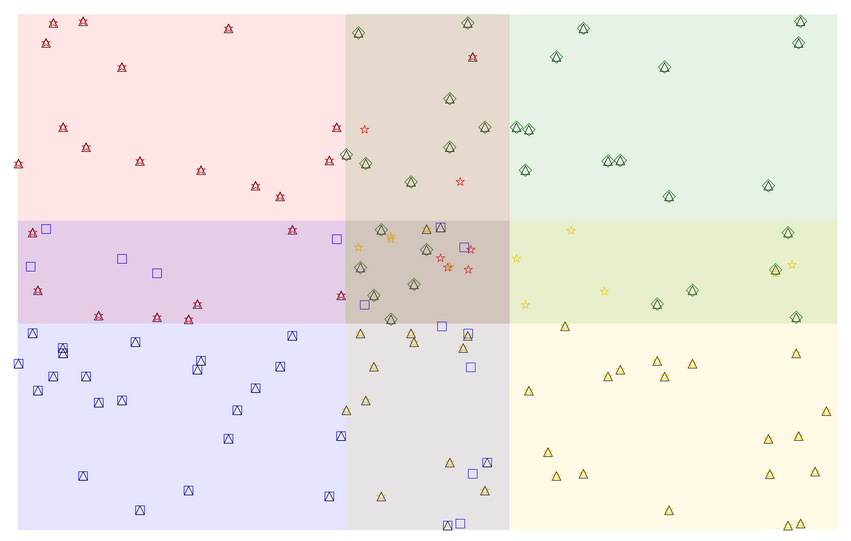
Some quick and dirty test code I wrote:
import numpy as np
import xarray as xr

from starfish import IntensityTable

from starfish.core.types import Coordinates, Features
from starfish.core.types._constants import OverlapStrategy
from starfish.core.codebook.test.factories import codebook_array_factory
from starfish.core.intensity_table.test.factories import create_intensity_table_with_coords
from starfish.core.intensity_table.overlap import Area

import matplotlib.pyplot as plt
import matplotlib.patches


def plot_intensity_tables(intensity_table_plot_specs, concatenated_table):

    fig, ax = plt.subplots(dpi=500)

    for table, color, marker, coord, x_dim, y_dim in intensity_table_plot_specs:
        ax.scatter(table['xc'], table['yc'], facecolors='none', marker=marker, linewidth=0.25, s=15, edgecolors=color)
        rect = matplotlib.patches.Rectangle(coord, x_dim, y_dim, edgecolor='none', facecolor=color, alpha=0.10)
        ax.add_patch(rect)

    ax.scatter(concatenated_table['xc'], concatenated_table['yc'], facecolors='none', marker='^', linewidth=0.25, s=15, edgecolors='black')

    fig.tight_layout()


def create_more_realistic_intensity_table_with_coords(area: Area, n_spots: int=10, random_seed=888) -> IntensityTable:
    codebook = codebook_array_factory()
    it = IntensityTable.synthetic_intensities(
        codebook,
        num_z=1,
        height=50,
        width=50,
        n_spots=n_spots
    )

    np.random.seed(random_seed)
    it[Coordinates.X.value] = xr.DataArray(np.random.uniform(area.min_x, area.max_x, n_spots),
                                           dims=Features.AXIS)
    it[Coordinates.Y.value] = xr.DataArray(np.random.uniform(area.min_y, area.max_y, n_spots),
                                           dims=Features.AXIS)
    # 'Restore' random seed so downstream usages aren't affected
    np.random.seed()

    return it


def test_take_max_of_multiple_overlaps():

    it1 = create_more_realistic_intensity_table_with_coords(Area(min_x=0, max_x=3,
                                                  min_y=2, max_y=5), n_spots=29)
    it2 = create_more_realistic_intensity_table_with_coords(Area(min_x=2, max_x=5,
                                                  min_y=2, max_y=5), n_spots=31)
    it3 = create_more_realistic_intensity_table_with_coords(Area(min_x=0, max_x=3,
                                                  min_y=0, max_y=3), n_spots=37)
    it4 = create_more_realistic_intensity_table_with_coords(Area(min_x=2, max_x=5,
                                                  min_y=0, max_y=3), n_spots=41)

    concatenated = IntensityTable.concatenate_intensity_tables(
        [it1, it2, it3, it4], overlap_strategy=OverlapStrategy.TAKE_MAX)


    tables = [it1, it2, it3, it4]
    colors = ['r', 'g', 'b', 'gold']
    markers = ['*', 'D', 's', '*']
    coords = [(0, 2), (2, 2), (0, 0), (2, 0)]
    x_dims = [3, 3, 3, 3]
    y_dims = [3, 3, 3, 3]

    plot_intensity_tables(zip(tables, colors, markers, coords, x_dims, y_dims), concatenated)


    print(concatenated.sizes[Features.AXIS])
The weird result:
Black Triangles = spots in concatenated
Other colored shapes = spots associated with a given color quadrant

The center quad overlap area shouldn't have that blue square or yellow star surviving in the concatenated table.
Also in the overlap area between yellow and blue, there are two anomalous blue spots that somehow survive the TAKE_MAX process...
Finally there is a surviving red star in the overlap between red and green.
Note also that this test code also doesn't even test for when Z-overlaps might occur.
CC: @berl


