130 Repositories
Python matplotlib-pyplot Libraries
Design your own matplotlib stylefile interactively
Tired of playing with font sizes and other matplotlib parameters every time you start a new project or write a new plotting function? Want all you plots have the same style? Use matplotlib configuration files!

Algorithmic trading using machine learning.
Algorithmic Trading This machine learning algorithm was built using Python 3 and scikit-learn with a Decision Tree Classifier. The program gathers sto

Easily convert matplotlib plots from Python into interactive Leaflet web maps.
mplleaflet mplleaflet is a Python library that converts a matplotlib plot into a webpage containing a pannable, zoomable Leaflet map. It can also embe

High-level geospatial data visualization library for Python.
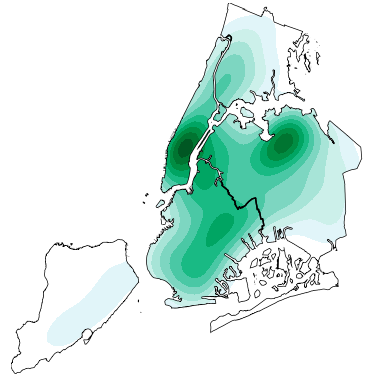
geoplot: geospatial data visualization geoplot is a high-level Python geospatial plotting library. It's an extension to cartopy and matplotlib which m
basemap - Plot on map projections (with coastlines and political boundaries) using matplotlib.
Basemap Plot on map projections (with coastlines and political boundaries) using matplotlib. ⚠️ Warning: this package is being deprecated in favour of

Detect and fix skew in images containing text
Alyn Skew detection and correction in images containing text Image with skew Image after deskew Install and use via pip! Recommended way(using virtual

Visual analysis and diagnostic tools to facilitate machine learning model selection.
Yellowbrick Visual analysis and diagnostic tools to facilitate machine learning model selection. What is Yellowbrick? Yellowbrick is a suite of visual
Painlessly create beautiful matplotlib plots.
Announcement Thank you to everyone who has used prettyplotlib and made it what it is today! Unfortunately, I no longer have the bandwidth to maintain
🧇 Make Waffle Charts in Python.
PyWaffle PyWaffle is an open source, MIT-licensed Python package for plotting waffle charts. It provides a Figure constructor class Waffle, which coul

A python package for animating plots build on matplotlib.
animatplot A python package for making interactive as well as animated plots with matplotlib. Requires Python = 3.5 Matplotlib = 2.2 (because slider

Joyplots in Python with matplotlib & pandas :chart_with_upwards_trend:
JoyPy JoyPy is a one-function Python package based on matplotlib + pandas with a single purpose: drawing joyplots (a.k.a. ridgeline plots). The code f

:small_red_triangle: Ternary plotting library for python with matplotlib
python-ternary This is a plotting library for use with matplotlib to make ternary plots plots in the two dimensional simplex projected onto a two dime
Statistical data visualization using matplotlib
seaborn: statistical data visualization Seaborn is a Python visualization library based on matplotlib. It provides a high-level interface for drawing
matplotlib: plotting with Python
Matplotlib is a comprehensive library for creating static, animated, and interactive visualizations in Python. Check out our home page for more inform
🧇 Make Waffle Charts in Python.
PyWaffle PyWaffle is an open source, MIT-licensed Python package for plotting waffle charts. It provides a Figure constructor class Waffle, which coul

A python package for animating plots build on matplotlib.
animatplot A python package for making interactive as well as animated plots with matplotlib. Requires Python = 3.5 Matplotlib = 2.2 (because slider

Joyplots in Python with matplotlib & pandas :chart_with_upwards_trend:
JoyPy JoyPy is a one-function Python package based on matplotlib + pandas with a single purpose: drawing joyplots (a.k.a. ridgeline plots). The code f

:small_red_triangle: Ternary plotting library for python with matplotlib
python-ternary This is a plotting library for use with matplotlib to make ternary plots plots in the two dimensional simplex projected onto a two dime
Statistical data visualization using matplotlib
seaborn: statistical data visualization Seaborn is a Python visualization library based on matplotlib. It provides a high-level interface for drawing
matplotlib: plotting with Python
Matplotlib is a comprehensive library for creating static, animated, and interactive visualizations in Python. Check out our home page for more inform
pprofile + matplotlib = Python program profiled as an awesome heatmap!
pyheat Profilers are extremely helpful tools. They help us dig deep into code, find and understand performance bottlenecks. But sometimes we just want
Mypy stubs, i.e., type information, for numpy, pandas and matplotlib
Mypy type stubs for NumPy, pandas, and Matplotlib This is a PEP-561-compliant stub-only package which provides type information for matplotlib, numpy

NorthPitch is a python soccer plotting library that sits on top of Matplotlib
NorthPitch is a python soccer plotting library that sits on top of Matplotlib.
A Google Charts API for Python, meant to be used as an alternative to matplotlib.
GooPyCharts A Google Charts API for Python 2 and 3, meant to be used as an alternative to matplotlib. Syntax is similar to MATLAB. The goal of this pr
The windML framework provides an easy-to-use access to wind data sources within the Python world, building upon numpy, scipy, sklearn, and matplotlib. Renewable Wind Energy, Forecasting, Prediction
windml Build status : The importance of wind in smart grids with a large number of renewable energy resources is increasing. With the growing infrastr
Crab is a flexible, fast recommender engine for Python that integrates classic information filtering recommendation algorithms in the world of scientific Python packages (numpy, scipy, matplotlib).
Crab - A Recommendation Engine library for Python Crab is a flexible, fast recommender engine for Python that integrates classic information filtering r

A series of convenience functions to make basic image processing operations such as translation, rotation, resizing, skeletonization, and displaying Matplotlib images easier with OpenCV and Python.
imutils A series of convenience functions to make basic image processing functions such as translation, rotation, resizing, skeletonization, and displ

Launched in 2018 Actively developed and supported. Supports tkinter, Qt, WxPython, Remi (in browser). Create custom layout GUI's simply. Python 2.7 & 3 Support. 200+ Demo programs & Cookbook for rapid start. Extensive documentation. Examples using Machine Learning(GUI, OpenCV Integration, Chatterbot), Floating Desktop Widgets, Matplotlib + Pyplot integration, add GUI to command line scripts, PDF & Image Viewer. For both beginning and advanced programmers .
Python GUIs for Humans Transforms the tkinter, Qt, WxPython, and Remi (browser-based) GUI frameworks into a simpler interface. The window definition i
Statistical data visualization using matplotlib
seaborn: statistical data visualization Seaborn is a Python visualization library based on matplotlib. It provides a high-level interface for drawing
Cartopy - a cartographic python library with matplotlib support
Cartopy is a Python package designed to make drawing maps for data analysis and visualisation easy. Table of contents Overview Get in touch License an