7 Repositories
Python scatter Libraries

Seaborn is one of the go-to tools for statistical data visualization in python. It has been actively developed since 2012 and in July 2018, the author released version 0.9. This version of Seaborn has several new plotting features, API changes and documentation updates which combine to enhance an already great library. This article will walk through a few of the highlights and show how to use the new scatter and line plot functions for quickly creating very useful visualizations of data.
12_Python_Seaborn_Module Introduction 👋 From the website, “Seaborn is a Python data visualization library based on matplotlib. It provides a high-lev

Fast scatter density plots for Matplotlib
About Plotting millions of points can be slow. Real slow... 😴 So why not use density maps? ⚡ The mpl-scatter-density mini-package provides functional

Python module for performing linear regression for data with measurement errors and intrinsic scatter
Linear regression for data with measurement errors and intrinsic scatter (BCES) Python module for performing robust linear regression on (X,Y) data po

Plot, scatter plots and histograms in the terminal using braille dots
Plot, scatter plots and histograms in the terminal using braille dots, with (almost) no dependancies. Plot with color or make complex figures - similar to a very small sibling to matplotlib. Or use the canvas to plot dots and lines yourself.
PyTorch Extension Library of Optimized Scatter Operations
PyTorch Scatter Documentation This package consists of a small extension library of highly optimized sparse update (scatter and segment) operations fo

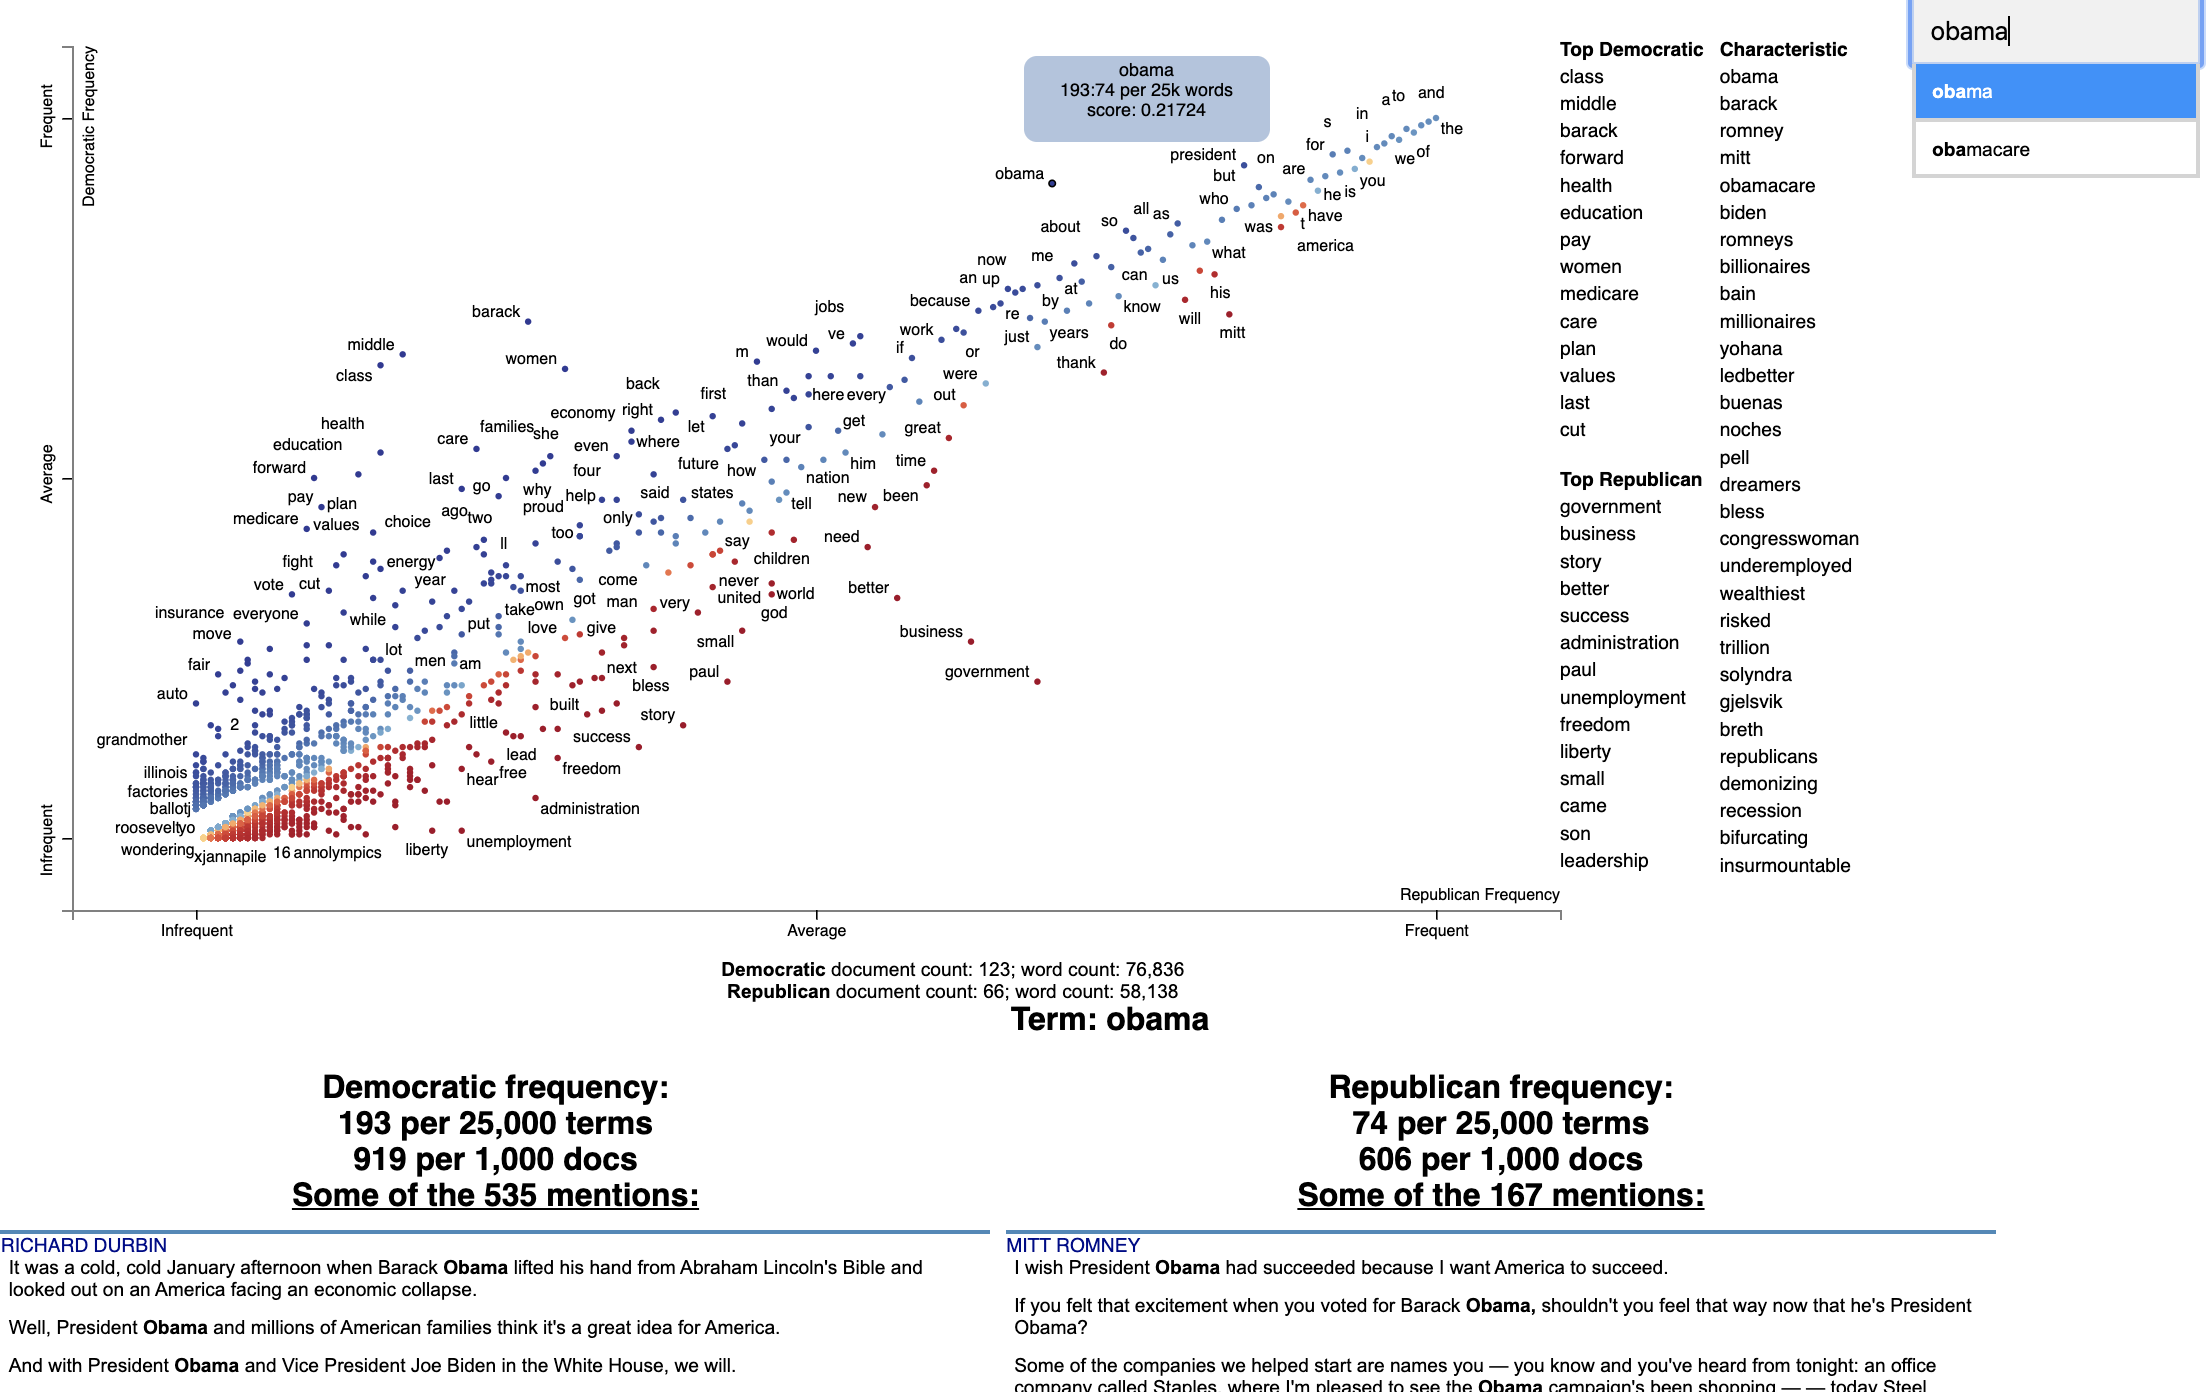
Beautiful visualizations of how language differs among document types.
Scattertext 0.1.0.0 A tool for finding distinguishing terms in corpora and displaying them in an interactive HTML scatter plot. Points corresponding t

Beautiful visualizations of how language differs among document types.
Scattertext 0.1.0.0 A tool for finding distinguishing terms in corpora and displaying them in an interactive HTML scatter plot. Points corresponding t