19 Repositories
Python uml-diagram Libraries

A tool for generating skill map/tree like diagram
skillmap A tool for generating skill map/tree like diagram. What is a skill map/tree? Skill tree is a term used in video games, and it can be used for

A workshop on data visualization in Python with notebooks and exercises for following along.
Beyond the Basics: Data Visualization in Python The human brain excels at finding patterns in visual representations, which is why data visualizations

Image Lowpoly based on Centroid Voronoi Diagram via python-opencv and taichi
CVTLowpoly: Image Lowpoly via Centroid Voronoi Diagram Image Sharp Feature Extraction using Guide Filter's Local Linear Theory via opencv-python. The

Code for Phase diagram of Stochastic Gradient Descent in high-dimensional two-layer neural networks
Phase diagram of Stochastic Gradient Descent in high-dimensional two-layer neural networks Under construction. Description Code for Phase diagram of S

Generate database table diagram from SQL data definition.
sql2diagram Generate database table diagram from SQL data definition. e.g. "CREATE TABLE ..." See Example below How does it works? Analyze the SQL to

A toolkit to generate MR sequence diagrams
mrsd: a toolkit to generate MR sequence diagrams mrsd is a Python toolkit to generate MR sequence diagrams, as shown below for the basic FLASH sequenc

Gaphas is the diagramming widget library for Python.
Gaphas Gaphas is the diagramming widget library for Python. Gaphas is a library that provides the user interface component (widget) for drawing diagra
PcapXray - A Network Forensics Tool - To visualize a Packet Capture offline as a Network Diagram
PcapXray - A Network Forensics Tool - To visualize a Packet Capture offline as a Network Diagram including device identification, highlight important communication and file extraction

A Pythonic framework for threat modeling
pytm: A Pythonic framework for threat modeling Introduction Traditional threat modeling too often comes late to the party, or sometimes not at all. In
Area-weighted venn-diagrams for Python/matplotlib
Venn diagram plotting routines for Python/Matplotlib Routines for plotting area-weighted two- and three-circle venn diagrams. Installation The simples

The Spectral Diagram (SD) is a new tool for the comparison of time series in the frequency domain
The Spectral Diagram (SD) is a new tool for the comparison of time series in the frequency domain. The SD provides a novel way to display the coherence function, power, amplitude, phase, and skill score of discrete frequencies of two time series. Each SD summarises these quantities in a single plot for multiple targeted frequencies.

Interactive Terraform visualization. State and configuration explorer.
Rover - Terraform Visualizer Rover is a Terraform visualizer. In order to do this, Rover: generates a plan file and parses the configuration in the ro

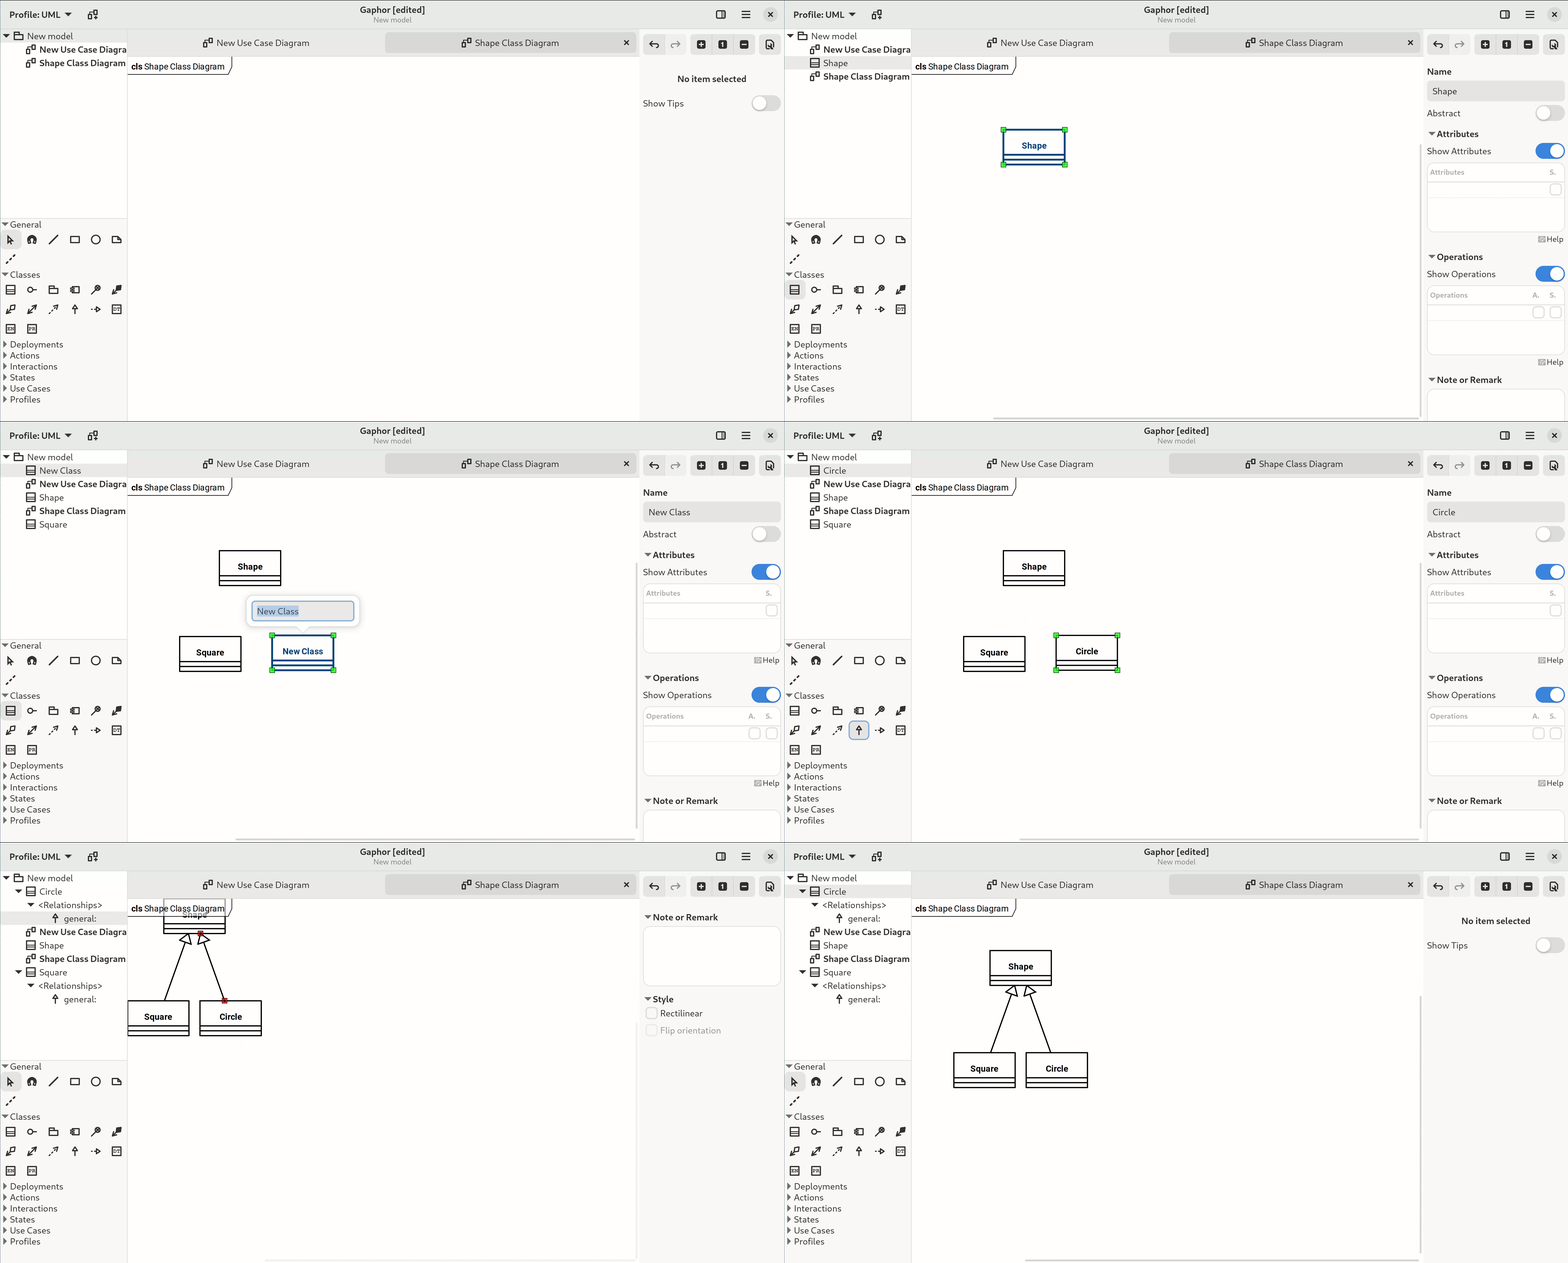
Gaphor is a UML and SysML modeling application written in Python.
Gaphor is a UML and SysML modeling application written in Python. It is designed to be easy to use, while still being powerful. Gaphor implements a fully-compliant UML 2 data model, so it is much more than a picture drawing tool. You can use Gaphor to quickly visualize different aspects of a system as well as create complete, highly complex models.

Gaphor is the simple modeling tool
Gaphor Gaphor is a UML and SysML modeling application written in Python. It is designed to be easy to use, while still being powerful. Gaphor implemen

Gaphor is the simple modeling tool
Gaphor Gaphor is a UML and SysML modeling application written in Python. It is designed to be easy to use, while still being powerful. Gaphor implemen
:art: Diagram as Code for prototyping cloud system architectures
Diagrams Diagram as Code. Diagrams lets you draw the cloud system architecture in Python code. It was born for prototyping a new system architecture d
Django friendly finite state machine support
Django friendly finite state machine support django-fsm adds simple declarative state management for django models. If you need parallel task executio
:art: Diagram as Code for prototyping cloud system architectures
Diagrams Diagram as Code. Diagrams lets you draw the cloud system architecture in Python code. It was born for prototyping a new system architecture d
A lightweight, object-oriented finite state machine implementation in Python with many extensions
transitions A lightweight, object-oriented state machine implementation in Python with many extensions. Compatible with Python 2.7+ and 3.0+. Installa