A small script written in Python3 that generates a visual representation of the Mandelbrot set.

Overview

Mandelbrot Set Generator

A small script written in Python3 that generates a visual representation of the Mandelbrot set.

Mandlebrot set

Abstract

The colors in the output image are in HSV format. The darker pixels represent those areas where the least recursion was made (basically those parts which do not belong in the set), and vice-versa. The algorithm used is, of course:

...where c is a constant complex number.

Dependencies

  • Pillow
    To get it installed, simply do:
pip install Pillow

Installation

To get started, simply clone the repo, cd into it and run it.. it's as easy as it gets...

git clone https://github.com/DarkKnight450/mandelbrot.git
cd mandelbrot
python main.py

The image will be saved in the current working directory as output.png

Customizing output

You may change the resolution of the output image by changing its height and width in main.py

# Image size (pixels)
WIDTH = 3840
HEIGHT = 2160

Further, you may change the recursion depth in mandlebrot.py

MAX_ITER = 1e2

The darker pixels represent those areas where the least recursion was made. In the code snipplet below, color represents the brightness. You may obviously change the HSV values as you want in main.py

draw.point(
    [x, y],
    tuple(
        round(i * 255)
        for i in colorsys.hsv_to_rgb(<hue> / 360, <saturation> / 100, color / 100)
    ),
)
You might also like...
Interactive chemical viewer for 2D structures of small molecules

👀 mols2grid mols2grid is an interactive chemical viewer for 2D structures of small molecules, based on RDKit. ➡️ Try the demo notebook on Google Cola

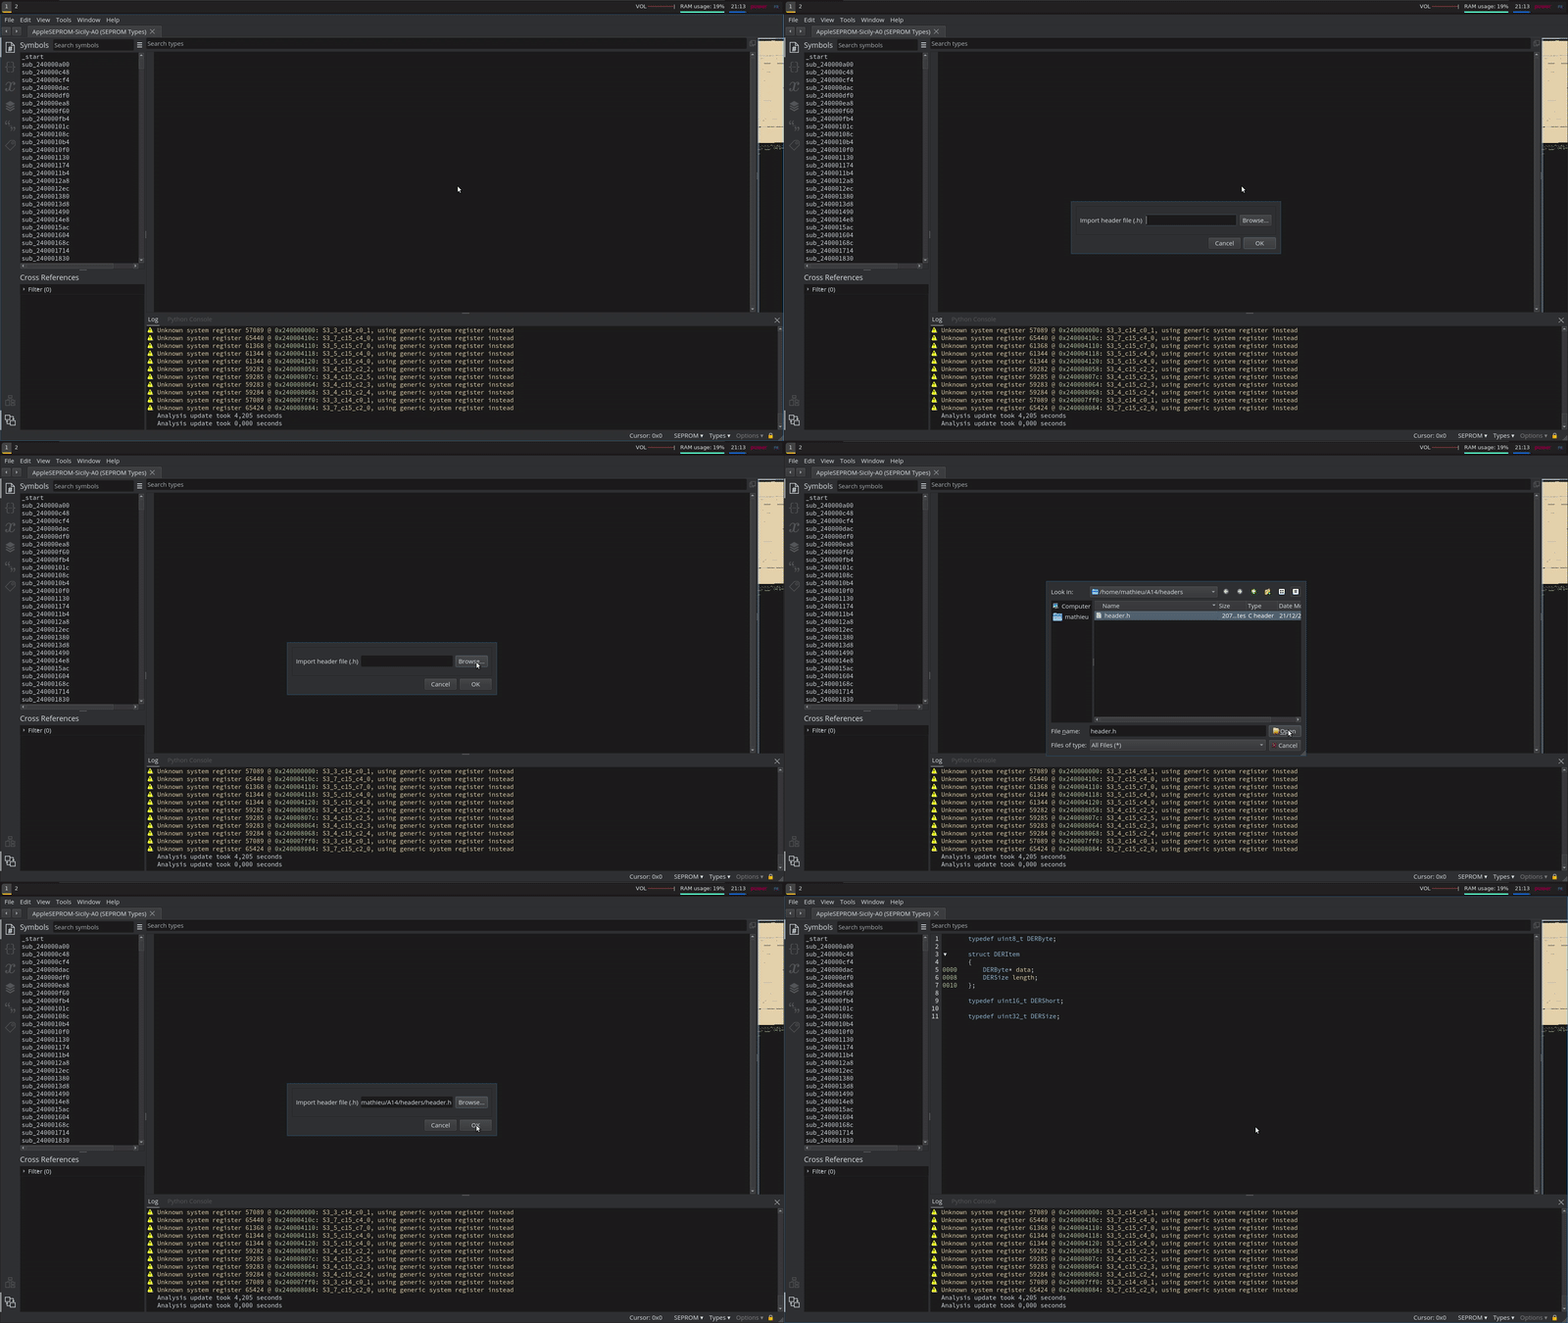
Small binja plugin to import header file to types

binja-import-header (v1.0.0) Author: matteyeux Import header file to Binary Ninja types view Description: Binary Ninja plugin to import types from C h

Visualization of hidden layer activations of small multilayer perceptrons (MLPs)

MLP Hidden Layer Activation Visualization To gain some intuition about the internal representation of simple multi-layer perceptrons (MLPs) I trained

Domain Connectivity Analysis Tools to analyze aggregate connectivity patterns across a set of domains during security investigations

DomainCAT (Domain Connectivity Analysis Tool) Domain Connectivity Analysis Tool is used to analyze aggregate connectivity patterns across a set of dom

Set of matplotlib operations that are not trivial

Matplotlib Snippets This repository contains a set of matplotlib operations that are not trivial. Histograms Histogram with bins adapted to log scale

Data aggregated from the reports found at the MCPS COVID Dashboard into a set of visualizations.

Montgomery County Public Schools COVID-19 Visualizer Contents About this project Data Support this project About this project Data All data we use can

Lumen provides a framework for visual analytics, which allows users to build data-driven dashboards from a simple yaml specification

Lumen project provides a framework for visual analytics, which allows users to build data-driven dashboards from a simple yaml specification

Visual Python is a GUI-based Python code generator, developed on the Jupyter Notebook environment as an extension.

Visual Python is a GUI-based Python code generator, developed on the Jupyter Notebook environment as an extension.

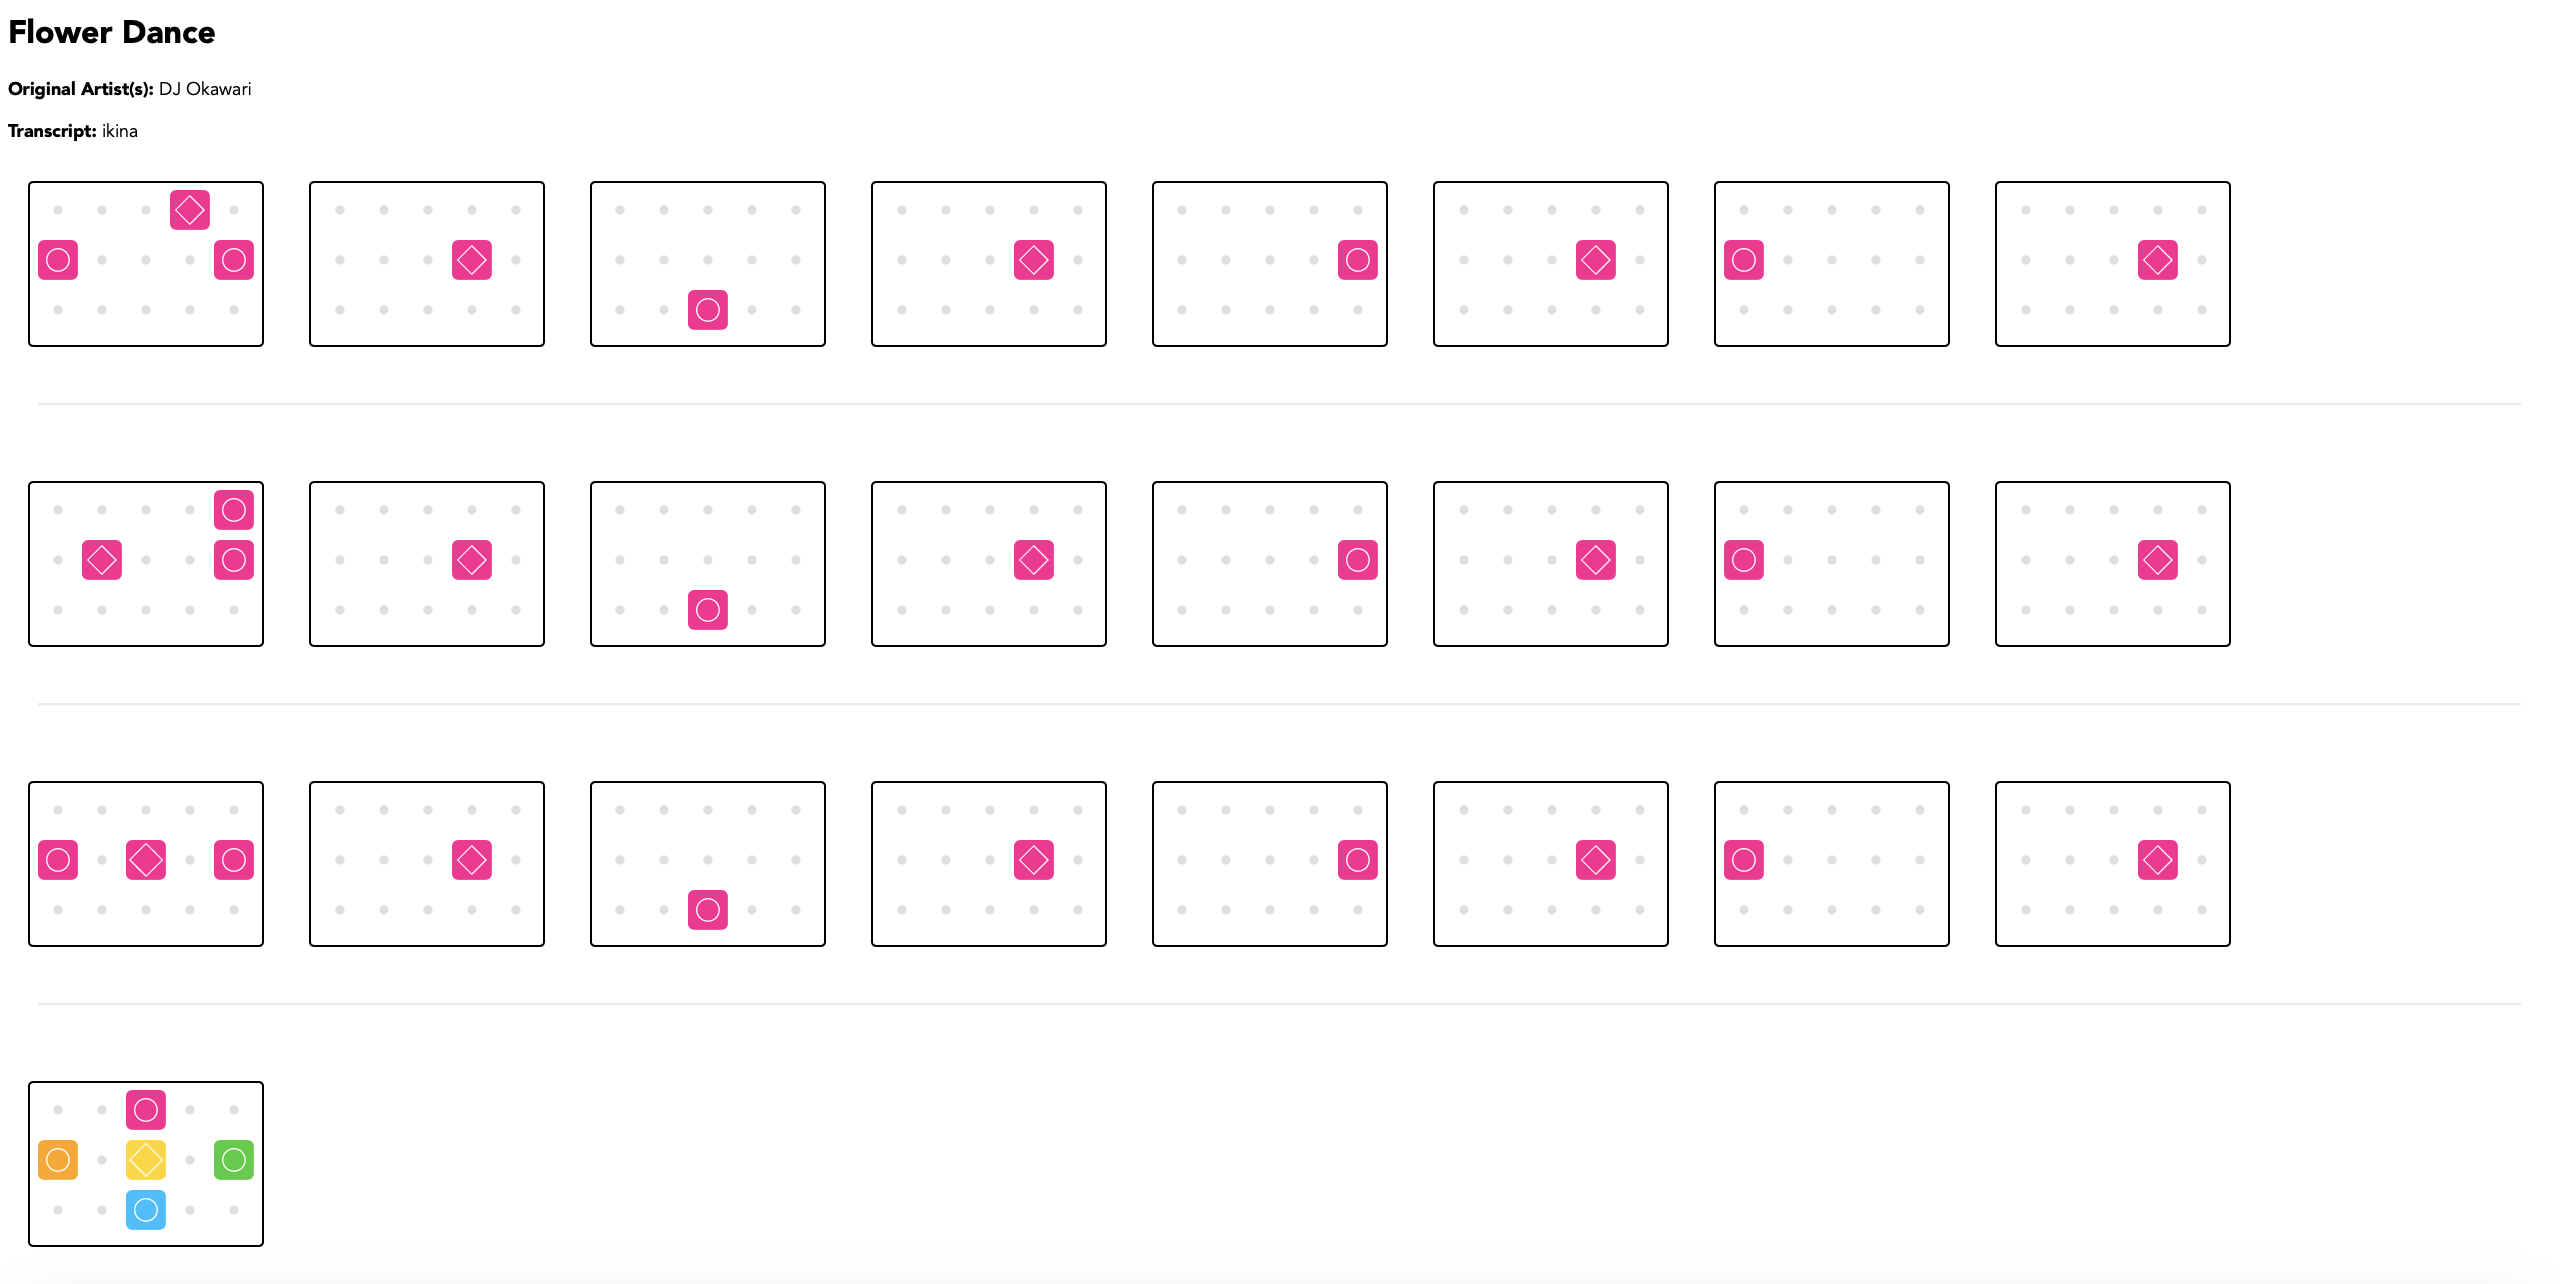
Make visual music sheets for thatskygame (graphical representations of the Sky keyboard)

sky-python-music-sheet-maker This program lets you make visual music sheets for Sky: Children of the Light. It will ask you a few questions, and does

Owner
null
This is a small program that prints a user friendly, visual representation, of your current bsp tree

bspcq, q for query A bspc analyzer (utility for bspwm) This is a small program that prints a user friendly, visual representation, of your current bsp

nedia 9 Apr 24, 2022
Python package that generates hardware pinout diagrams as SVG images

PinOut A Python package that generates hardware pinout diagrams as SVG images. The package is designed to be quite flexible and works well for general

null 336 Dec 20, 2022
A program that analyzes data from inertia measurement units installed in aircraft and generates g-exceedance curves.

A program that analyzes data from inertia measurement units installed in aircraft and generates g-exceedance curves.

Pooya 1 Dec 2, 2021
YOPO is an interactive dashboard which generates various standard plots.

YOPO is an interactive dashboard which generates various standard plots.you can create various graphs and charts with a click of a button. This tool uses Dash and Flask in backend.

ADARSH C 38 Dec 20, 2022
A script written in Python that generate output custom color (HEX or RGB input to x1b hexadecimal)

ColorShell ─ 1.5 Planned for v2: setup.sh for setup alias This script converts HEX and RGB code to x1b x1b is code for colorize outputs, works on ou

Riley 4 Oct 31, 2021
🎨 Python3 binding for `@AntV/G2Plot` Plotting Library .

PyG2Plot ?? Python3 binding for @AntV/G2Plot which an interactive and responsive charting library. Based on the grammar of graphics, you can easily ma

hustcc 990 Jan 5, 2023
Dipto Chakrabarty 7 Sep 6, 2022
This is a small repository for me to implement my simply Data Visualisation skills through Python.

Data Visualisations This is a small repository for me to implement my simply Data Visualisation skills through Python. Steam Population Chart from 10/

null 9 Dec 31, 2021
Small project to recursively calculate and plot each successive order of the Hilbert Curve

hilbert-curve Small project to recursively calculate and plot each successive order of the Hilbert Curve. After watching 3Blue1Brown's video on Hilber

Stefan Mejlgaard 2 Nov 15, 2021
A small collection of tools made by me, that you can use to visualize atomic orbitals in both 2D and 3D in different aspects.

Orbitals in Python A small collection of tools made by me, that you can use to visualize atomic orbitals in both 2D and 3D in different aspects, and o

Prakrisht Dahiya 1 Nov 25, 2021