LabGraph is a a Python-first framework used to build sophisticated research systems with real-time streaming, graph API, and parallelism.

Overview

labgraph-interactive

LabGraph Interactive

Learning LabGraph online.

What is LabGraph?

LabGraph is a a Python-first framework used to build sophisticated research systems with real-time streaming, graph API, and parallelism. Facebook Researchers use it prototype wearable hardware systems and process digital signals under their VR/AR efforts into the Metaverse.

To put it simply, LabGraph sets the relationship between the inputs and outputs of computations and provides the needed tooling to run them in parallel to help developers focus on algorithms instead of the environment.

What is LabGraph Interactive?

As MLH Fellows who have not used LabGraph before, we had a hard time understanding its purpose, how to set it up correctly, and what to expect from the library. So we decided to help future MLH Fellows get up to speed both on concepts and usage with an interactive tool.

We built the interactive tool to let users get the taste of LabGraph with zero commitments. The interactive terminal lets the users run simulations we prepared with different numbers of features and see their expected outputs.

How to Use LabGraph Interactive?

  1. Navigate to the website hosted on GitHub Pages at mlh-fellowship.github.io/labgraph-interactive
  2. Type help into the terminal
  3. Run the commands you would like to try out
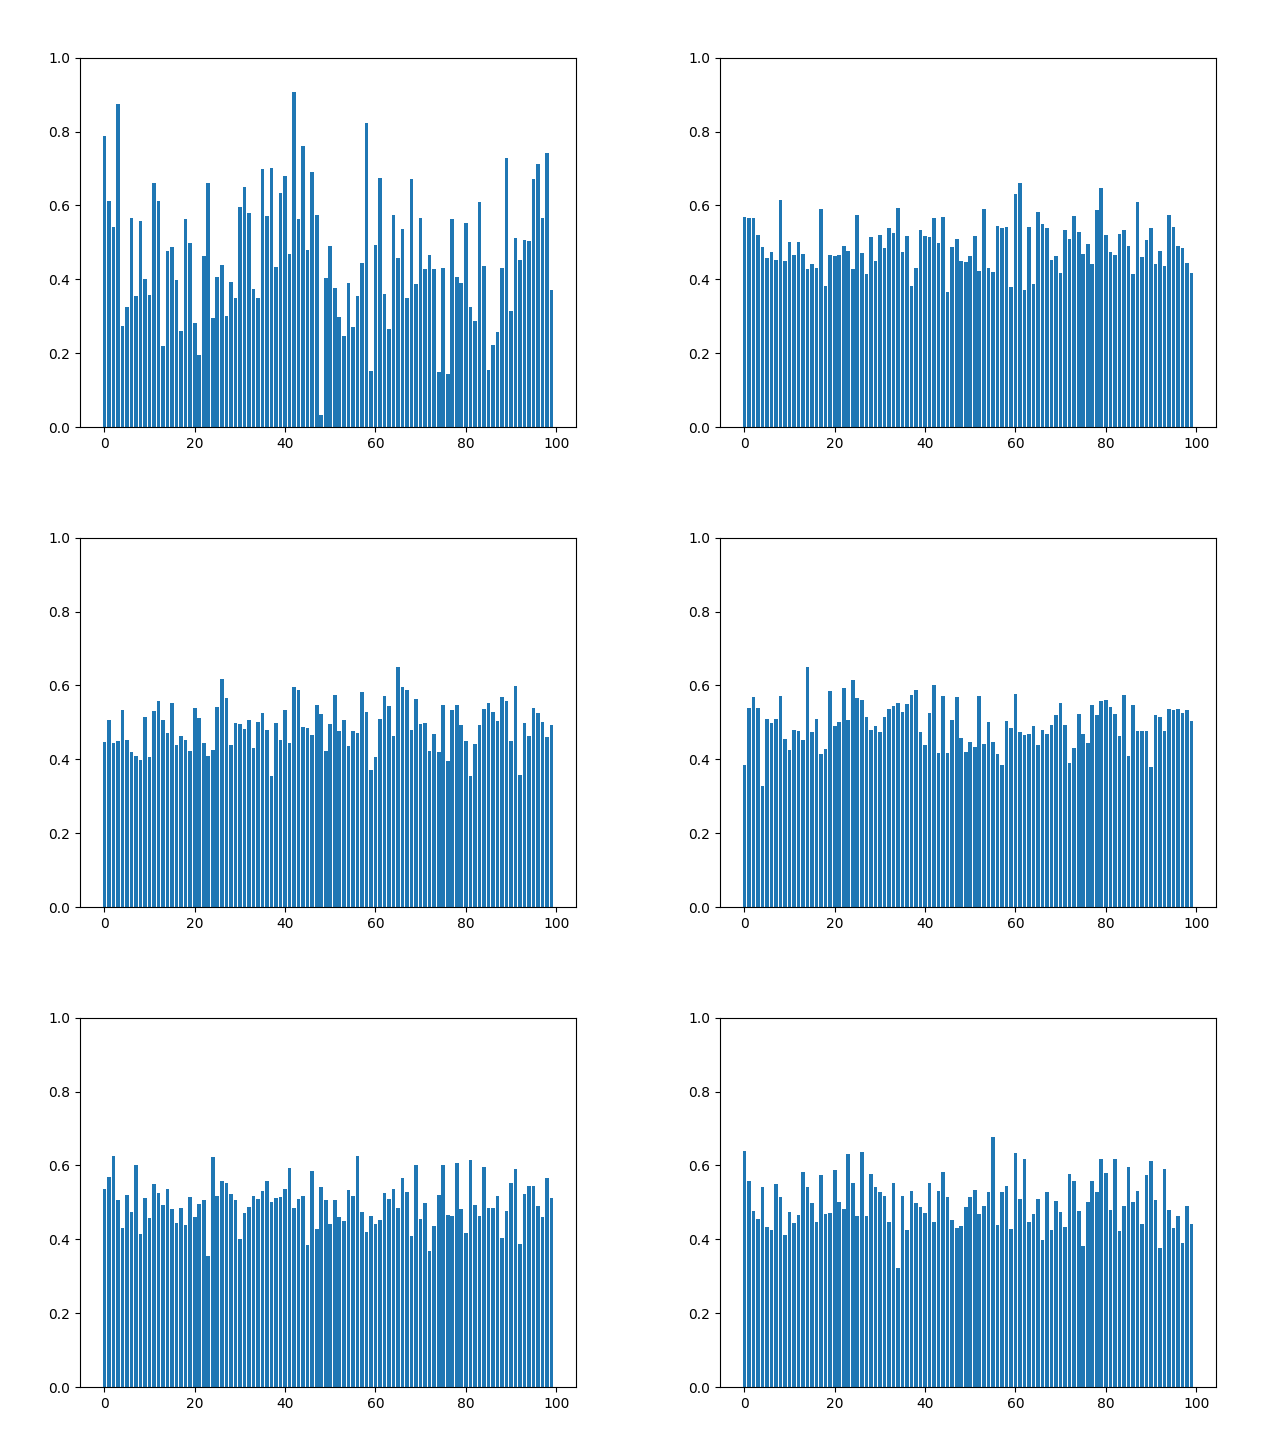
  4. Check the resulted graph built with random data

How to Use LabGraph?

To run LabGraph simulations on your machine, follow steps listed below:

  1. Run pip install labgraph to install LabGraph along with its dependecieis
  2. Run python setup.py install to work with the simulation we prepared and listed under random_labgraph/simulation.py
  3. Run python random_labgraph/simulation.py 100 to get a graph produced with LabGraph's node in real-time

License

This project is served unded the MIT License.

MIT License

Copyright (c) 2022 MLH Fellowship

Permission is hereby granted, free of charge, to any person obtaining a copy
of this software and associated documentation files (the "Software"), to deal
in the Software without restriction, including without limitation the rights
to use, copy, modify, merge, publish, distribute, sublicense, and/or sell
copies of the Software, and to permit persons to whom the Software is
furnished to do so, subject to the following conditions:

The above copyright notice and this permission notice shall be included in all
copies or substantial portions of the Software.

THE SOFTWARE IS PROVIDED "AS IS", WITHOUT WARRANTY OF ANY KIND, EXPRESS OR
IMPLIED, INCLUDING BUT NOT LIMITED TO THE WARRANTIES OF MERCHANTABILITY,
FITNESS FOR A PARTICULAR PURPOSE AND NONINFRINGEMENT. IN NO EVENT SHALL THE
AUTHORS OR COPYRIGHT HOLDERS BE LIABLE FOR ANY CLAIM, DAMAGES OR OTHER
LIABILITY, WHETHER IN AN ACTION OF CONTRACT, TORT OR OTHERWISE, ARISING FROM,
OUT OF OR IN CONNECTION WITH THE SOFTWARE OR THE USE OR OTHER DEALINGS IN THE
SOFTWARE.
You might also like...
Friday Night Funkin - converts a chart from 4/4 time to 6/8 time, or from regular to swing tempo.

Chart to swing converter As seen in https://twitter.com/i_winxd/status/1462220493558366214 A program written in python that converts a chart from 4/4

The implementation of the paper
The implementation of the paper "HIST: A Graph-based Framework for Stock Trend Forecasting via Mining Concept-Oriented Shared Information".

The HIST framework for stock trend forecasting The implementation of the paper "HIST: A Graph-based Framework for Stock Trend Forecasting via Mining C

A python package for animating plots build on matplotlib.

animatplot A python package for making interactive as well as animated plots with matplotlib. Requires Python = 3.5 Matplotlib = 2.2 (because slider

A python package for animating plots build on matplotlib.

animatplot A python package for making interactive as well as animated plots with matplotlib. Requires Python = 3.5 Matplotlib = 2.2 (because slider

A little logger for machine learning research

dowel dowel is a little logger for machine learning research. Installation pip install dowel Usage import dowel from dowel import logger, tabular log

I'm doing Genuary, an aritifiacilly generated month to build code that make beautiful things

Genuary 2022 I'm doing Genuary, an aritifiacilly generated month to build code that make beautiful things. Every day there is a new prompt for making

Using SQLite within Python to create database and analyze Starcraft 2 units data (Pandas also used)

SQLite python Starcraft 2 English This project shows the usage of SQLite with python. To create, modify and communicate with the SQLite database from

Simple CLI python app to show a stocks graph performance. Made with Matplotlib and Tiingo.

stock-graph-python Simple CLI python app to show a stocks graph performance. Made with Matplotlib and Tiingo. Tiingo API Key You will need to add your

Fastest Gephi's ForceAtlas2 graph layout algorithm implemented for Python and NetworkX

ForceAtlas2 for Python A port of Gephi's Force Atlas 2 layout algorithm to Python 2 and Python 3 (with a wrapper for NetworkX and igraph). This is the

Comments
  • Added LabGraph simulation file

    Added LabGraph simulation file

    Description

    The simulation file lets us run python setup.py install and then python simulation.py to reproduce the resulted LabGraph simulations with randomly generated data. It follows concepts listed under the LabGraph documenation on Concepts.

    Type of change

    Please delete options that are not relevant.

    • [X] New feature (non-breaking change which adds functionality)
    • [X] This change requires a documentation update

    Checklist:

    • [X] My code follows the style guidelines of this project
    • [X] I have performed a self-review of my own code
    • [X] I have commented my code, particularly in hard-to-understand areas
    • [X] I have made corresponding changes to the documentation
    • [X] My changes generate no new warnings
    • [X] Any dependent changes have been merged and published in downstream modules
    opened by dtemir 0
Owner
MLH Fellowship
An internship alternative for software engineers, by Major League Hacking
MLH Fellowship
Python toolkit for defining+simulating+visualizing+analyzing attractors, dynamical systems, iterated function systems, roulette curves, and more

Attractors A small module that provides functions and classes for very efficient simulation and rendering of iterated function systems; dynamical syst

null 1 Aug 4, 2021
Generate a roam research like Network Graph view from your Notion pages.

Notion Graph View Export Notion pages to a Roam Research like graph view.

Steve Sun 214 Jan 7, 2023
ICS-Visualizer is an interactive Industrial Control Systems (ICS) network graph that contains up-to-date ICS metadata

ICS-Visualizer is an interactive Industrial Control Systems (ICS) network graph that contains up-to-date ICS metadata (Name, company, port, user manua

QeeqBox 2 Dec 13, 2021
Python ts2vg package provides high-performance algorithm implementations to build visibility graphs from time series data.

ts2vg: Time series to visibility graphs The Python ts2vg package provides high-performance algorithm implementations to build visibility graphs from t

Carlos Bergillos 26 Dec 17, 2022
This repository contains a streaming Dataflow pipeline written in Python with Apache Beam, reading data from PubSub.

Sample streaming Dataflow pipeline written in Python This repository contains a streaming Dataflow pipeline written in Python with Apache Beam, readin

Israel Herraiz 9 Mar 18, 2022
Streaming pivot visualization via WebAssembly

Perspective is an interactive visualization component for large, real-time datasets. Originally developed for J.P. Morgan's trading business, Perspect

The Fintech Open Source Foundation (www.finos.org) 5.1k Dec 27, 2022
Streaming pivot visualization via WebAssembly

Perspective is an interactive visualization component for large, real-time datasets. Originally developed for J.P. Morgan's trading business, Perspect

The Fintech Open Source Foundation (www.finos.org) 3.2k Feb 18, 2021
Lumen provides a framework for visual analytics, which allows users to build data-driven dashboards from a simple yaml specification

Lumen project provides a framework for visual analytics, which allows users to build data-driven dashboards from a simple yaml specification

HoloViz 120 Jan 4, 2023
Time series visualizer is a flexible extension that provides filling world map by country from real data.

Time-series-visualizer Time series visualizer is a flexible extension that provides filling world map by country from csv or json file. You can know d

Long Ng 3 Jul 9, 2021
In-memory Graph Database and Knowledge Graph with Natural Language Interface, compatible with Pandas

CogniPy for Pandas - In-memory Graph Database and Knowledge Graph with Natural Language Interface Whats in the box Reasoning, exploration of RDF/OWL,

Cognitum Octopus 34 Dec 13, 2022