I'm doing Genuary, an aritifiacilly generated month to build code that make beautiful things

Overview

Genuary 2022

I'm doing Genuary, an aritifiacilly generated month to build code that make beautiful things. Every day there is a new prompt for making new art with code.

To check out the prompts look here.

I'm just starting to try out Generative art, so I'm doing the prompts that I found interesting.

Requierements

to install the neccesary libraries to run the code, run the following command:

pip install -r requierements/base.txt

Examples

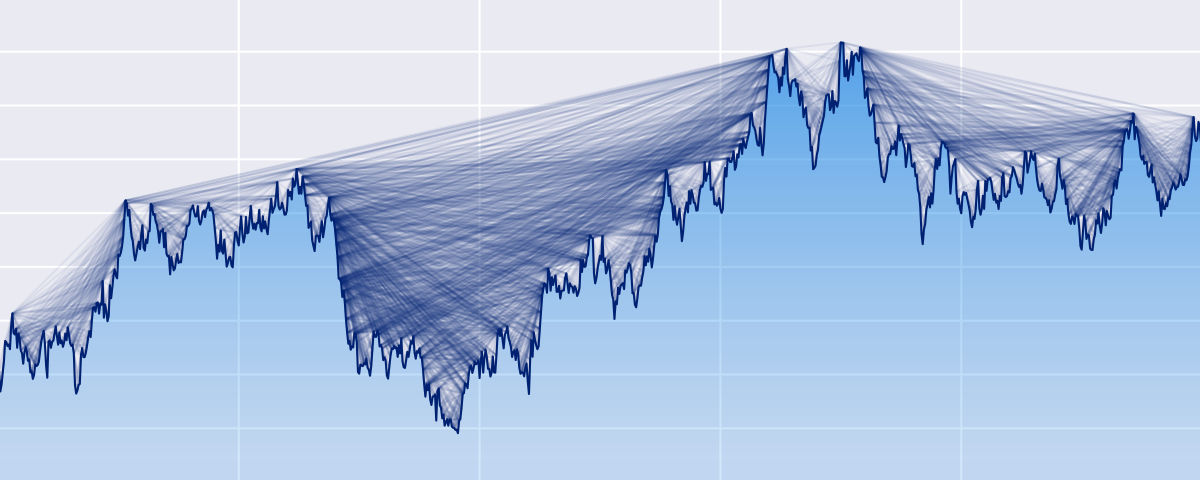
Here is an example of day 7 prompt:

Sol LeWitt Wall Drawing

day_7

I've followed the instructions of Sol Lewitt-Wall Painting 118:

“On a wall surface, any
continuous stretch of wall,
using a hard pencil, place
fifty points at random.
The points should be evenly
distributed over the area
of the wall. All of the
points should be connected
by straight lines. “
You might also like...
Lumen provides a framework for visual analytics, which allows users to build data-driven dashboards from a simple yaml specification

Lumen project provides a framework for visual analytics, which allows users to build data-driven dashboards from a simple yaml specification

Python ts2vg package provides high-performance algorithm implementations to build visibility graphs from time series data.

ts2vg: Time series to visibility graphs The Python ts2vg package provides high-performance algorithm implementations to build visibility graphs from t

LabGraph is a a Python-first framework used to build sophisticated research systems with real-time streaming, graph API, and parallelism.

LabGraph is a a Python-first framework used to build sophisticated research systems with real-time streaming, graph API, and parallelism.

🧇 Make Waffle Charts in Python.

PyWaffle PyWaffle is an open source, MIT-licensed Python package for plotting waffle charts. It provides a Figure constructor class Waffle, which coul

🧇 Make Waffle Charts in Python.

PyWaffle PyWaffle is an open source, MIT-licensed Python package for plotting waffle charts. It provides a Figure constructor class Waffle, which coul

Make sankey, alluvial and sankey bump plots in ggplot

The goal of ggsankey is to make beautiful sankey, alluvial and sankey bump plots in ggplot2

GitHubPoster  - Make everything a GitHub svg poster
GitHubPoster - Make everything a GitHub svg poster

GitHubPoster Make everything a GitHub svg poster 支持 Strava 开心词场 扇贝 Nintendo Switch GPX 多邻国 Issue

Make your BSC transaction simple.

bsc_trade_history Make your BSC transaction simple. 中文ReadMe Background: inspired by debank ,Practice my hands on this small project Blog:Crypto-BscTr

Make visual music sheets for thatskygame (graphical representations of the Sky keyboard)

sky-python-music-sheet-maker This program lets you make visual music sheets for Sky: Children of the Light. It will ask you a few questions, and does

Owner
Joaquín Feltes
Estudiante de Licenciatura en Ciencias de la Computación, FaMAF
Joaquín Feltes
Editor and Presenter for Manim Generated Content.

Editor and Presenter for Manim Generated Content. Take a look at the Working Example. More information can be found on the documentation. These Browse

Manim Community 149 Dec 29, 2022
A python-generated website for visualizing the novel coronavirus (COVID-19) data for Greece.

COVID-19-Greece A python-generated website for visualizing the novel coronavirus (COVID-19) data for Greece. Data sources Data provided by Johns Hopki

Isabelle Viktoria Maciohsek 23 Jan 3, 2023
UNMAINTAINED! Renders beautiful SVG maps in Python.

Kartograph is not maintained anymore As you probably already guessed from the commit history in this repo, Kartograph.py is not maintained, which mean

null 1k Dec 9, 2022
Painlessly create beautiful matplotlib plots.

Announcement Thank you to everyone who has used prettyplotlib and made it what it is today! Unfortunately, I no longer have the bandwidth to maintain

Olga Botvinnik 1.6k Jan 6, 2023
This package creates clean and beautiful matplotlib plots that work on light and dark backgrounds

This package creates clean and beautiful matplotlib plots that work on light and dark backgrounds. Inspired by the work of Edward Tufte.

Nico Schlömer 205 Jan 7, 2023
Python module for drawing and rendering beautiful atoms and molecules using Blender.

Batoms is a Python package for editing and rendering atoms and molecules objects using blender. A Python interface that allows for automating workflows.

Xing Wang 1 Jul 6, 2022
Collection of scripts for making high quality beautiful math-related posters.

Poster Collection of scripts for making high quality beautiful math-related posters. The poster can have as large printing size as 3x2 square feet wit

Nattawut Phetmak 3 Jun 9, 2022
🐍PyNode Next allows you to easily create beautiful graph visualisations and animations

PyNode Next A complete rewrite of PyNode for the modern era. Up to five times faster than the original PyNode. PyNode Next allows you to easily create

ehne 3 Feb 12, 2022
A python package for animating plots build on matplotlib.

animatplot A python package for making interactive as well as animated plots with matplotlib. Requires Python >= 3.5 Matplotlib >= 2.2 (because slider

Tyler Makaro 394 Dec 18, 2022
A python package for animating plots build on matplotlib.

animatplot A python package for making interactive as well as animated plots with matplotlib. Requires Python >= 3.5 Matplotlib >= 2.2 (because slider

Tyler Makaro 356 Feb 16, 2021